The massive satellite population of Milky Way-sized galaxies
Abstract
Several occupational distributions for satellite galaxies more massive than M⊙ around Milky-Way (MW)-sized hosts are presented and used to predict the internal dynamics of these satellites as a function of . For the analysis, a large galaxy group mock catalog is constructed on the basis of (sub)halo-to-stellar mass relations fully constrained with currently available observations, namely the galaxy stellar mass function decomposed into centrals and satellites, and the two-point correlation functions at different masses. We find that of MW-sized galaxies host 2 satellites in the mass range of the Small and Large Magellanic Clouds (SMC and LMC, respectively). The probabilities of the MW-sized galaxies to have 1 satellite equal or larger than the LMC or 2 satellites equal or larger than the SMC or 3 satellites equal or larger than Saggitarius (Sgr) are , and , respectively. The cumulative satellite mass function of the MW, , down to the mass of the Fornax dwarf is within the distribution of all the MW-sized galaxies. We find that MW-sized hosts with 3 satellites more massive than Sgr (as the MW) are among the most common cases. However, the most and second most massive satellites in these systems are smaller than the LMC and SMC by roughly 0.7 and 0.8 dex, respectively. We conclude that the distribution for MW-sized galaxies is quite broad, the particular case of the MW being of low frequency but not an outlier. The halo mass of MW-sized galaxies correlates only weakly with . Then, it is not possible to accurately determine the MW halo mass by means of its ; from our catalog we constrain a lower limit of M⊙ at the level. Our analysis strongly suggests that the abundance of massive subhalos should agree with the abundance of massive satellites in all MW-sized hosts, i.e. there is not a (massive) satellite missing problem for the CDM cosmology. However, we confirm that the maximum circular velocity, , of the subhalos of satellites smaller than M⊙ is systematically larger than the inferred from current observational studies of the MW bright dwarf satellites; at difference of previous works, this conclusion is based on an analysis of the overall population of MW-sized galaxies. Some pieces of evidence suggest that the issue could refer only to satellite dwarfs but not to central dwarfs; then, environmental processes associated to dwarfs inside host halos combined with SN-driven core expansion should be at the basis of the lowering of .
Subject headings:
dark matter — Galaxy: halo — galaxies: dwarf — galaxies: luminosity function, mass function — galaxies: statistics — Magellanic Clouds1. Introduction
According to the current paradigm of cosmic structure formation and evolution, galaxies form inside Cold Dark Matter (CDM) halos, which grow both by diffuse mass accretion and by incorporation of smaller halos that become subhalos. Inside the subhalos (at least inside the more massive ones) galaxies should also have formed prior to their halo’s infall, becoming satellite galaxies. Therefore, the present-day population of satellites around central galaxies is the product of the halo/subhalo assembly and the survival/destruction history of the the galaxies inside the subhalos. The N-body simulations within the context of the CDM cosmological scenario provide us with the subhalo conditional mass function (subHCMF) as a function of host halo mass (see for recent results, e.g., Springel et al., 2008; Giocoli, Tormen & van den Bosch, 2008; Boylan-Kolchin et al., 2010; Gao et al., 2011; Behroozi, Wechsler & Conroy, 2012). Using this function and statistical models constrained by observations, the central/satellite–halo/subhalo mass connection can be established (e.g., Busha et al., 2011b; Rodríguez-Puebla, Avila-Reese & Drory, 2013, hereafter RAD13). In this way, the abundances of the galaxy satellite population as a function of can be calculated (satellite conditional stellar mass function, CSMF). In this paper, our interest is focused on these abundances for systems with a central galaxy of Milky Way (MW) stellar mass, .
With the advent of large galaxy surveys, some observational statistical studies of the satellite abundance of central galaxies, in particular those of MW luminosity or mass, have beed published. Several statistical distributions have been determined this way, for instance, the fractions of MW-sized galaxies with a given number of satellites in the mass range of the Magellanic Clouds (MC) or with masses equal or larger than the LMC or the SMC (James & Ivory, 2011; Tollerud et al., 2011; Liu et al., 2011; Busha et al., 2011a; Robotham et al., 2012). A natural question is whether the CDM scenario makes predictions in agreement with these statistical results related to scales smaller than previously probed.
The works mentioned above conclude that the MW is a rare case with significantly more massive (MC-sized) satellites than other galaxies of similar luminosity or mass. Other studies determine the average luminosity distribution of bright satellites around centrals (Lares, Lambas & Domínguez, 2011; Guo et al., 2011; Wang & White, 2012; Strigari & Wechsler, 2012; Jiang, Jing & Li, 2012; Sales et al., 2013). The distribution of the MW bright satellites seems to lie above the average found for MW-sized galaxies. In spite of all of these studies, it is not yet clear whether the satellite luminosity (mass) distribution of the MW is rare in a statistically significant sense. It could be that the MW-sized galaxies have a broad range of satellite luminosity distributions, the MC-like case being not particularly frequent but not an outlier.
The question on how typical is the MW satellite mass distribution has acquired relevance recently. This distribution, being the best studied one, is used to compare with subhalo distributions predicted in the context of the CDM and alternative cosmological scenarios in order to test these scenarios at the smallest scales (c.f. Boylan-Kolchin, Bullock & Kaplinghat, 2011, 2012; Lovell et al., 2012; Vogelsberger, Zavala & Loeb, 2012; Zavala, Vogelsberger & Walker, 2013). However, such a comparison relies (i) on the hope that the MW satellite CSMF is not atypical and (ii) on the assumed halo mass for the MW (the subhalo abundance strongly depends on , Gao et al., 2011; Wang et al., 2012, e.g.,). For example, Boylan-Kolchin et al. (2011b,2012) have shown that for a few CDM halos of M⊙ resimulated at very high resolution, there is a significant excess of subhalos with too high masses or maximum circular velocities ( km/s) with respect to what is inferred for the MW satellite population (the so-called “too big to fail” problem). By means of an analytical model for generating a large sample of CDM halos with their corresponding subhalo populations, Purcell & Zentner (2012) propose that the large variation in the latter among different host halos ameliorates the “too big to fail” problem: at least of their MW-sized halos host subhalo populations in agreement with the MW dwarf satellite kinematics. Wang et al. (2012) suggest that the problem is ameliorated if the MW halo mass is simply less massive than is commonly thought, M⊙.
In all of these works, the main caveats are the way the MW satellite population is put into the statistical context, and the way the populations of the predicted subhalos and of the observed MW satellites are matched. Here, we attempt to overcome these caveats by using a large mock catalog of MW-sized galaxies, constructed on the basis of (sub)halo-to-stellar mass relations fully constrained with currently available observations, namely the galaxy stellar mass function, GSMF, decomposed into centrals and satellites, and the projected two-point correlation functions, 2PCFs, measured at different stellar mass bins (for references see Section 2). While these observations are complete only down to M⊙, the occupational procedure used to construct the catalog allows one to ”extrapolate” observations down to the stellar masses that match the minimum halo/subhalo masses considered here. In RDA13 (see also Busha et al., 2011b), a preliminary attempt of studying the massive satellite population of MW-sized galaxies has been presented; however, in that paper the results are given as a function of instead of , which introduces freedom to choose the right to be used for the MW.
Our main result from analyzing the mock catalog is that the CDM scenario is statistically consistent with observations regarding the abundances and internal dynamics of satellites in MW-sized galaxies down to satellite stellar masses M⊙. At lower masses, down to the limit of our study ( M⊙), the abundances continue being consistent but the internal dynamics of observed dwarf satellites suggest that their subhalos have values smaller than those of the CDM subhalos, under the assumption that the of the latter remain the same after galaxy formation and evolution. Our conclusions are not affected by uncertainties on the matching of subhalo-satellite abundances, on the statistical interpretation of the MW nor on the halo MW mass. Regarding the latter, we instead find the distribution of the MW analogs (see also Busha et al., 2011a).
The layout of this paper is as follows. In Section 2 we briefly describe the semi-empirical occupational approach for linking galaxies to halos and subhalos and how, by using the results of this approach, we construct a mock catalog of 2 million central galaxies, each one with its satellite population down to M⊙. From this catalog, we select a subsample of about 41000 central galaxies with MW-like stellar masses. In Section 3, we present different statistical distributions for the massive satellite population of the MW-sized galaxies and compare them to some observational studies. We investigate the question of how common the MW satellite mass distribution is in §§3.1, while in §§ 3.2 we present the halo mass distribution of the MW analogs. In Section 4 we present vs. stellar mass for the mock galaxy (both satellites and centrals) and compare with observations. Our conclusions and a discussion are given in Section 5. We adopt cosmological parameter values close to WMAP 7: , , , , and .
2. The method
In what follows, we briefly review the semi-empirical approach we use for connecting galaxies to halos and subhalos of different masses. For an extensive presentation of this approach, see Section 2 of RAD13. The approach relies on the assumption that the central-to-halo and satellite-to-subhalo mass relations (CHMR and SSMR, respectively) are monotonic. By parametrizing these mass relations, with their intrinsic scatter included, one can use the predicted CDM distinct halo and conditional subhalo mass functions (HMF and subHCMF) to generate the halo/subhalo occupational distributions both for central and satellite galaxies. Therefore, this method encapsulates the main ideas behind the abundance matching technique, the halo occupation distribution model, and the conditional stellar mass function formalism (RAD13 see for references therein; see also Rodríguez-Puebla, Drory & Avila-Reese, 2012). The advantage of the approach is that all the relevant observed statistical distributions of central and satellite galaxies (the GSMF decomposed into centrals and satellites, the CSMFs, and the 2PCFs) are consistently related to each other and with the predicted halo/subhalo statistical distributions (the HMF and subHCMF).
The outputs of this approach are the CHMR and SSMR, including their intrinsic scatters, and the satellite CSMFs as a function of halo mass . Here we will use the best constrained CHMR and SSMR obtained in RAD13. These relations were (over)constrained by making use of all the available observational information (data set C in RAD13): the central and satellite GSMFs determined by Yang, Mo & van den Bosch (2009) down to M⊙ and the projected 2PCFs determined by Yang et al. (2012) in five stellar mass bins. For the distinct HMF and subHCMF, the Tinker et al. (2008) and Boylan-Kolchin et al. (2010, see also Boylan-Kolchin et al. 2008; Gao et al. 2011) fits to cosmological simulations were used, respectively.
2.1. The galaxy group mock catalog
Instead of using the analytical CHMR and SSMR directly, we apply these functions and their scatters to generate a mock galaxy group catalog. With this catalog we will explore several statistical satellite distributions that can be compared with some direct observational determinations given as a function of the central stellar mass. The catalog is generated as follows:
-
•
From a minimum halo mass of , a population of halos is sampled from the distinct HMF. Each halo is randomly picked from this function by generating a random number uniformly distributed between 0 and 1 and finding the value for that solves the equation . Here is the cumulative distinct HMF.
-
•
To each halo a central galaxy with stellar mass is assigned randomly from the probability distribution , i.e. the mean – relation and its intrinsic scatter which is assumed to be lognormal distributed with a width of 0.173 dex (see RAD13).
-
•
To each halo defined by its mass a subhalo population above M⊙ is assigned randomly by assuming a Poisson distribution (Kravtsov et al., 2004; Boylan-Kolchin et al., 2010). First, the total number of subhalos, , above is specified by choosing an integer from a Poisson distribution with mean , where this mean number is taken from the subHCMF for the given . Then, the mass for each subhalo is assigned by solving the equation , where again is a random number uniformly distributed between 0 and 1. Note that this last step should be repeated times in order to assign subhalo masses to each one of the subhalos. The lower limit in subhalo mass is enough to sample satellite galaxies with stellar masses larger than , see Fig. 7 of RAD13.
-
•
To each subhalo we assign a satellite galaxy with stellar mass , taken from the probability distribution , i.e. the mean – relation and an intrinsic scatter, assumed to be lognormal distributed with a width equal to the central/halo case (the latter assumption seems to be reasonable, see RAD13).
The mock catalog generated in this way reproduces the observational statistical functions used to constrain the CHMR and SSMR, namely the GSMF separated into central and satellite galaxies and the 2PCFs in several mass bins. However, the catalog contains much more information, which can be thought as an “extension” as well as an extrapolation to lower masses of the observations. In particular, we can find the overall satellite number distributions down to M⊙ around galaxies of a given stellar mass .
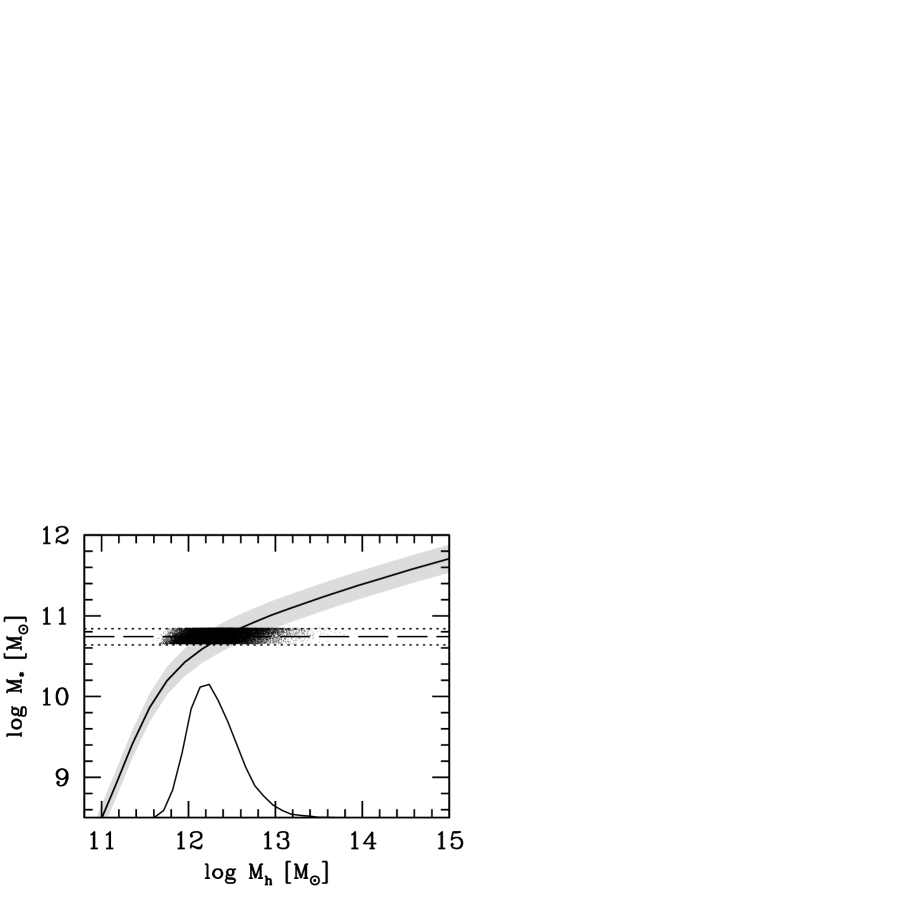
Fig. 1 illustrates the mean CHMR (solid line) and its scatter (0.173 dex; gray shaded area) for the data set C as reported in RAD13. The 2 million of mock central galaxies sample this distribution by construction. The short dashed line indicates the mass of central galaxies with while the dotted lines are 0.1 dex above and below defining a subsample of galaxies with stellar masses in the bin (/M⊙), which corresponds to the stellar mass estimate for the MW (Flynn et al., 2006). The 40694 realizations out of the 2 millions that fall within this narrow range are represented using black dots (MW-sized galaxies). The shape of the resulting distribution of this subsample of central galaxies as a function of is shown in the bottom panel of the figure. The mean and the standard deviation for this distribution are log(/M⊙).
3. Results and comparison to observations
In the previous Section, we generated a mock catalog of central galaxies corresponding to the stellar mass estimates for the MW. These galaxies have halos in a broad range of masses (see Fig. 1). From this sample, we can then establish the fractions (probabilities) of systems with satellites within a (stellar) mass range or above a given mass; this mass can not be smaller than M⊙, the minimal mass used to construct the mock catalog (see §§2.1). Therefore, our results will be restricted to the population of the largest satellites.
For the statistical calculations, we will assume that the stellar masses of the LMC and SMC satellite galaxies are M⊙ and M⊙ (James & Ivory, 2011). We will also consider that the third most massive MW satellite is Sagittarius (Sgr). For a band, the absolute magnitude of mag and a stellar mass-to-luminosity ratio of 2 for Sgr111We assume for Sgr a stellar population with average metallicity [Fe/H] dex (Chou et al., 2007; Cole et al., 2005) and average age of 8 Gyr (Bellazzini et al., 2006). imply a stellar mass of M⊙. Sgr is a tidally-stripped dwarf. Based on observations of its tidal tails, a total magnitude (core + tails) of mag is obtained (Niederste-Ostholt et al., 2010). Then, a rough estimate of the core + tails stellar mass of Sgr is M⊙. The fourth most massive MW satellite is Fornax (For), with a V-band absolute magnitude of mag. An estimate of its stellar mass is M⊙ (de Boer et al., 2012)
Our mock catalog was constructed based on observational constraints, so the different satellite population statistics should be consistent with those of real galaxies; we expect that this consistency is preserved for the extrapolations to lower masses using this catalog. In what follows, we compare the results from the mock catalog with observational distributions of MW-sized galaxies and their population of massive satellites. It is important to remark that we do not assume a particular halo mass for the studied MW-sized galaxies.
From a large SDSS sample, Liu et al. (2011) estimate the fraction of MW-sized isolated galaxies that do not have any () and that have or 6 MC-sized satellites. In the same way, we find in our mock catalog the different fractions of MW-sized galaxies with satellites in the stellar mass range . Figure 2 shows the predicted probabilities (long-dashed line). The probability of MW-sized galaxies having two MC-sized satellites is . If, from the subsample of MW-like galaxies having MC-sized satellites we exclude those with satellites larger than the LMC, then the probabilities decrease even further (solid line). For and no satellites larger than LMC, the probability is now only . Note that this implies that by far most of those MW-like systems that have should have at least one satellite more massive than the LMC; the MW system does not have such a satellite.
The results from Liu et al. (2011), for a search of MC-sized satellites (not excluding systems with satellites larger than the LMC) up to 150 kpc around the primary, are plotted as crosses in Fig. 2. Note that in our case satellites are counted inside the host virial radius ( kpc). Based on Fig. 8 in Liu et al. (2011), we also plot the probabilities when the search radius is increased up to 250 kpc (data are provided only for ). It should be said that the selection criteria and observational corrections for searching for MC-sized satellites are quite diverse. Liu et al. (2011, see also , ) explored the sensitivity of the probabilities to changes in various selection parameters and found that their results can slightly change, being the largest sensitivity that one to the satellite search radius around the primary.
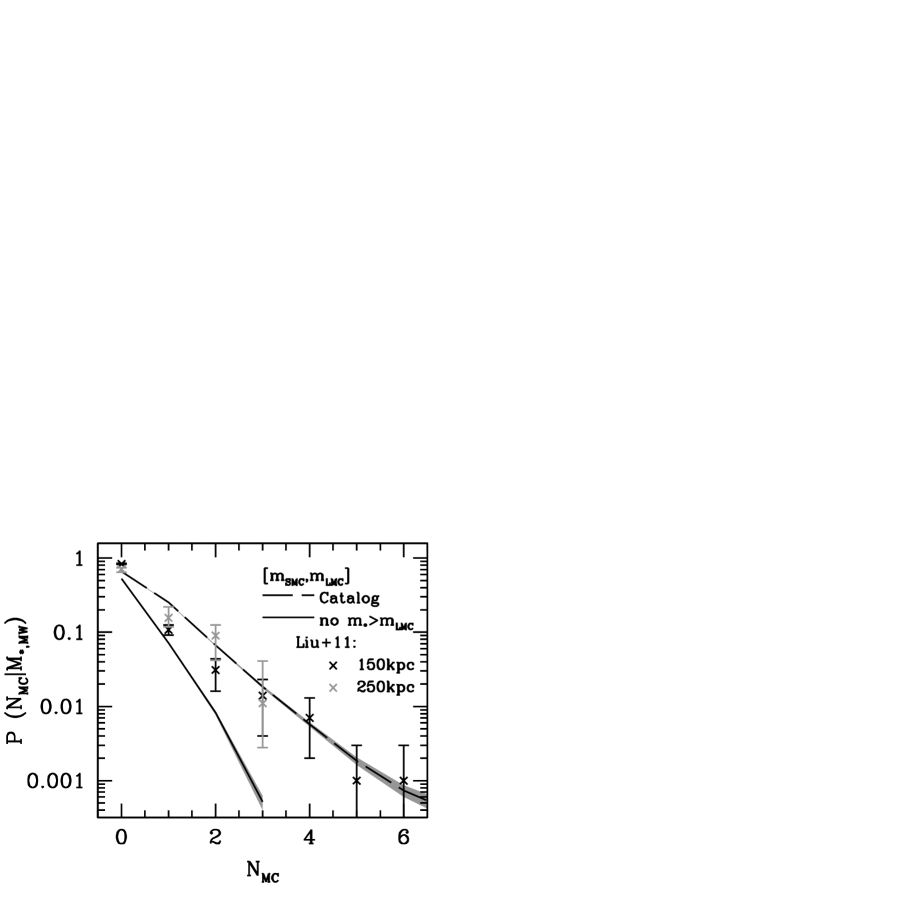
The agreement between the probabilities in our mock catalog and the Liu et al. (2011) observations is good within the uncertainties. It is encouraging that the mock catalog predicts the statistics of very rare events, as those systems with , in good agreement with observations. Regarding the more common events, in the catalog there is a chance of MW-sized galaxies without MC-sized satellites, while Liu et al. (2011) report 71% of such galaxies (for radii up to 250 kpc); this is because we also have slightly more galaxies with than in Liu et al. (2011) (the probabilities of systems with more MC-sized satellites are even lower and do not contribute significantly). These small differences can be explained due to the fact that the search radius for satellites in Liu et al. (2011) is up to 250 kpc, while in our case there is a fraction of MW-sized galaxies with massive halos, whose virial radii are larger than 250 kpc. If the satellite search radius would be increased in Liu et al. (2011), then the fraction of MW-sized galaxies without MC-sized satellites would decrease.
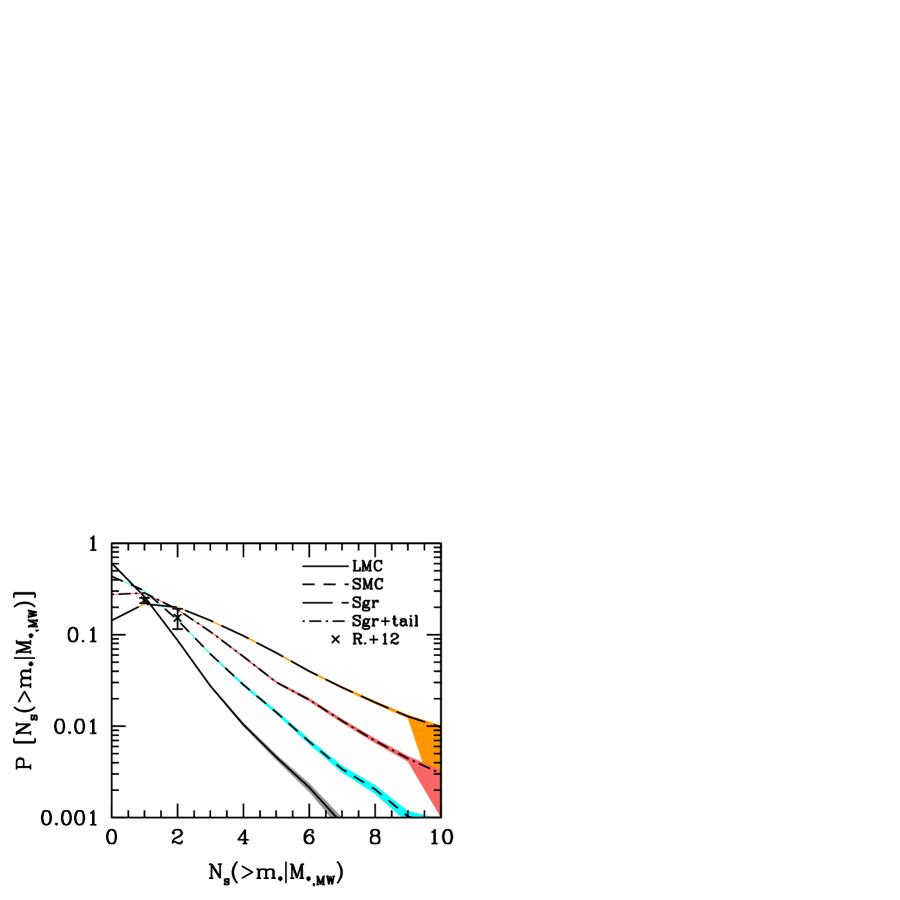
An alternative statistical study of MW analog systems was presented in Robotham et al. (2012). Based on a sample of MW-sized galaxies from the new GAMA survey (Driver et al., 2011), they have found the fractions of objects in this sample with one satellite at least as massive as the LMC or with two satellites at least as massive as the SMC. From our mock catalog we can calculate the fractions of MW-sized galaxies with any number of satellites equal or larger than a given stellar mass , . Figure 3 shows these probabilities for (solid line), (dashed line), and (long-dashed line; the dot-dashed line is for the case when the tails of Sgr are included in its mass). The colored contours around the lines are the corresponding Poissonian errors from counting. The probabilities of finding one satellite equal or more massive than the LMC and two satellites equal or more massive than the SMC are and , respectively. In the case of Robotham et al. (2012) these probabilities are 11.9% (11.2%–12.8%) and 3.4% (2.7% –4.5%). However, in Robotham et al. (2012) the satellite search radius was fixed to only 70 kpc. From Liu et al. (2011), we roughly estimate the factors by which these fractions could increase if the search radius were to be extended to to 250 kpc; the factors are at least 2 and 4.5 for and , respectively (they could be larger because Liu et al. (2011) limit the search to only satellites in the mass range). Taking these correction factors into account, the agreement between the predicted probabilities and those determined by Robotham et al. (2012) becomes quite good.
Recently, several authors have measured the complete (bright) satellite abundances around bright centrals, in particular those with luminosities close to the MW and M31, by using adequate samples from the SDSS (Lares, Lambas & Domínguez, 2011; Guo et al., 2011; Wang & White, 2012; Strigari & Wechsler, 2012; Sales et al., 2013) and from the Canada-France-Hawai Telescope Legacy Survey (Jiang, Jing & Li, 2012). In each one of these studies, different criteria for the sample selection, different searching and correction methodologies, various radii for the satellite search, etc. were applied. Therefore, the results are not easy to compare.
In general, these works find that the conditional bright satellite luminosity function of MW/M31-sized galaxies is described by a relatively steep power law, and a normalization such that down to magnitudes fainter than the central there is on average a factor of fewer satellites than the average of the MW and M31. The MW satellite CSMF measured in our mock catalog agrees in general with the above mentioned studies, but it seems to be slightly overabundant above the mass (or luminosity) corresponding to the SMC, in particular with respect to Wang & White (2012) and Strigari & Wechsler (2012). In the case of Jiang, Jing & Li (2012, and in a less extent for Guo et al. 2011), a slight flattening at the high-end of the luminosity function is seen, which is similar to our case. We recall that the direct observational searches of satellites are for a fixed radius around the central, which is 250 or 300 kpc typically (the exception is Jiang, Jing & Li, 2012 who use the virial radius determined by the Yang et al., 2007 group finding algorithm). In the mock catalog we count the satellites inside the virial radius, which for a non-negligible fraction of galaxies, is larger than 300 kpc. Therefore, it is expected that the number of satellites counted in the direct observational studies (in special of the most massive ones, which are more probable to be at larger radii) should be slightly lower than in our mock catalog.
We conclude that the population of the largest satellites around MW-sized central galaxies in our mock catalog agrees in general with several direct observational determinations, which present different and limited satellite population statistics. The advantage of our mock catalog, constrained by observations, is that allows one to calculate any satellite occupational statistics, and to extend the satellite mass limit to masses lower than current direct observational studies. In this way, one may explore in more detail how are the satellite populations of MW-sized galaxies and how particular is the MW system.
3.1. How common is the Milky-Way system?
According to Fig. 3, the MW is less common than similar sized galaxies in the sense that it has one satellite as massive as the LMC or two satellites equal or more massive than the SMC; there are more MW-sized galaxies that do not have satellites of mass (60.6% vs 26.1% for those with one satellite) or have less than two satellites more massive than (85.5% vs 14.5% for those with two satellites). However, the MW can be considered a common galaxy in the sense that it has three satellites more massive than . In general, what we learn from Fig. 3 is that the satellite number distributions are relatively wide and there is not a strongly preferred number of satellites above a given mass. For example, the probabilities of having 0, 1, 2, 3, or 4 satellites with are within a factor of less than two from each other.
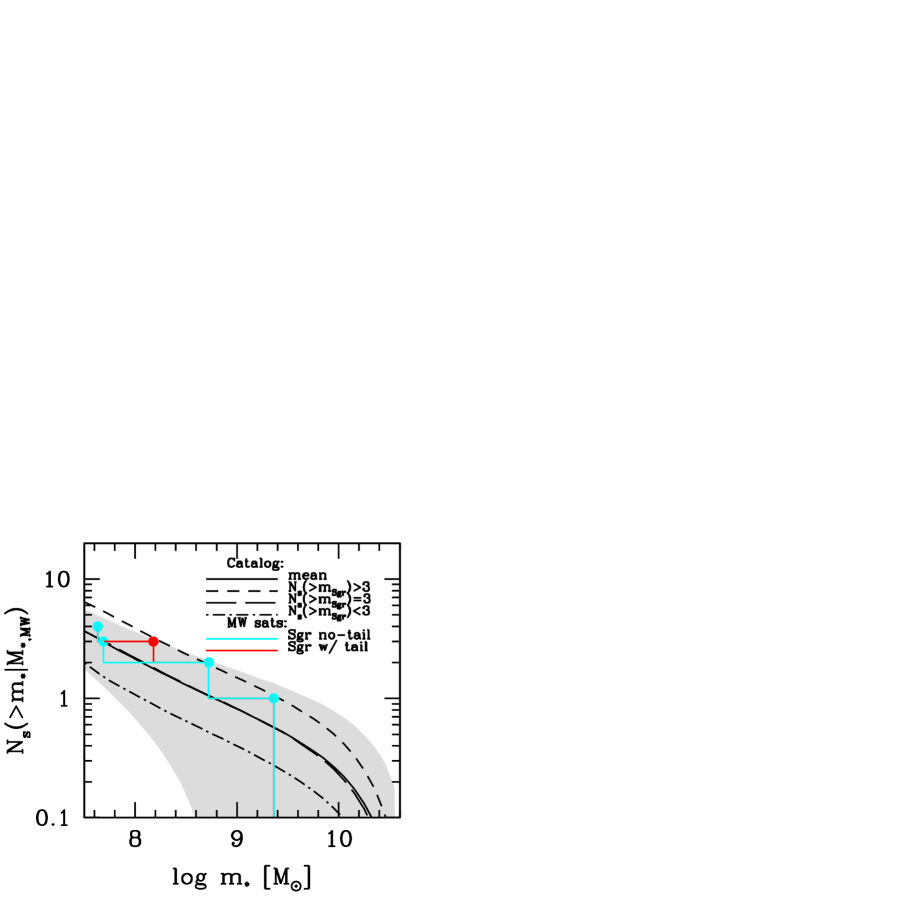
The fact that the satellite number distributions of MW-sized galaxies are broad can also be seen in the plot of the cumulative number of satellites above a given mass as a function of , , which is related to the satellite CSMF discussed above. Figure 4 shows the average (solid line) and the 1 scatter (gray shaded area) of from the mock catalog. The latter is quite broad. The cyan line corresponds to the MW (the red line is for the case the mass of Sgr includes the tidal tails). The MW massive satellite population is within of the number distribution of satellites as a function of mass of all MW-sized galaxies, being above the average by less than a factor of 2 at the MC satellite masses, and very close to the average regarding its three (four) satellites equal or more massive than Sgr (For). By means of direct observational determinations Guo et al. (2011), Strigari & Wechsler (2012), and Jiang, Jing & Li (2012) arrived to a similar conclusion. From a frequency point of view, we find that the MW-sized galaxies with one satellite (two satellites ), as the MW, happen only 1/0.6=1.68 (2/1.02 =1.92) times less frequently than the average (see also Fig. 3).
In fact, given that the (massive) satellite number distribution as a function of mass of MW-sized galaxies is relatively broad, several kind of “configurations” have close probabilities and all are relatively low. Besides, as more constraints are imposed on the configuration (as for example, to have two satellites in the SMC–LMC mass range but not larger than the LMC, see Fig. 2), the lower will be the frequency of occurrence. However, this does not imply that systems with a particular configuration are outliers.
In Fig. 4, we also show the mean satellite cumulative mass function of the subsamples of MW-sized galaxies constrained to have (short dashed line), (long dashed line), and (dot-dashed line) satellites more massive than Sgr. It is interesting to see that galaxies with exactly 3 satellites more massive than Sgr are close to the average for MW-sized centrals, but they have typically the most and second most massive satellites smaller than the LMC and SMC by roughly 0.7 and 0.8 dex, respectively. The subsample of galaxies with satellites more massive than Sgr describes better the satellite mass function of the MW down to the SMC or to Sgr when including its tails. Finally, we see that the MW definitively does not belong statistically to the subsample of MW-sized centrals with satellites more massive than Sgr, contrary to what is assumed in Wang et al. (2012).
The analysis presented above for the MW system can be applied also to M31. Recent observational results show that M31 has at least twice as many satellites as does the MW (Yniguez et al., 2013). Specifically, it has six satellites brighter than the luminosity of Sgr, making M31 an outlier according to Fig. 4. However, the stellar mass of M31 is a factor of larger than the MW (e.g., Tamm et al., 2012). Therefore, it is expected that the M31 halo is more massive than the MW one, hence the M31 halo should host more satellites. This question will be analyzed in detail elsewhere.
3.2. The halo masses of MW-like systems
The host halo mass distribution of the MW-sized galaxies in the mock catalog is plotted in Fig. 1. The distribution is broad, with mean and median values of and M⊙. It is known that for clusters and groups of galaxies the total dynamical mass of the system correlates with the richness (number of members above a given mass, see e.g., Reyes et al., 2008). Is this also the case for MW-like systems? Could we constrain statistically the MW halo mass by its number of satellites above a given mass or in between a given mass range?
In Fig. 5 we plot the mean host of the mock MW-systems with satellites with a mass larger or equal than the LMC (solid line), SMC (short-dashed line), and Sgr (long-dashed line), and with masses in between the SMC and LMC (dot-dashed blue line). The statistical scatter in all the cases is roughly dex in log. For clarity, we plot the scatter (vertical lines) only for the cases corresponding to the MW, i.e., for the solid line, for the short-dashed line, for the long-dashed line, and for the dot-dashed blue line (slightly shifted horizontally). Figure 5 shows that, in general, there is a correlation of with but it is weak. The scatter of around a given does not depend significantly on for galaxies below the knee in the – relation (see Fig. 1).
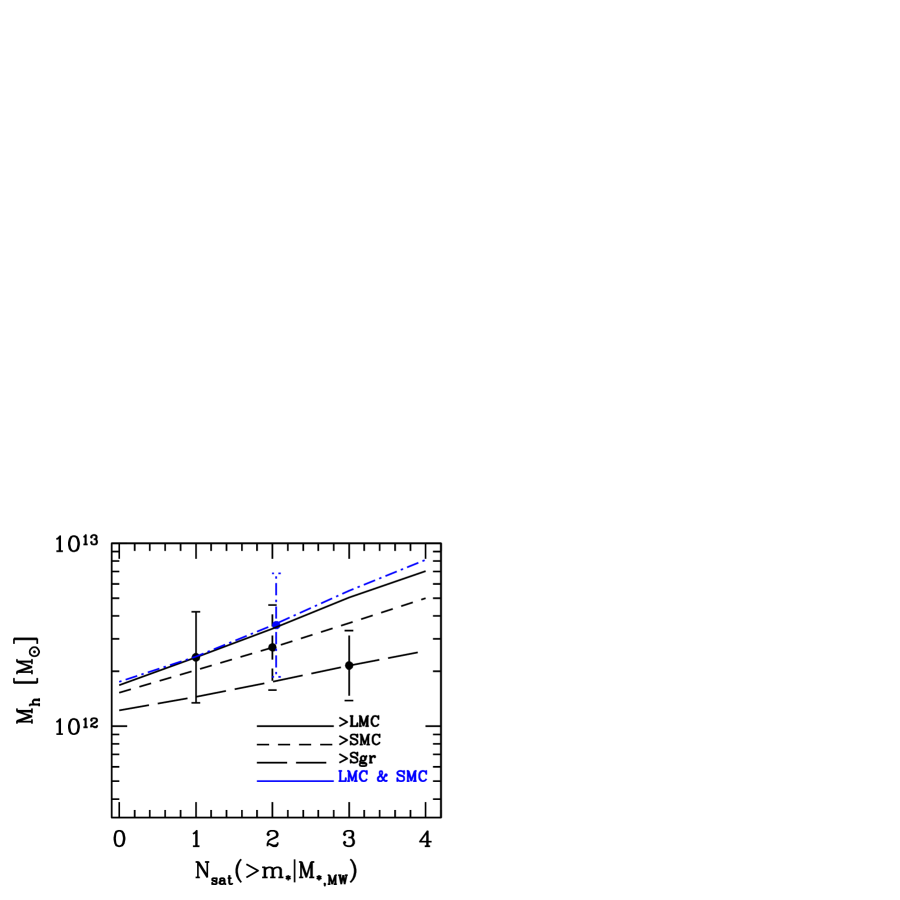
From Fig. 5 we can say that at the level, the halo mass of MW-like systems is not smaller than M⊙. This limit is for the case of 3 satellites with (the mean for this case is log(/M⊙)=12.33). Interestingly enough, most of the observational estimates of the MW halo mass give values above M⊙. For example, the most recent work, based on the proper motion of the Leo I dwarf galaxy in combination with numerical simulations, favors a value of (Boylan-Kolchin et al., 2012, and references therein). For restrictions related to the number of MC-sized satellites, the typical halo masses are slightly larger as seen in Fig. 5; for example, log(/M⊙) = 12.430 for the case of 2 satellites more massive than . This estimate is somewhat larger than the one obtained by Busha et al. (2011a), who used the Bolshoi N-body cosmological simulation (Klypin, Trujillo-Gomez & Primack, 2011) for looking for MW-sized halos with two subhalos with maximum circular velocity, , larger than 50 km/s (according to our – relation, this mass corresponds to a smaller than the one used here for the SMC, see Fig. 6 below; therefore, the host estimated in Busha et al. (2011a) would be larger, in better agreement with our study, if they had used the corresponding to ). The orbital information of the MC-sized subhalos in N-body simulations has been also used for improving the statistical determinations of the MW halo mass (Boylan-Kolchin, Besla & Hernquist, 2011; Busha et al., 2011a), finding that the typical masses should be above log(/M⊙) = 12.2-12.3.
4. Satellite vs CDM subhalo populations
The statistical method used to construct our mock catalog allows for a connection between satellite and subhalo masses to be made. This connection is constrained by the observed satellite GSMF and the projected correlation functions at different mass bins (see RAD13), and it can be extrapolated to stellar masses lower than the completeness limit of the observational samples. In papers such as Boylan-Kolchin et al. (2011b,2012) and Lovell et al. (2012), the satellite population of the MW is used to discuss the consistency of the predicted subhalo population in the CDM or WDM scenario, but an uncertainty remains about whether the MW and their satellites are a typical system and what the halo mass of the MW is (e.g., Purcell & Zentner, 2012; Wang et al., 2012). With our observationally-based catalog, we do not face such a problem since we account for a large population of MW-sized systems (centrals + satellites), with their corresponding host halo masses.
Our mock catalog offers a statistically complete sample of MW-sized galaxies with their satellite populations, for which we can ”measure” the subhalo masses associated to the satellites. By using the tight correlation between maximum circular velocity, , and mass of the subhalos measured in the Millenium-II Simulation (Boylan-Kolchin et al., 2010, taking into account the scatter around this correlation), the – relation and its scatter can be predicted. Note that implicity we are assuming that the subhalo is not altered by baryonic effects. Therefore, in our case, the question is not about a consistency between the number of CDM subhalos (above a given or ) and the number of satellites (above the corresponding to or ) –this consistency was stablished by construction in the method– but about whether the predicted – or – relations agree with direct observations.
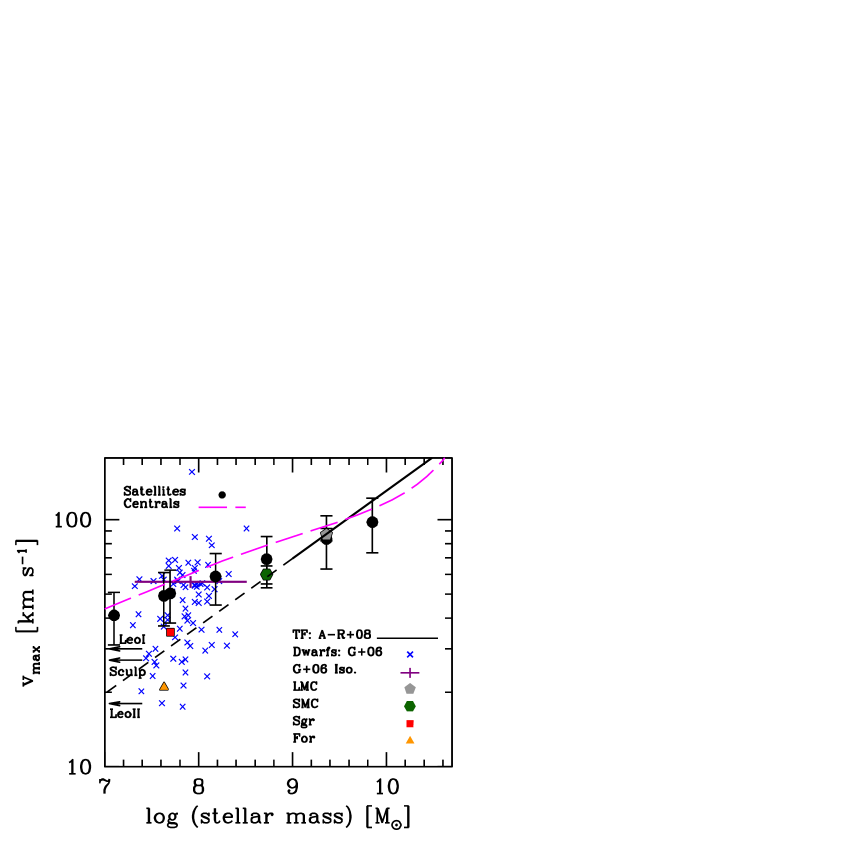
Figure 6 shows the mean and standard deviation of the vs. relation for all the satellites above M⊙ around MW-sized galaxies in our mock catalog. The scatter is due to the dispersions in host halo masses, in the – relation, and in the – relation. The dashed line is an extrapolation to lower masses of the stellar (inverse) Tully-Fisher (TF) relation of field disk galaxies as determined from a suitable catalog in Avila-Reese et al. (2008, the stellar mass was shifted by -0.1 dex to convert from the diet-Salpeter to the Chabrier initial mass function). The – relation of the satellites seems to bend towards the low-mass side of the TF relation of larger galaxies. In fact, a close trend is followed by central galaxies; the solid line in Fig. 6 shows the mean of the vs. relation for central galaxies in the mock catalog. Such a trend is in agreement with some direct observational studies of the TF relation of dwarf galaxies (c.f. McGaugh et al., 2000; De Rijcke et al., 2007; Amorín et al., 2009). The scatter of the – (as well as the –) relation increases the lower is the mass, also in agreement with direct observational studies. The bend of the stellar TF relation at velocities below km/s and the increase of its scatter is also observed in cosmological numerical simulations (de Rossi, Tissera & Pedrosa, 2010) and it is explained by the strong loss of baryons due to SN-driven feedback in low-amplitude gravitational potentials.
In Fig. 6 we also plot the individual measurements of the maximum rotation velocity and stellar mass for (central and satellite) dwarf galaxies by Geha et al. (2006, crosses)222Note that (i) in several cases the HI line widths used to estimate underestimates the real maximum velocity that could be at a radius larger than that where gas is observed; and (ii) the galaxy+subhalo after baryon matter is included in the numerical simulations may result significantly lower than in the pure dark matter subhalo (see for a discussion Section 5). . The scatter is high, and down to stellar masses M⊙ most of dwarfs are close to those from our catalog and above the extrapolated TF relation. There are some hints that those dwarfs in the high- side in the Geha et al. (2006) sample tend to be centrals. For example, Blanton, Geha & West (2008) select the subsample of very isolated dwarfs from Geha et al. (2006); these are certainly central galaxies. They report a median km/s for this subsample which spans almost all the mass range of the total sample. This value is also plotted in Fig. 6 (violet cross) and it agrees well with the velocities of our central galaxy sample.
For masses smaller than M⊙, there is a significant fraction of observed dwarfs with lower than the mock dwarfs, although the scatter is high. We also plot the values of and inferred observationally for the MW satellites LMC, SMC, Sgr, and For (color filled symbols; for the sources see the figure caption), as well as the inferred values of by Peñarrubia, McConnachie & Navarro (2008) for the next three smaller MW dwarfs, Leo I, Sculptor, and Leo II (indicated with arrows; their stellar masses are certainly smaller than M⊙). While the LMC and SMC fall close to the mock satellites, the observational inferences of for Sgr and For are smaller than the mean of the mock satellites; a similar difference is expected for the next smaller dwarfs, Leo I, Sculptor, and Leo II. Even the lower- scatter, given mainly by those systems in low-mass host halos, is higher than the For .
For a large sample of galaxies (and not only for the MW galaxy satellites), the results shown above confirm a potential problem for the small dwarf galaxies (stellar masses M⊙): they seem to be associated to significantly less concentrated (smaller ) systems than those the CDM scenario predicts (Boylan-Kolchin et al. 2011b,2012). However, the question that remains open is whether this problem refers to both central and satellites galaxies or only to the latter. According to the above, it could be that those dwarfs in the Geha et al. (2006) sample that are in the low- side are satellites, while those in the high- side are centrals, and as can be appreciated in Fig. 6, they are consistent with the mock central dwarfs.
5. Summary & Discussion
By means of a statistical approach that observationally constrains the galaxy-(sub)halo connection for central and satellite galaxies, we generate a realization of central galaxies and their populations of satellites. Each galaxy is characterized by its stellar and (sub)halo mass and, by construction, the catalog reproduces (i) the observed central/satellite GSMFs and projected two-point correlation functions in several stellar mass bins down to their completeness limits ( M⊙, though we extrapolate it down to M⊙); (ii) the CDM distinct halo mass function (Tinker et al., 2008) as well as the conditional subhalo mass functions (Boylan-Kolchin et al., 2010). From this catalog we picked all the central galaxies with MW stellar mass, dex (40694 objects), and studied the (massive) satellite occupational distributions of these galaxies. The main results from the “observation” of the MW-like systems in the mock catalog are:
-
•
The fractions (probabilities) of MW centrals with satellites within the MCs stellar mass range or above the SMC or LMC masses are in general agreement with direct observational studies (Liu et al., 2011; Busha et al., 2011b; Robotham et al., 2012) after correcting for the satellite search radius, which in our case is the virial radius of the host halo (see Figs. 2 and 3). For example, we obtain that the probability of finding 2 satellites in the MC mass range is (or if we add the condition of having no satellites more massive than the LMC); the probabilities of having 1 satellite with , 2 satellites with or 3 with are , , and , respectively. We also find that the average (massive) satellite mass function of the mock MW-sized galaxies is consistent with recent direct observational determinations of the (bright) conditional satellite luminosity function.
-
•
Having the two most massive satellites be as massive as the MCs makes the MW less common, but it is not a rare case in the sense of an outlier. In our catalog, MW-sized galaxies with one satellite (two satellites ), as the MW, happen only 1/0.6=1.68 (2/1.02 =1.92) times less frequently than the average. The cumulative satellite mass function of the MW down to the mass of For is within the distribution of all the MW-sized galaxies, lying above the average by less than a factor of two at the MCs masses and close to the average at the For and Sgr masses (Fig. 4). MW-sized centrals with exactly 3 satellites more massive than Sgr are among the most common ones, but they have typically the most and second most massive satellites smaller than the LMC and SMC by roughly 0.7 and 0.8 dex, respectively. In general, we find that the satellite number distributions of MW-sized galaxies are relatively broad.
-
•
As opposed to clusters and groups of galaxies, the halo mass of MW-sized galaxies correlates weakly with the number of satellites above a given mass (Fig. 5). The mean log and its standard deviation for galaxies with 3 satellites equal or more massive than Sgr is . For 2 satellites with or in the SMC-LMC mass range, the mean and standard deviation are log and log, respectively. Therefore, it is not possible to constrain the halo mass of MW-sized galaxies with appreciable accuracy with the satellite population abundance of the MW, but one can say that, at the level, this mass is not smaller than M⊙, consistent with recent claims based on the combination of high numerical simulations with the proper motion of Leo I (Boylan-Kolchin et al., 2012).
-
•
In our catalog of MW-sized galaxies, the number of CDM subhalos (above a given or ) is consistent with the number of satellites (above the corresponding to or ) by construction and, being the satellite abundances of the mock galaxies in agreement with different direct observational studies, one may conclude that there is not a (massive) satellite missing problem for the CDM model. However, we find an internal dynamics problem: the of the subhalos of satellites smaller than M⊙ seems to be systematically larger than the inferred from current observational studies of dwarf satellites, by factors at the masses of Sgr and For (Fig. 6). There are some hints that this issue could refer only to the observed satellite dwarfs but not to the central ones.
We conclude that the general agreement of our satellite abundance statistics with direct observations signals towards a self-consistency in the construction of the mock catalog, and it shows that the underlaying CDM (sub)halo abundances and internal dynamics are consistent with observations down to the scales of the MC galaxies. For smaller masses, our results point out to a possible issue in the internal dynamics of the CDM (sub)halos as compared with the observed satellite dwarfs. These results confirm the conclusions by Boylan-Kolchin et al. (2011b,2012) for satellite spheroidal dwarfs but with the difference that in our case the results refer to the overall population of MW-sized galaxies. Therefore, our conclusions are free of uncertainties intrinsic to the analysis in Boylan-Kolchin et al. (2011b,2012) about whether the MW system is atypical or not and about what is the MW halo mass to be used (e.g., Purcell & Zentner, 2012; Wang et al., 2012). However, before arriving to any conclusion, several aspects of these results should be carefully discussed (see for an extensive discussion Boylan-Kolchin et al. 2012). Here we highlight two observational caveats.
(i) Our prediction refers to the maximum circular velocity of the pristine subhalo, . Observations refer to the maximum or last-point measured galaxy rotation velocity, , or to a model-dependent constrained by measurements of the stellar velocity dispersion under several assumptions. Because dwarf galaxies are dark matter dominated, in the context of the CDM model it is expected that is attained at a radius much larger than the optical one, where the observational tracers are not available. Then, it could be that the current observational inferences are underestimating the actual values of . Regarding the dispersion-supported dwarf spheroidals, their unknown stellar velocity anisotropy and/or halo shape make ambiguous the inference of their mass distributions (e.g., Strigari et al., 2007; Hayashi & Chiba, 2012; Wolf & Bullock, 2012, and more references therein).
(ii) The mock catalog was constructed using both the – and the – relations constrained with the Yang, Mo & van den Bosch (2009) central and satellite GSMFs down to , as well as with observed projected correlation functions reported in Yang et al. (2012). For smaller masses, we use just an extrapolation of this relation and its scatter. If the satellite GSMF at smaller masses would be steeper than the Yang, Mo & van den Bosch (2009) faint-end or the scatter larger than the assigned by us (due, for example, to highly stochastic star formation and tidal effects in the satellite dwarfs), then the relation would be shallower and more scattered, which implies lower subhalo masses (or ) on average at a given and higher scatter in these quantities. In Rodríguez-Puebla, Drory & Avila-Reese (2012), by using a low-mass slope of for the satellite GSMF, we obtained subhalo masses for M⊙ dwarfs as small as the tidal masses (close to the subhalo masses) inferred for some MW satellites of these masses. This slope is given by Baldry, Glazebrook & Driver (2008) for the GSMF, which goes down to M⊙ after applying a correction for surface brightness incompleteness. However, the GSMF in this case refers to all galaxies. In RAD13 we decomposed the Baldry, Glazebrook & Driver (2008) GSMF into centrals and satellites, resulting then in a – relation that implies subhalo masses larger than the tidal masses by roughly 0.3-0.4 dex. Future samples, complete down to the smallest masses and decomposed into central and satellite galaxies, should tell us whether the satellite GSMF towards very small masses is steep enough or not as to imply subhalo masses (or ) in better agreement with current dynamical studies.
Finally, if the observations regarding the faint-end of the satellite GSMF and the internal dynamics of the dwarf satellites remain roughly as those discussed here, then our results could be an indication that the baryonic physics significantly affects the inner structure of the very small subhalos that host dwarf satellites. A possible physical mechanism for explaining the decrease of the inner concentration, and therefore of , in low-mass CDM (sub)halos could be the feedback-driven gas outflows. By means of N-body/Hydrodynamics cosmological simulations, some authors have shown that repeating strong outflows during the halo/galaxy growth are able to drag with them the inner dark matter producing a decreasing of the inner gravitational potential (Mashchenko, Wadsley & Couchman, 2008; Macciò et al., 2012; Governato et al., 2012; Zolotov et al., 2012; Ogiya & Mori, 2012), though it seems difficult that such an effect would be able to lower to the required values (Boylan-Kolchin, Bullock & Kaplinghat, 2012; di Cintio et al., 2011). However, some numerical simulations show that in the case of satellites, the combination of this effect with the stronger tidal effects of the halo when a central baryonic galaxy is included, as well as the lowered baryon fractions of the dwarf satellites, work in the direction of reducing the circular velocities of the simulated MW satellite dwarf spheroidals to the levels required by the results of Boylan-Kolchin, Bullock & Kaplinghat (2012) or our ones (Brooks & Zolotov, 2012; Arraki et al., 2012; Gritschneder & Lin, 2013).
We have found some hints that the apparent problem of too low-circular velocities of dwarfs smaller than M⊙ refers mostly to satellite galaxies but not to central ones. If this is the case, then such a problem is explained by the plausible physical mechanisms mentioned above. However, if the problem remains for isolated dwarfs, then this could be signaling to the necessity of a modification in the cosmological scenario, for example, by introducing warm or self-interacting dark matter (Lovell et al., 2012; Vogelsberger, Zavala & Loeb, 2012).
References
- Amorín et al. (2009) Amorín R., Alfonso J., Aguerri J. A. L., Muñoz-Tuñón C., Cairós L. M., 2009, A&A, 501, 75
- Arraki et al. (2012) Arraki K. S., Klypin A., More S., Trujillo-Gomez S., 2012, ArXiv e-prints
- Avila-Reese et al. (2008) Avila-Reese V., Zavala J., Firmani C., Hernández-Toledo H. M., 2008, AJ, 136, 1340
- Baldry, Glazebrook & Driver (2008) Baldry I. K., Glazebrook K., Driver S. P., 2008, MNRAS, 388, 945
- Behroozi, Wechsler & Conroy (2012) Behroozi P. S., Wechsler R. H., Conroy C., 2012, ArXiv e-prints
- Bellazzini et al. (2006) Bellazzini M., Correnti M., Ferraro F. R., Monaco L., Montegriffo P., 2006, A&A, 446, L1
- Blanton, Geha & West (2008) Blanton M. R., Geha M., West A. A., 2008, ApJ, 682, 861
- Boylan-Kolchin, Besla & Hernquist (2011) Boylan-Kolchin M., Besla G., Hernquist L., 2011, MNRAS, 414, 1560
- Boylan-Kolchin, Bullock & Kaplinghat (2011) Boylan-Kolchin M., Bullock J. S., Kaplinghat M., 2011, MNRAS, 415, L40
- Boylan-Kolchin, Bullock & Kaplinghat (2012) Boylan-Kolchin M., Bullock J. S., Kaplinghat M., 2012, MNRAS, 422, 1203
- Boylan-Kolchin et al. (2012) Boylan-Kolchin M., Bullock J. S., Sohn S. T., Besla G., van der Marel R. P., 2012, ArXiv e-prints
- Boylan-Kolchin et al. (2010) Boylan-Kolchin M., Springel V., White S. D. M., Jenkins A., 2010, MNRAS, 406, 896
- Brooks & Zolotov (2012) Brooks A. M., Zolotov A., 2012, ArXiv e-prints
- Busha et al. (2011a) Busha M. T., Marshall P. J., Wechsler R. H., Klypin A., Primack J., 2011a, ApJ, 743, 40
- Busha et al. (2011b) Busha M. T., Wechsler R. H., Behroozi P. S., Gerke B. F., Klypin A. A., Primack J. R., 2011b, ApJ, 743, 117
- Chou et al. (2007) Chou M.-Y. et al., 2007, ApJ, 670, 346
- Cole et al. (2005) Cole A. A., Tolstoy E., Gallagher, III J. S., Smecker-Hane T. A., 2005, AJ, 129, 1465
- de Boer et al. (2012) de Boer T. J. L. et al., 2012, A&A, 544, A73
- De Rijcke et al. (2007) De Rijcke S., Zeilinger W. W., Hau G. K. T., Prugniel P., Dejonghe H., 2007, ApJ, 659, 1172
- de Rossi, Tissera & Pedrosa (2010) de Rossi M. E., Tissera P. B., Pedrosa S. E., 2010, A&A, 519, A89
- di Cintio et al. (2011) di Cintio A., Knebe A., Libeskind N. I., Yepes G., Gottlöber S., Hoffman Y., 2011, MNRAS, 417, L74
- Driver et al. (2011) Driver S. P. et al., 2011, MNRAS, 413, 971
- Flynn et al. (2006) Flynn C., Holmberg J., Portinari L., Fuchs B., Jahreiß H., 2006, MNRAS, 372, 1149
- Gao et al. (2011) Gao L., Frenk C. S., Boylan-Kolchin M., Jenkins A., Springel V., White S. D. M., 2011, MNRAS, 410, 2309
- Geha et al. (2006) Geha M., Blanton M. R., Masjedi M., West A. A., 2006, ApJ, 653, 240
- Giocoli, Tormen & van den Bosch (2008) Giocoli C., Tormen G., van den Bosch F. C., 2008, MNRAS, 386, 2135
- Governato et al. (2012) Governato F. et al., 2012, MNRAS, 422, 1231
- Gritschneder & Lin (2013) Gritschneder M., Lin D. N. C., 2013, ApJ, 765, 38
- Guo et al. (2011) Guo Q., Cole S., Eke V., Frenk C., 2011, MNRAS, 417, 370
- Hayashi & Chiba (2012) Hayashi K., Chiba M., 2012, The Astrophysical Journal, 755, 145
- James & Ivory (2011) James P. A., Ivory C. F., 2011, MNRAS, 411, 495
- Jiang, Jing & Li (2012) Jiang C. Y., Jing Y. P., Li C., 2012, ApJ, 760, 16
- Klypin, Trujillo-Gomez & Primack (2011) Klypin A. A., Trujillo-Gomez S., Primack J., 2011, ApJ, 740, 102
- Kravtsov et al. (2004) Kravtsov A. V., Berlind A. A., Wechsler R. H., Klypin A. A., Gottlöber S., Allgood B., Primack J. R., 2004, ApJ, 609, 35
- Lares, Lambas & Domínguez (2011) Lares M., Lambas D. G., Domínguez M. J., 2011, AJ, 142, 13
- Liu et al. (2011) Liu L., Gerke B. F., Wechsler R. H., Behroozi P. S., Busha M. T., 2011, ApJ, 733, 62
- Lovell et al. (2012) Lovell M. R. et al., 2012, MNRAS, 420, 2318
- Macciò et al. (2012) Macciò A. V., Stinson G., Brook C. B., Wadsley J., Couchman H. M. P., Shen S., Gibson B. K., Quinn T., 2012, ApJ, 744, L9
- Mashchenko, Wadsley & Couchman (2008) Mashchenko S., Wadsley J., Couchman H. M. P., 2008, Science, 319, 174
- McGaugh et al. (2000) McGaugh S. S., Schombert J. M., Bothun G. D., de Blok W. J. G., 2000, ApJ, 533, L99
- Niederste-Ostholt et al. (2010) Niederste-Ostholt M., Belokurov V., Evans N. W., Peñarrubia J., 2010, ApJ, 712, 516
- Ogiya & Mori (2012) Ogiya G., Mori M., 2012, ArXiv e-prints
- Olsen et al. (2011) Olsen K. A. G., Zaritsky D., Blum R. D., Boyer M. L., Gordon K. D., 2011, ApJ, 737, 29
- Peñarrubia, McConnachie & Navarro (2008) Peñarrubia J., McConnachie A. W., Navarro J. F., 2008, ApJ, 672, 904
- Purcell & Zentner (2012) Purcell C. W., Zentner A. R., 2012, JCAP, 12, 7
- Reyes et al. (2008) Reyes R., Mandelbaum R., Hirata C., Bahcall N., Seljak U., 2008, MNRAS, 390, 1157
- Robotham et al. (2012) Robotham A. S. G. et al., 2012, MNRAS, 424, 1448
- Rodríguez-Puebla, Avila-Reese & Drory (2013) Rodríguez-Puebla A., Avila-Reese V., Drory N., 2013, ApJ, 767, 92
- Rodríguez-Puebla, Drory & Avila-Reese (2012) Rodríguez-Puebla A., Drory N., Avila-Reese V., 2012, ApJ, 756, 2
- Sales et al. (2013) Sales L. V., Wang W., White S. D. M., Navarro J. F., 2013, MNRAS, 428, 573
- Springel et al. (2008) Springel V. et al., 2008, MNRAS, 391, 1685
- Stanimirović, Staveley-Smith & Jones (2004) Stanimirović S., Staveley-Smith L., Jones P. A., 2004, ApJ, 604, 176
- Strigari et al. (2007) Strigari L. E., Bullock J. S., Kaplinghat M., Diemand J., Kuhlen M., Madau P., 2007, ApJ, 669, 676
- Strigari, Frenk & White (2010) Strigari L. E., Frenk C. S., White S. D. M., 2010, MNRAS, 408, 2364
- Strigari & Wechsler (2012) Strigari L. E., Wechsler R. H., 2012, ApJ, 749, 75
- Tamm et al. (2012) Tamm A., Tempel E., Tenjes P., Tihhonova O., Tuvikene T., 2012, A&A, 546, A4
- Tinker et al. (2008) Tinker J., Kravtsov A. V., Klypin A., Abazajian K., Warren M., Yepes G., Gottlöber S., Holz D. E., 2008, ApJ, 688, 709
- Tollerud et al. (2011) Tollerud E. J., Boylan-Kolchin M., Barton E. J., Bullock J. S., Trinh C. Q., 2011, ApJ, 738, 102
- Vogelsberger, Zavala & Loeb (2012) Vogelsberger M., Zavala J., Loeb A., 2012, MNRAS, 423, 3740
- Wang et al. (2012) Wang J., Frenk C. S., Navarro J. F., Gao L., Sawala T., 2012, MNRAS, 424, 2715
- Wang & White (2012) Wang W., White S. D. M., 2012, MNRAS, 424, 2574
- Wolf & Bullock (2012) Wolf J., Bullock J. S., 2012, ArXiv e-prints
- Yang, Mo & van den Bosch (2009) Yang X., Mo H. J., van den Bosch F. C., 2009, ApJ, 695, 900
- Yang et al. (2007) Yang X., Mo H. J., van den Bosch F. C., Pasquali A., Li C., Barden M., 2007, ApJ, 671, 153
- Yang et al. (2012) Yang X., Mo H. J., van den Bosch F. C., Zhang Y., Han J., 2012, ApJ, 752, 41
- Yniguez et al. (2013) Yniguez B., Garrison-Kimmel S., Boylan-Kolchin M., Bullock J. S., 2013, ArXiv e-prints
- Zavala, Vogelsberger & Walker (2013) Zavala J., Vogelsberger M., Walker M. G., 2013, MNRAS, 431, L20
- Zolotov et al. (2012) Zolotov A. et al., 2012, ApJ, 761, 71