The cosmic anomaly
Abstract
Via a Bayesian likelihood analysis using 219 recent cosmic ray spectral data points we extract the anomalous part of the cosmic flux. First we show that a significant tension exists between the related and the rest of the fluxes. Interpreting this tension as the presence of an anomalous component in the related data, we then infer the values of selected cosmic ray propagation parameters excluding the anomalous data sample from the analysis. Based on these values we calculate background predictions with theoretical uncertainties for PAMELA and Fermi-LAT. We find a statistically significant deviation between the Fermi-LAT data and the predicted background even when (systematic) uncertainties are taken into account. Identifying this deviation as an anomalous contribution, we make an attempt to distinguish between various sources that may be responsible for the anomalous flux.
1 Introduction
Cosmic ray observations provided significant and puzzling deviations from theoretical predictions over the last decades. Experiments such as TS [1], AMS [2], CAPRICE [3], MASS [4], and HEAT [5, 6] established a hint of an excess of high energy electrons and/or positrons. Measurements of the PAMELA satellite confirmed these results by finding an excess over the theoretical predictions in the flux for GeV [7]. The PAMELA data seem to deviate from the theoretical predictions even when experimental and theoretical uncertainties are taken into account [8]. An excess in the flux was also found by AMS [9], PPB-BETS [10], and HESS [11, 12]. Recently the Fermi-LAT satellite confirmed the excess above 100 GeV [13]. The deviation between the Fermi-LAT data and the theoretical prediction is significant. This deviation was recently confirmed by the PAMELA collaboration which found the flux to be consistent with the Fermi-LAT data.
Many attempts were to explain the deviation between the data and theory. New physics was invoked ranging from modification of the cosmic ray propagation, through supernova remnants, to dark matter annihilation. Ref. [14] summarizes these speculations. Whether the anomaly exists depends on the theoretical prediction of the cosmic ray background. The theoretical prediction is challenging because of the lack of precise knowledge of the cosmic ray sources, and because the cosmic ray propagation model has numerous free parameters, such as convection velocities, spatial diffusion coefficients and momentum loss rates.
Motivated by traces of possible new physics in the Fermi-LAT data, we attempt to determine the size of the anomalous contribution in the cosmic flux. Our method involves the following steps. First we find the cosmic ray propagation parameters that influence the flux measured by Fermi-LAT and PAMELA the most. Then we subject the cosmic ray data, other than the Fermi-LAT and PAMELA measurements to a Bayesian likelihood analysis, to determine the preferred values and the 68 % (1-) credibility regions of the relevant propagation parameters. Based on the central values and 1- credibility regions of these propagation parameters we then predict the background flux, with uncertainties, for Fermi-LAT and PAMELA. Finally, we extract the anomalous part of the spectrum by subtracting the background prediction from the Fermi-LAT and PAMELA measurement.
2 Theory of cosmic ray propagation
Cosmic ray propagation is described by the diffusion model [15]. This model assumes homogeneous propagation of charged particles within the Galactic disk and it also takes into account cooling effects. The phase-space density of a particular cosmic ray species at a Galactic radius of can be calculated solving the transport equation which has the general form [16]
| (1) | |||||
Here is the source term of primary and secondary cosmic ray contributions. The spatial diffusion coefficient has the form
| (2) |
where , and is the magnetic rigidity of the particles which describes a particle’s resistance to deflection by a magnetic field. Here is the effective nuclear charge of the particle, is its velocity, is its momentum, is its charge, and is the speed of light. The exponent indicates the power law dependence of the spatial diffusion coefficient .
Diffusion in momentum space (diffusive re-acceleration) is described by the coefficient
| (3) |
Here is the Alfven speed, the parameter characterises the level of hydromagnetic turbulence experienced by the cosmic rays in the interstellar medium [17]. In Eq.(1), is the convection velocity and the parameter is the time-scale of the fragmentation loss, and is the radioactive decay time-scale.
The GalProp numerical package solves the propagation equation numerically for nuclei, as well as for electrons and positrons on a two dimensional spatial grid with cylindrical symmetry in the Galaxy [16]. The input parameter file for GalProp has a number of free parameters which are available for the author to define. These can be classified into a number of subsets: the diffusion of cosmic ray, the primary cosmic ray sources and radiative energy losses of these primary cosmic rays. The diffusion subset is described by the parameters defined above:
| (4) |
The most relevant parameters in the primary cosmic ray source subset are:
| (5) |
Here and are primary source electron injection indices. They specifying the steepness of the electron injection spectrum, , below and above of a reference rigidity . There are separate injection indices for nuclei defined by and below and above . For further details we refer the reader to [16].
3 Parameter space and uncertainties
To reduce the dimension of the parameter space we tested the robustness of the flux against the variation of nearly all individual parameters and found that it is mostly sensitive to the following propagation parameters:
| (6) |
Here and are the primary electron and nucleus injection indices, and are spatial diffusion coefficients below and above a reference rigidity , and determines the normalization of the spatial diffusion coefficient.
Our calculations confirmed the findings of a recent study by [18] that the flux is sensitive to the change of the Galactic plane height . Indeed [17] have shown that there is a connection between and :
| (7) |
Thus, varying the cylinder height amounts to the redefinition of as also noticed by Ref. [19]. In the light of this, we fix to 4 kpc and use as free parameter.
We treat the normalizations of the , , /p, B/C, (SC+Ti+V)/Fe and Be-10/Be-9 fluxes as theoretical nuisances parameters.
| (8) |
When evaluating the uncertainties, following [20], we ignore theoretical uncertainties and combine statistical and systematic experimental uncertainties in quadrature
| (9) |
This can be done for Fermi-LAT and the latest PAMELA flux. Unfortunately, systematic uncertainties are not available for the rest of the cosmic ray measurements. When this is the case, as an estimate of the systematics, we define as the rescaled statistical uncertainty
| (10) |
For simplicity, in this study, we use the same scale factor for all data points where systematic uncertainty is not available. To remain mostly consistent with the work of [20], we set this common scale factor to a conservative value that they use: . We checked that our conclusions only mildly depend on this choice. Further details about our Bayesian parameter inference can be found in [21].
4 Experimental data
We included 219 of the most recent experimental data points in our statistical analysis. These contained 114 related, and 105 , B/C, (Sc+Ti+V)/Fe and Be-10/Be-9 cosmic ray flux measurements. These data are summarized in Table 1.
| Measured flux | Experiment | Energy | Data |
| (GeV) | points | ||
| AMS [9] | 0.60 - 0.91 | 3 | |
| Fermi-LAT [13] | 7.05 - 886 | 47 | |
| HESS [11, 12] | 918 - 3480 | 9 | |
| PAMELA [22] | 1.65 - 82.40 | 16 | |
| PAMELA [23] | 1.11 - 491.4 | 39 | |
| /p | PAMELA [24] | 0.28 - 129 | 23 |
| IMP8 [25] | 0.03 - 0.11 | 7 | |
| ISEE3 [26] | 0.12 - 0.18 | 6 | |
| B/C | Lezniak et al. [27] | 0.30 - 0.50 | 2 |
| HEAO3 [28] | 0.62 - 0.99 | 3 | |
| PAMELA [29] | 1.24 - 72.36 | 8 | |
| CREAM [30] | 91 - 1433 | 3 | |
| (Sc+Ti+V)/Fe | ACE [31] | 0.14 - 35 | 20 |
| SANRIKU [32] | 46 - 460 | 6 | |
| Wiedenbeck et al. [33] | 0.003 - 0.029 | 3 | |
| Garcia-Munoz et al. [34] | 0.034 - 0.034 | 1 | |
| Wiedenbeck et al. [33] | 0.06 - 0.06 | 1 | |
| Be-10/Be-9 | ISOMAX98 [35] | 0.08 - 0.08 | 1 |
| ACE-CRIS [36] | 0.11 - 0.11 | 1 | |
| ACE [37] | 0.13 - 0.13 | 1 | |
| AMS-02 [38] | 0.15 - 9.03 | 15 |
5 Is there a cosmic ray anomaly?
In this section we investigate whether the present cosmic ray data justify the existence of an anomaly in the spectrum. To this end we divide the cosmic ray data into two groups: 114 measurements containing observations of fluxes (AMS, Fermi, HESS, and PAMELA) and the rest of 105 data points (, B/C, (Sc+Ti+V)/Fe, Be-10/Be-9). We perform a Bayesian analysis independently on these two sets of data extracting the preferred values of the propagation parameters.
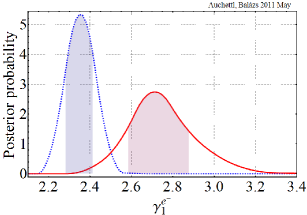
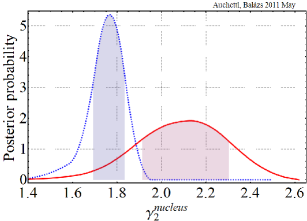
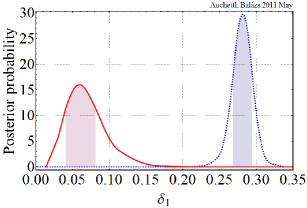
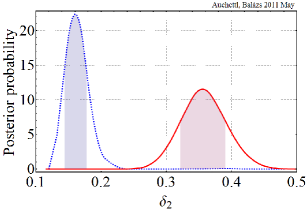
Fig. 1 clearly shows that the two subsets of cosmic ray data are inconsistent with the hypothesis that the cosmic ray propagation model and/or sources implemented in GalProp provides a good theoretical description. Our interpretation of the tension between the fluxes and the rest of the cosmic ray data is that the measurements of PAMELA and Fermi-LAT are affected by new physics which is unaccounted for by the propagation model and/or cosmic ray sources included in our calculation.
6 The size of the anomaly
We use the central values and credibility regions of the parameters determined using the non- related data to calculate a background prediction for the fluxes. Fig. 2 shows the the measured fluxes and the calculated background. Statistical and systematic uncertainties combined in quadrature are shown for Fermi-LAT, while () scaled statistical uncertainties are shown for PAMELA as gray bands. Our background prediction is overlaid as magenta bands. The central value and the 1- uncertainty of the calculated anomaly is displayed as green dashed lines and bands. As the first frame shows the Fermi-LAT measurements deviate from the predicted background both below 10 GeV and above 100 GeV.
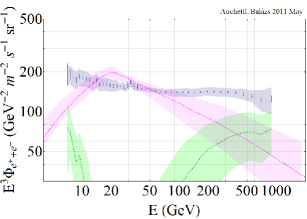
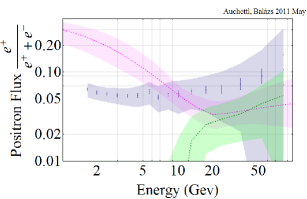
In our interpretation the deviation is a statistically significant signal of the presence of new physics in the flux. Based on the difference between the central values of the data and the background a similar conclusion can be drawn from PAMELA. Unfortunately, the sizable uncertainties for the PAMELA measurements prevent us to claim a statistically significant deviation. After having determined the background for the fluxes, we subtract it from the measured flux to obtain the size of the new physics signal. Results for the anomaly are also shown in Fig. 2. As expected based on the background predictions a non-vanishing anomaly can be established for the Fermi-LAT flux, while no anomaly with statistical significance can be claimed for PAMELA due to the large uncertainties.
7 The source of the anomaly
Based on the available evidence we can only speculate about the origin of the discrepancy between the data and predictions of the cosmic electron-positron spectra. The first obvious assumption is that some aspect of the propagation model used in the present calculation is insufficient for the proper description of the electron-positron fluxes arriving at Earth [39]. In this case there exists no anomaly in the data. Assuming that the propagation model satisfactorily describes physics over the Galaxy the next reasonable thing is to suspect local effects modifying the electron-positron distribution [40]. Further suspicion falls on the lack of sources included in the calculation [41].
Possible new sources of cosmic rays to account for the anomaly have been proposed in two major categories. The first category is standard astrophysical objects such as supernova remnants, pulsars, various objects in the Galactic centre, etc. Finally, more exotic explanations call for new astronomical and/or particle physics phenomena, such as dark matter. In Ref. [21] we compared our extracted signal to recent predictions of anomalous sources. We considered predictions from supernova remnants, nearby pulsars and dark matter annihilation. We concluded that presently uncertainties are too large and prevent us from judging the validity of these as explanations of the anomaly. With more data and more precise calculations the various suggestions of the cosmic anomaly can be ruled out or confirmed.
Acknowledgements
We are indebted to R. Cotta, A. Donea, J. Lazendic-Galloway, Y. Levin and T. Porter for invaluable discussions on various aspects of cosmic ray physics and likelihood analysis. CB wishes to thank the organizers and participants of the Bled Workshop for stimulating discussions. KA is thankful to P. Chan for help with issues of parallel computing, to M. Jasperse for assistance in Mathematica programming, to J. Lazendic-Galloway, T. Porter and to A. Vladimirov for help with GalProp. This research was funded in part by the Australian Research Council under Project ID DP0877916. The use of Monash University Sun Grid, a high-performance computing facility, is also gratefully acknowledged.
References
- [1] R. L. Golden, et al., Astrophys. J. 436, 769–775 (1994).
- [2] J. Alcaraz, et al., Phys. Lett. B484, 10–22 (2000).
- [3] M. Boezio, et al., Astrophys. J. 561, 787–799 (2001).
- [4] C. Grimani, et al., Astron. Astrophys. 392, 287–294 (2002).
- [5] S. W. Barwick, et al., Astrophys. J. 482, L191–L194 (1997).
- [6] J. J. Beatty, et al., Phys. Rev. Lett. 93, 241102 (2004).
- [7] O. Adriani, et al., Nature 458, 607–609 (2009).
- [8] T. Delahaye, F. Armand, M. Pohl, and P. Salati, arXiv:1102.0744 (2011).
- [9] M. Aguilar, et al., Phys. Rept. 366, 331–405 (2002).
- [10] S. Torii, et al., arXiv:0809.0760 (2008).
- [11] F. Aharonian, et al., Phys. Rev. Lett. 101, 261104 (2008).
- [12] F. Aharonian, et al., Astron. Astrophys. 508, 561 (2009).
- [13] M. Ackermann, et al., Phys. Rev. D82, 092004 (2010).
- [14] P. D. Serpico, Astrophysical models for the origin of the positron ’excess’ (2011).
- [15] V. Ginzburg, et al., Astrophysics of cosmic rays, North Holland, 1990.
- [16] A. W. Strong, I. V. Moskalenko, and V. S. Ptuskin, Ann. Rev. Nucl. Part. Sci. 57, 285–327 (2007).
- [17] E. S. Seo, and V. S. Ptuskin, Astrophys. J. 431, 705–714 (1994).
- [18] R. C. Cotta, et al., JHEP 01, 064 (2011).
- [19] G. Di Bernardo, et al., Astropart.Phys. 34, 528–538 (2011).
- [20] R. Trotta, et al., The Astrophysical Journal 729, 106 (2010).
- [21] K. Auchettl, and C. Balazs (2011), arXiv:1106.4138.
- [22] O. Adriani, et al., Astropart.Phys. 34, 1–11 (2010).
- [23] O. Adriani, et al., Phys. Rev. Lett. 106, 201101 (2011).
- [24] O. Adriani, et al., Phys. Rev. Lett. 105, 121101 (2010).
- [25] I. V. Moskalenko, et al., Astrophys.J. 565, 280–296 (2002).
- [26] K. E. Krombel, and M. E. Wiedenbeck, Astrophys. J. 328, 940–953 (1988).
- [27] J. A. Lezniak, and W. R. Webber, Astrophys. J. 223, 676–696 (1978).
- [28] J. J. Engelmann, et al., Astronomy and Astrophysics 233, 96–111 (1990).
- [29] E. M. et al., “The PAMELA Experiment: Preliminary Results after Two Years of Data Taking,” in 21st European Cosmic Ray Symposium (ECRS 2008), 2008, Proceeding of 21st European Cosmic Ray Symposium, pp. 396–401.
- [30] H. S. Ahn, et al., Astropart. Phys. 30, 133–141 (2008).
- [31] A. J. Davis, et al., “On the low energy decrease in galactic cosmic ray secondary/primary ratios,” in Acceleration and Transport of Energetic Particles Observed in the Heliosphere, edited by R. A. Mewaldt, J. R. Jokipii, M. A. Lee, E. Möbius, & T. H. Zurbuchen , 2000, vol. 528 of American Institute of Physics Conference Series, pp. 421–424.
- [32] M. Hareyama, “SUB-Fe/Fe ratio obtained by Sanriku balloon experiment,” in International Cosmic Ray Conference, 1999, vol. 3 of International Cosmic Ray Conference, pp. 105–+.
- [33] M. E. Wiedenbeck, and D. E. Greiner, The Astrophysical Journal Letters 239, L139–L142 (1980).
- [34] M. Garcia-Munoz, et al., “The Energy Dependence of Cosmic-Ray Propagation at Low Energy,” in International Cosmic Ray Conference, 1981, vol. 9 of International Cosmic Ray Conference, pp. 195–+.
- [35] T. Hams, et al., “ ratio up to 1.0 GeV/nucleon measured in the ISOMAX 98 balloon flight,” in International Cosmic Ray Conference, 2001, vol. 5 of International Cosmic Ray Conference, pp. 1655–+.
- [36] A. J. Davis, et al., AIP Conference Proceedings 528, 421–424 (2000), URL http://link.aip.org/link/?APC/528/421/1.
- [37] N. E. Yanasak, et al., Advances in Space Research 27, 727–736 (2001).
- [38] J. Burger, European Physical Journal C 33, 941–943 (2004).
- [39] A. Tawfik, and A. Saleh, arXiv:1010.5390 (2010).
- [40] M. Pesce-Rollins, and f. t. F. L. collaboration, arXiv:0907.0387 (2009).
- [41] M. T. Frandsen, I. Masina, and F. Sannino, arXiv:1011.0013 (2010).