Crystallographic, electronic, thermal and magnetic properties of single-crystal SrCo2As2
Abstract
In tetragonal single crystals, inelastic neutron scattering measurements demonstrated that strong stripe-type antiferromagnetic (AFM) correlations occur at a temperature K [W. Jayasekara et al., arXiv:1306.5174] that are the same as in the isostructural ( = Ca, Sr, Ba) parent compounds of high- superconductors. This surprising discovery suggests that may also be a good parent compound for high- superconductivity. Here, structural and thermal expansion, electrical resistivity , angle-resolved photoemission spectroscopy (ARPES), heat capacity , magnetic susceptibility , 75As NMR and neutron diffraction measurements of crystals are reported together with LDA band structure calculations that shed further light on this fascinating material. The -axis thermal expansion coefficient is negative from 7 to 300 K, whereas (the -axis thermal expansion coefficient) is positive over this range. The shows metallic character. The ARPES measurements and band theory confirm the metallic character and in addition show the presence of a flat band near the Fermi energy . The band calculations exhibit an extremely sharp peak in the density of states arising from a flat band, where the and axes are along the and axes of the Co square lattice, respectively. A comparison of the Sommerfeld coefficient of the electronic specific heat with suggests the presence of strong ferromagnetic itinerant spin correlations which on the basis of the Stoner criterion predicts that should be an itinerant ferromagnet, in conflict with the magnetization data. The does have a large magnitude, but also exhibits a broad maximum at K suggestive of dynamic short-range AFM spin correlations, in agreement with the neutron scattering data. The measurements show no evidence for any type of phase transition between 1.3 and 300 K and we suggest that metallic has a gapless quantum spin-liquid ground state.
pacs:
74.70.Xa, 75.40.Cx, 74.25.Jb, 75.25.-jI Introduction
After the discovery of high-temperature superconductivity (SC) below K in tetragonal LaFeAsO1-xFx (1111-type) in 2008,Kamihara2008 a worldwide effort began to understand the mechanism for the SC and to discover other Fe-based superconductors. This effort quickly led to the enhancement of to its current record among bulk Fe-based superconductors of K for the 1111-type compound .Wang2008 Additional families of Fe-based high- superconductors were soon discovered including the 122-type arsenides where the parent compounds have composition ( = Ca, Sr, Ba, Eu) with the tetragonal -type structure (space group ).Johnston2010 ; Paglione2010 ; Stewart2011 All families of Fe-based high- superconductors contain stacked square lattices of Fe atoms that are identical to the stacked square lattices of Cu atoms in the layered high- cuprates.Johnston2010 ; Bednorz1986 ; Johnston1997 ; Kastner1998
The 122-type family of iron arsenide-based superconductors is the most studied because large, high-quality single crystals can be grown,Canfield2010 and the parent compounds offer enormous flexibility for chemical substitutions on the , Fe and As sites. Crystals with masses g can be grown, which allows a broad range of measurements including inelastic neutron scattering measurements to be performed to characterize and understand the properties. It has been demonstrated that the parent compounds at ambient pressure exhibit a lattice distortion to an orthorhombic structure at a system-dependent K together with long-range antiferromagnetic (AFM) ordering at the same or somewhat lower Néel temperature .Johnston2010 ; Lumsden2010 The ordering propagation vector is the same as the nesting wave vector between the hole and electron pockets of the semimetallic band structure. This and the low ordered momentsJohnston2010 ; Lumsden2010 /Fe indicate an itinerant origin of the AFMMazin2008 ; Dong2008 rather than arising from interactions between local Fe magnetic moments.
The AFM structure within the -plane of the Fe square lattice is a so-called “stripe” structure in which ferromagnetically aligned stripes of Fe magnetic moments along the orthorhombic axis are AFM aligned along the axis.Johnston2010 ; Lumsden2010 These orthorhombic axes have the same directions as the respective Fe square lattice and axes which are in turn rotated by 45∘ with respect to the and axes of the body-centered tetragonal -type crystal structure. Furthermore, in order for high- SC to occur, this long-range AFM ordering must be largely suppressed by chemical substitutions or pressure, but strong dynamic short-range AFM correlations must still be preserved. These AFM fluctuations/correlations are widely considered to be the glue for the SC Cooper pairs.Johnston2010 ; Mazin2008 ; Mazin2009 ; Fernandes2010 A similar phenomenology and temperature-doping phase diagram are found for the high- cuprates.Bednorz1986 ; Johnston1997 ; Kastner1998 ; Basov2011
Among the substituted 122-type materials,Johnston2010 the best studied are Ba1-xK with K,Rotter2008 Ba(Fe1-xCo with K,Sefat2008 ; Leithe-Jasper2008 ; Nandi2010 and BaFe2(As1-xP with K.Jiang2009 The detailed temperature-composition phase diagram for Ba(Fe1-xCo with shows, as , an AFM region at , a region of coexisting AFM and SC for and a region of only SC order (the remaining part of the superconducting dome) for , where at .Nandi2010 Inelastic neutron scattering measurements demonstrated that the AFM correlations/fluctuations that are present in the paramagnetic (PM) state of above K (Ref. Matan2009, ) are absent in the nonsuperconducting PM composition at 10 K,Sato2011 consistent with the hypothesis that AFM spin fluctuations are required as the SC pairing glue in these materials.Johnston2010 ; Lumsden2010
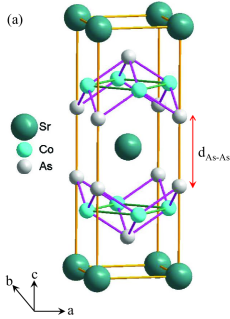
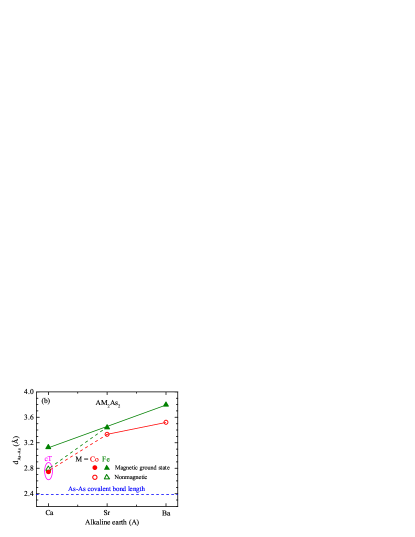
As might be expected from the latter result, neither magnetic susceptibilityLeithe-Jasper2008 nor neutron diffractionJayasekara2013 measurements on showed any evidence for long-range magnetic ordering above 1.8 and 4 K, respectively. This is the same result as found for isostructural ,Sefat2009 but is in contrast to the magnetic behavior of which shows A-type AFM ordering below a sample-dependent of 53 to 76 K.Cheng2012 ; Ying2012 ; Anand2013 The -type crystal structure of (Ref. Pfisterer1980, ) is shown in Fig. 1(a).
The As–As interlayer distance [see Fig. 1(a)] is correlated with the magnetic ground state,Anand2012b where a “layer” is defined as an As––As layer and is the transition metal, as shown in Fig. 1(b). with an AFM ground state has a collapsed tetragonal (cT) structure reflecting approach to interlayer As–As dimerization, where the As–As single-covalent-bond distanceCordero2008 is indicated in Fig. 1(b), whereas with a PM ground state has an uncollapsed tetragonal (T) structure without such dimerization. also has a PM ground state and is in an intermediate regime,Anand2012b as seen in Fig. 1(b). This correlation between the magnetic behavior and the crystal structure contrasts with that of the 122-type compounds where the cT structure of has a nonmagnetic ground state and the T structures of the Ca, Sr and Ba compounds all have AFM ground states.Johnston2010 ; Anand2012b ; Kreyssig2008 ; Goldman2009 ; Pratt2009 Interlayer As–As dimerization in the cT phase results in a valence of As-2, i.e. [As–As]-4, instead of the usual As-3 valence in the 122-type (Ca, Sr, Ba)As2 compounds, corresponding to a formal oxidation state of instead of the usual . From Fig. 1(b), may be in a regime with intermediate Co oxidation state between Co+1 in and Co+2 in . This intermediate valence state, in turn, might be expected to result in strong dynamic Co spin fluctuations in .
In view of the disappearance of dynamic AFM correlations in the PM state of the Ba(Fe1-xCo system as increases from to ,Matan2009 ; Sato2011 it is amazing that strong AFM stripe-type correlations are present in the end-member of the similar series Sr(Fe1-xCo (Refs. Hu2011, ; Zhao2008, ; Ewings2011, ) as established from inelastic neutron scattering measurements on single crystals.Jayasekara2013 The above-noted intermediate valence of the Co in may be responsible for the lack of long-range AFM order, at least in part. The presence of these AFM correlations in raises key questions about how they come about in this compound, why this compound is not superconducting, and whether it could be made superconducting by some type of chemical substitution or by application of pressure.
Here we report the investigation of undoped single crystals using x-ray and neutron diffraction, in-plane (-plane) electrical resistivity , angle-resolved photoemission spectroscopy (ARPES), heat capacity , magnetization , and 75As nuclear magnetic resonance (NMR) measurements, complemented by LDA band structure calculations. Experimental and theoretical details are given in Sec. II. The x-ray diffraction investigations of crushed crystals in Sec. III yield a structure in agreement with previous work. The measurements in Sec. IV demonstrate metallic character, consistent with the ARPES measurements in Sec. V which also indicate that there is no obvious significant Fermi surface nesting. The band theory calculations in Sec. VI reveal a sharp and high peak in the density of states near the Fermi energy . The measurements in Sec. VII further confirm the metallic character and confirm the presence of a large . The and measurements in Sec. VIII show clear evidence for dynamic short-range AFM spin correlations in a quasi-low-dimensional spin lattice, consistent with the inelastic neutron scattering results.Jayasekara2013 The NMR measurements are presented in Sec. IX which indicate the presence of stripe-type and/or FM correlations. The x-ray diffraction, , , and NMR measurements reveal no obvious phase transitions between 1.3 and 300 K, in agreement with the previousJayasekara2013 and present neutron diffraction measurements in Sec. X. In Sec. XI we discuss the ground state of metallic and suggest that this compound has a gapless quantum spin-liquid ground state. A summary and our conclusions are given in Sec. XII.
II Experimental and Theoretical Details
Single crystals of were grown from solution using Sn flux. In the Fe-based high- superconductivity field, Sn flux was first used by Ni et al. to grow crystals of and .Ni2008 High-purity elements Sr (99.95%) from Sigma-Aldrich, and Co (99.998%), As (99.99999%) and Sn (99.999%) from Alfa Aesar, were taken in 1:2:2:45 ratio and placed in an alumina crucible that was sealed in an evacuated silica tube. After prereacting the elements at 610 ∘C for 5 h, the assembly was heated to 1150 ∘C, left there for 8 h and then slowly cooled to 700 ∘C in 160 h. At this temperature the flux was decanted using a centrifuge. The typical size of the crystals obtained was mm3. However, by increasing the size of the crucible to a 10 mL capacity, large crystals of with masses up to g with dimensions up to can be grown out of Sn flux.Jayasekara2013
The chemical compositions of the crystals were determined by energy-dispersive x-ray analysis (EDX) using a JEOL-JSM-5910LV scanning electron microscope and found to be in agreement with the expected stoichiometric composition . These EDX measurements showed no visible peaks at the expected positions of the Sn x-ray emission lines, and the amount of Sn incorporated into the crystals from the Sn flux was given by the software as 0.22(16) at%, which is consistent with zero to within . However, we cannot rule out the possibility that a very small amount of Sn was incorporated into the crystals which might have had some influence on the results of our physical property measurements. For comparison, crystals grown in Sn flux contain at% Sn as determined using wavelength-dispersive x-ray analysis,Ni2008 which results in large changes in the physical properties such as in a reduction of the tetragonal to orthorhombic structural transition temperature from 136 K in pure crystals grown out of FeAs self-flux as discovered by Wang et al.Wang2009 to the value of 85 K in the crystals grown out of Sn flux by Ni et al.Ni2008
Structural characterization was performed using room-temperature powder x-ray diffraction (XRD) data obtained on crushed crystals using a Rigaku Geigerflex powder diffractometer and Cu- radiation. Rietveld refinement of the XRD data was carried out using the FULLPROF package.Carvajal1993 The , , and four-probe measurements were performed using instruments from Quantum Design, Inc. In the , and measurements, the contribution of the sample holder was measured separately and corrected for in each case.
A high-resolution x-ray powder diffraction pattern was collected at ambient temperature at the beamline X16C at the National Synchrotron Light Source. The sample was ground with an agate mortar and pestle in a glovebox having a water vapor concentration of a few parts per million, loaded into a glass Lindemann capillary of 0.3-mm nominal diameter, and flame-sealed without exposure to the atmosphere. The x-ray wavelength, 0.6995 Å, was chosen using a Si(111) double monochromator. The powder diffraction pattern was collected in the 5–45∘ 2 range with a constant step size of 0.005∘, and a linearly varying counting time of 1–3 s/point. The incident beam intensity was monitored with an ion chamber and the diffracted radiation was measured with a NaI(Tl) scintillation detector. The axial and in-plane resolution of the diffractometer were set by slits and a Ge(111) analyzer crystal, respectively. Rietveld refinement of the x-ray diffraction pattern was done using the GSASLarson2004 package.
High-resolution single-crystal x-ray diffraction measurements were performed on a four-circle diffractometer using Cu- radiation from a rotating anode x-ray source, selected by a Ge(111) monochromator. For measurements of the temperature dependence of the lattice parameters, a platelike single crystal, with the tetragonal c-axis perpendicular to the plate, was attached to a flat copper sample holder on the cold finger of a He closed-cycle displex refrigerator. The sample was oriented such that the ( 0 ) plane or the plane of the reciprocal lattice was coincident with the scattering plane of the diffractometer.
Single-crystal neutron diffraction measurements were done on the TRIAX triple-axis spectrometer at the University of Missouri Research Reactor employing an incident neutron energy of 14.7 meV. A plate-like crystal of mass 302.4 mg was mounted on the cold finger of a closed-cycle displex refrigerator with the () plane of the reciprocal lattice coincident with the scattering plane of the diffractometer, allowing us to search for magnetic scattering at the reciprocal lattice positions for the A-type AFM structure [() with ], as found previously for CaCo2As2,Anand2013 and the G-type AFM structure [() with and odd], as found for the related compound BaMn2As2.SinghY2009
High-resolution ARPES experiments were carried out using a Scienta R4000 electron analyzer and 140 eV photon energy at beamline 7.0.1 of the Advanced Light Source (ALS), Berkeley, California. The crystals were cleaved in situ along the ab plane and measured at a pressure of mbar. The energy and momentum resolution were set to meV and , respectively. The Fermi energy () of the sample was referenced to that of a gold sample deposited in situ on the sample holder. In our notation the Brillouin zone (BZ) of is that of the body-centered-tetragonal () direct lattice and not that of the Co square lattice, and the axes of the Brillouin zone are, as conventionally defined in the literature, in the directions of the direct lattice translation vectors (a,b,c), respectively.Johnston2010
Nuclear magnetic resonance (NMR) measurements were carried out on 75As (I = 3/2, = 7.2919 MHz/T) using a homemade phase-coherent spin-echo pulse spectrometer. 75As-NMR spectra were obtained by sweeping the magnetic field at a fixed frequency MHz. The magnetic field was applied parallel to either the crystal axis or the -plane. The origin of the NMR shift of the 75As nucleus was determined by 75As NMR measurements of GaAs. The 75As nuclear spin-lattice relaxation rate (1/) was measured with a saturation recovery method.
For electronic structure calculations, we used the full-potential linear augmented plane wave (FP-LAPW)Blaha2001 method with the local density approximation (LDA).Perdew1992 To obtain self consistent charge and wave functions, we employed with muffin tin radii 2.1, and 2.1 a.u. for Sr, Co and As, respectively. 828 k points were selected in the irreducible Brillouin zone and calculations were iterated to reach the total energy convergence criterion which was 0.01 mRy/cell, where a “cell” is a primitive cell containing one formula unit of five atoms. Our experimental lattice parameters in Table 1 for the structure of ( Å, Å) were used in the calculations. To obtain the theoretical -axis position of the As atom, its position was relaxed until the force on the As atom was smaller than 1 mRy/a.u., which gave . This value is somewhat smaller than our experimental value in Table 1.
III Crystallography and Thermal Expansion
III.1 Powder X-Ray Diffraction: Crystal Structure
| Compound | (Å) | (Å) | (Å) | Structure | Reference | ||
|---|---|---|---|---|---|---|---|
| 3.9831(2) | 10.2732(6) | 2.5792(3) | 0.3664(2) | 2.745(4) | cT | [Anand2012b, ; Anand2013, ] | |
| 3.989(3) | 10.33(1) | 2.590(9) | 0.372 | 2.64 | [Pfisterer1980, ] | ||
| 3.9471(4) | 11.801(1) | 2.9898(6) | 0.3588(1) | 3.333(3) | This work111Laboratory-based x-ray powder diffraction measurements. | ||
| 3.9466(2) | 11.773(1) | 2.9831(4) | 0.3587(3) | 3.327(7) | This work222Synchrotron-based x-ray powder diffraction measurements. | ||
| 3.935(7) | 11.83(2) | 3.006(10) | 0.362 | 3.27 | [Pfisterer1980, ] | ||
| 3.958(5) | 12.67(2) | 3.201(9) | 0.361 | 3.52 | T | [Pfisterer1980, ] |
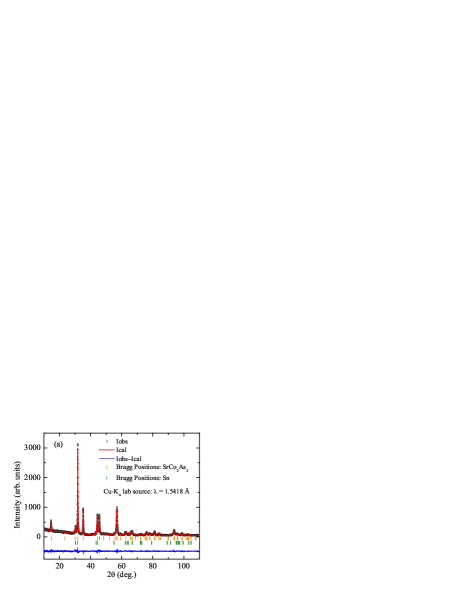
The laboratory-based powder XRD data for are shown in Fig. 2(a), along with the two-phase Rietveld refinement fit including a fit to the adventitious Sn from the flux on the surface of the crystals prior to crushing them, the difference profile and Bragg positions for the main phase as well as for Sn. The parameters fitted during the refinement were the lattice parameters, As -axis position parameter , isotropic thermal parameters, scale factor, zero shift, three resolution parameters, profile shape parameter and asymmetry parameters. The Sn impurity phase fraction was found to be 4.9 wt%. The site occupancies of Sr, Co and As were kept fixed at 100% during the final refinement cycle because allowing the occupancies to vary from this value did not improve the fit significantly. The lattice parameters and are listed in Table 1 along with the corresponding literature data for , and .Anand2012b ; Anand2013 ; Pfisterer1980 Our data for are in reasonable agreement with those of Ref. Pfisterer1980, .
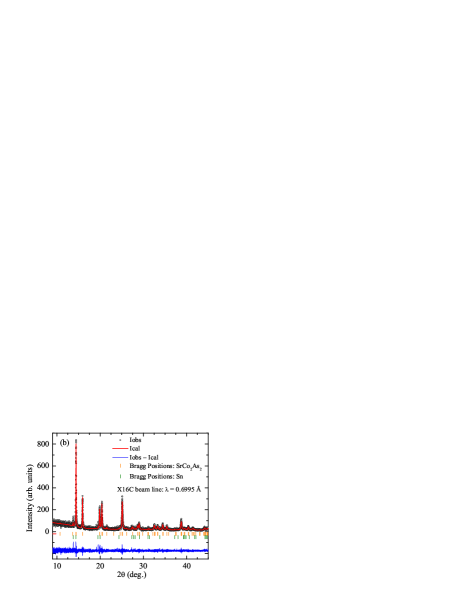
The synchrotron x-ray diffraction pattern for , the Rietveld profile refinement fit and residuals are displayed in Fig. 2(b). Here again, an impurity phase of adventitious Sn flux, comprising in this sample approximately 1% of the sample by weight, was included in the refinement of the powder diffraction pattern. A small section of low angle data was removed from the refinement due to poor statistics. Several very low intensity peaks could not be identified conclusively with other impurity phases. Table 1 gives a summary of the results of the refinement of the powder XRD data for the phase. These data are in good agreement with those found above from the laboratory-based x-ray diffraction measurements.
III.2 Single-Crystal X-ray Diffraction: Thermal Expansion and Search for a Temperature-Induced Orthorhombic Distortion
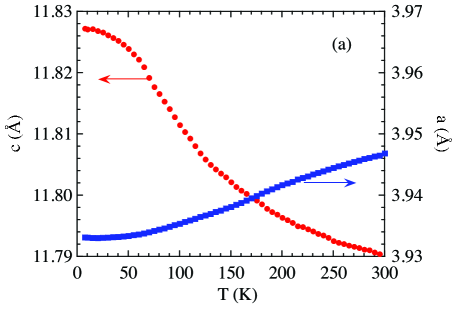
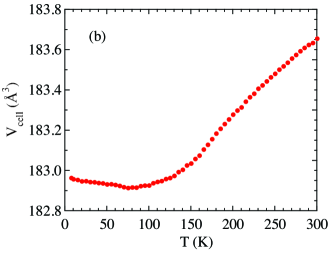
The dependences of the and lattice parameters were extracted from the positions of the (2 0 8) and (0 0 8) Bragg peaks measured by single-crystal x-ray diffraction as described in Sec. II. Figure 3(a) shows a striking decrease in the lattice parameter by approximately 0.3% as increases from our base temperature of 7.4 to 300 K, corresponding to a negative thermal expansion coefficient along the -axis over the full range of the measurement. In contrast, the lattice parameter increases by % with increasing over the same interval which corresponds to the usual positive thermal expansion coefficient. The volume thermal expansion in Fig. 3(b) initially decreases on heating above 8 K and then increases from K to room temperature.
Negative thermal expansion coefficients in the paramagnetic states of materials are unusual. Indeed, the anisotropic thermal expansion coefficients above the coupled structural and magnetic transitions in crystals of the high- parent compounds Budko2010 and in Ba(Fe1-xCoAs2 crystals with and 0.074 (Ref. Budko2009, ) are all positive. On the other hand, Ca1-xLa crystals with , 0.20 and 0.25 all show temperature regions where the - and/or -axis and volume expansion coefficients are negative.Rebello2012 These latter behaviors are suggested by the authors to originate from proximity to a structural phase transition.
Our thermal expansion data in Fig. 3 reveal no obvious evidence for a temperature-induced lattice distortion in . We therefore specifically searched for an orthorhombic lattice distortion, using high-resolution single-crystal x-ray diffraction, that might be associated with the observed negative -axis and volume thermal expansion coefficients. However, no splitting or changes of peak shape were observed in the temperature range 10–300 K for the (2 0 8) or (1 1 8) reflections measured in the and scattering planes, respectively, demonstrating that no tetragonal to orthorhombic lattice distortion occurs over this range to within an estimated upper limit for a potential distortion of .
IV Electrical Resistivity
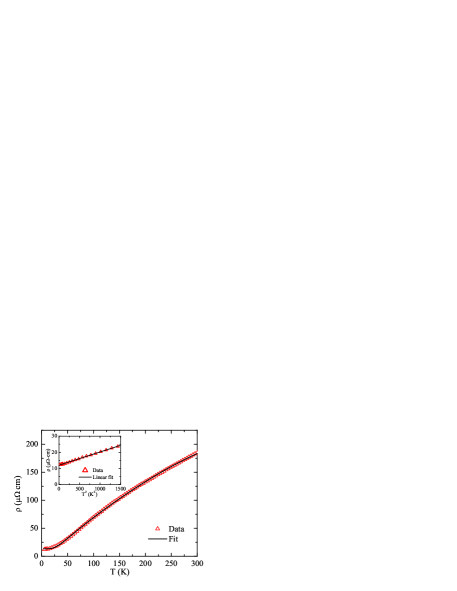
Figure 4 shows the -plane of . The data exhibit metallic behavior with a high residual resistivity ratio , indicating good crystal quality. At low temperatures ( K) we find that follows (inset of Fig. 4) as expected for a Fermi liquid.Stewart2001 A fit by this equation gives cm and cm/K2.
The data over the entire range could not be fitted well solely by the sum of a -independent term and the Bloch-Grüneisen prediction for carrier scattering by longitudinal lattice vibrations in the absence of umklapp scattering given byGoetsch2012 ; Blatt1968
| (1a) | |||
| where is the Debye temperature obtained from fitting resistivity measurements and is a material-dependent scale factor that is independent of . Equation (1a) yields | |||
| (1b) | |||
| At high temperatures , the BG model yields a that is proportional to , whereas the experimental data in Fig. 4 show negative curvature at high . Therefore, we also used a Mott interband scattering term (Refs. Mott1936, ; Giovannini1998, ) to fit the data according to | |||
| (1c) | |||
| This fit function is not accurate at low because the data below 38 K follow a dependence as shown in the inset of Fig. 4 and discussed above, whereas has a dependence at low . Furthermore, we used the high-accuracy analytic dimensionless Padé approximant in Ref. Goetsch2012, in place of Eq. (1a) to facilitate the least-squares fit to the data, where | |||
| (1d) | |||
A good fit of the experimental data in Fig. 4 by Eqs. (1) was obtained (black curve in Fig. 4), where the fitted parameters are cm, cm, K and cm K-3. From the value of and Eq. (1b) we obtain cm. A significant contribution from the Mott interband scattering is expected in materials where narrow bands appear at the Fermi level, for example in elemental Pd metal.Mott1936 Since the ARPES data and the band structure calculations presented below show that an extremely narrow band is present at in , a substantial contribution from Mott interband scattering is not surprising.
V ARPES
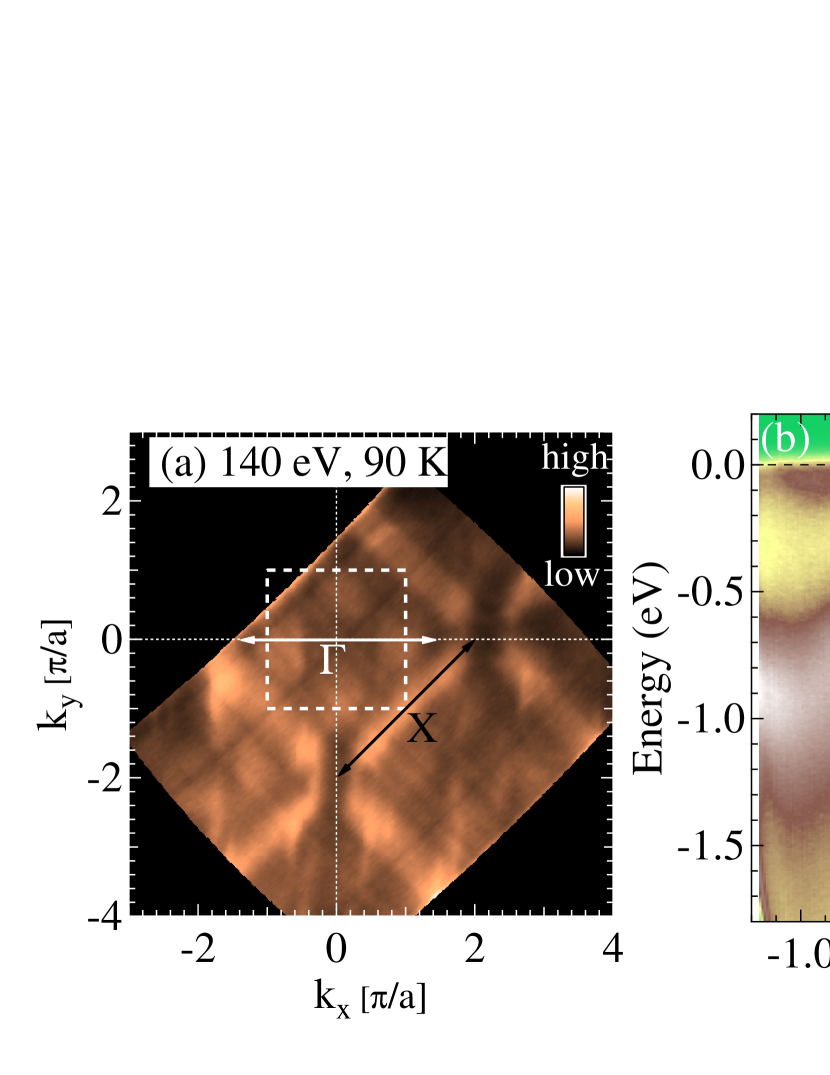
We studied the electronic properties of a SrCo2As2 single crystal using high-resolution ARPES, which can directly probe the low-energy electronic excitations as a function of binding energy and momentum. Figure 5(a) shows the photoemission intensity map, which is obtained by integrating over an energy window of 10 meV with respect to the Fermi energy , measured with a photon energy of 140 eV and sample temperature of 90 K. We clearly see four patches of intensity arranged around the center ( point) of the Brillouin zone (BZ), which are located at along the and directions. More interesting is the observation of a large k-independent intensity near along the directions passing through the corners (X points) of the BZ. This indicates the presence of a flat band near that extends over a large fraction of the second BZ. Our LDA band structure calculations in Fig. 8(c) below confirm the presence of a flat band situated at or very close to that passes through the X points in the directions, where here the and axes are along the and axes of the Co square lattice, respectively. A wide flat band just above with an associated very sharp peak in the density of states was also present in previous LDA band calculations for KCo2As2.Singh2009
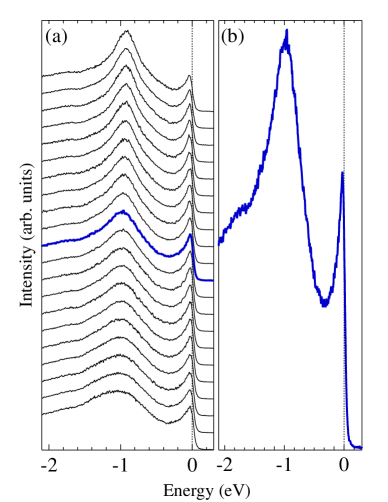
Energy distribution curves (EDCs) for fixed momenta moving along the white line at the top of Fig. 5(c) are shown in Fig. 6(a), and an enlargement of the EDC in bold blue in Fig. 6(a) is plotted in Fig. 6(b). This shows in more detail a large and sharp peak in the quasiparticle density of states at as expected from the flat band near and associated sharp peak in the density of states identified in the band structure calculations. We speculate that the anomalous -axis thermal expansion behavior and perhaps some of the magnetic properties we observe for SrCo2As2 are driven by the presence of this flat band at or near .
In general, this Fermi surface (FS) is very different from those of other related parent compounds of the 122 family like BaFe2As2 and SrFe2As2, where the hole FSs at and the electron FSs at X are roughly circular in shape and similar in size.Kondo2010 To gain more insight about the character of the FS pockets, in Figs. 5(b,c) we show the energy-momentum ARPES intensity maps along two different cuts, marked by the white [across the (0,0) point] and black [across the X () point] bars in Fig. 5(a). In Fig. 5(b), one can observe a rather weak but discernible electron-like FS pocket at the -point and two additional small electron pockets at . A general observation in Ba(Fe1-xCoAs2 is that with increasing (electron doping), the central hole pockets at become electron-like, while the X pockets remain electron-like and keep expanding on the overdoped side of the phase diagram (see, e.g., the ARPES data for the sample in Ref. Liu2011, ). An electron pocket at the center of the BZ [Fig. 5(b)] for SrCo2As2 is expected and is in overall agreement with our previous study of Ba(Fe1-xCox)2As2.Liu2011 The pocket at the X-point is also electron-like, but much larger in size [Fig. 5(c)], so there is no obvious Fermi surface nesting in SrCo2As2.
We extracted the Fermi momenta of the electron pockets from the peaks in the momentum distribution curves at (not shown), and were found to be about Å-1 [vertical black arrows at the top of Fig. 5(b)] and Å-1 [vertical black arrows at the top of Fig. 5(c)] centered at the and X points, respectively. Figure 5(b) also shows that the top of the hole band at the point has moved from above for the compounds to about 400 meV below due to Co contributing one conduction electron more than Fe. This leads to the disappearance of the hole-like Fermi surface around the -point as discussed above,Liu2011 and is consistent with our recent ARPES study of BaCo2As2.Dhaka2013 In particular, the energies of the top and bottom of the valence band at the and X points, the size of the electron pockets surrounding the point, and the location and extent of the flat band at the X point are very similar for both materials.
VI Band Structure Calculations
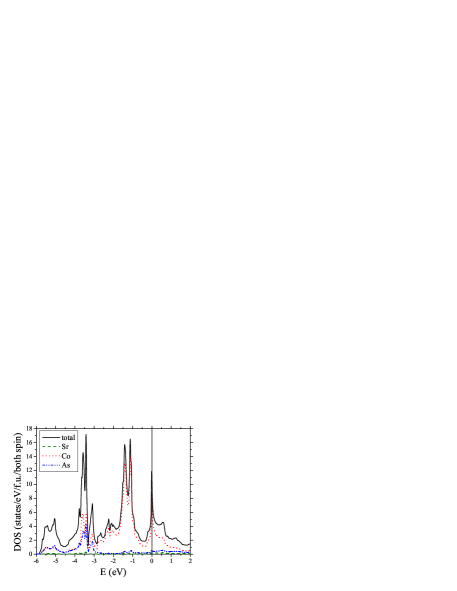
The top and bottom panels of Fig. 7 are atom- and orbital-decomposed densities of states (DOS) which were calculated with 1631 k points in the irreducible BZ. The top panel shows strongly hybridized bonding states between Co and As atoms in the energy range from 3 to 6 eV below . There are also antibonding empty states but they are located outside of the energy range shown. It also shows, near , a strong peak which is mostly of Co character. It is well known that a system that has a high DOS or peak at is unstable and has a tendency to split the peak (lower the total energy) via physical transformations such as magnetic or structural transitions.Mohn2006 Therefore, it might be expected that also shows peculiar temperature- or pressure-dependent properties, which depend on the precise peak position.
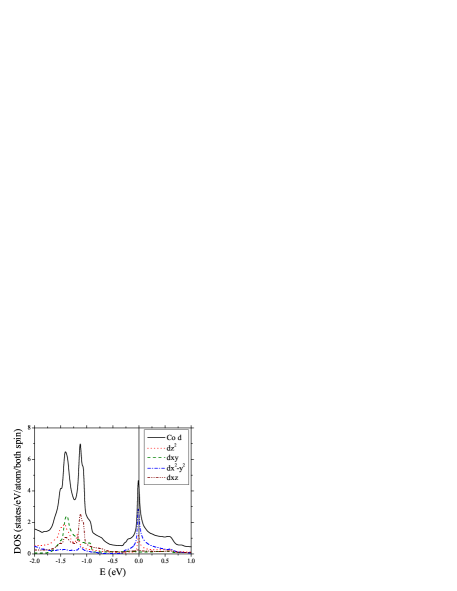
The bottom panel of Fig. 7 shows the orbital-decomposed Co atom DOS in a small energy range (from 2 eV below to 1 eV above ) to emphasize the orbital contributions to the peak near . The orbital points towards neighboring Co atoms in the -plane and is a dominant contributor, where the and axes are defined here to be along the and axes of the Co square lattice, respectively. It suggests a possibility to control the peak size or position by Co–Co distance modification.
Thus the very sharp peak in the DOS near in Fig. 7(a) arises from a Co flat band extending over a large fraction of the second BZ. The band structure density of states at is
| (2) |
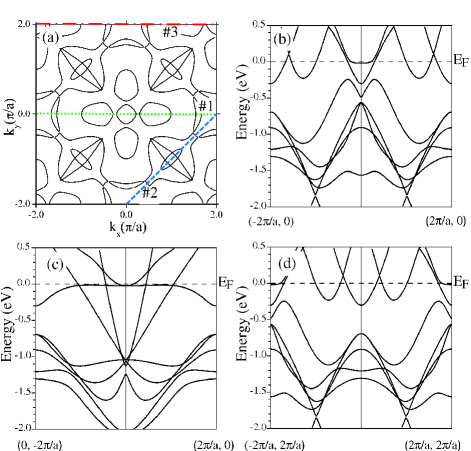
Figure 8 shows a Fermi surface (FS) plot and band structures for three different cuts in k-space. For the Fermi surface calculation, we divided the range of planes with different values into a mesh that gives 40401 points. Figure 8(a) shows the result with and also shows three cutting lines for band structure calculations. The cutting line #1 is from to , #2 is from to and cutting line #3 is from to , with . These cutting lines #1 – #3 correspond to the band structure plots Figs. 8(b)–8(d), respectively. Figure 8(c) shows the flat band that is largely responsible for the sharp high peak in the DOS near .
VII Heat Capacity
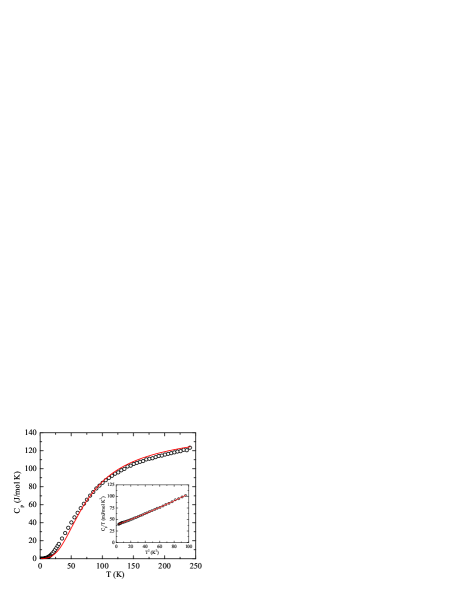
The of is plotted versus in Fig. 9. The value of at 240 K is 124 J/mol K which is close to the Dulong-Petit high- limit of the lattice heat capacity at constant volume given by J/mol K, where is the molar gas constant. The inset in Fig. 9 shows a conventional versus plot for K where the data are fitted by the expression
| (3) |
which is the sum of electronic and low- lattice ( heat capacity contributions. The fitted values of the Sommerfeld coefficient and the lattice coefficients and are listed in Table 2. The value of is very large compared to those of the parent iron arsenide compounds ( = Ca, Sr, Ba) in the stripe AFM state.Ronning2008 ; Chen2008 ; Rotundu2010 Additional data at T down to 1.3 K revealed no new features (not shown).
The density of states at the Fermi energy for both spin directions , including many-body enhancement effects due to the electron-phonon and electron-electron interactions, is calculated from
| (4) |
Using the above value of yields
| (5) |
for both spin directions. This value is 1.45 times the band theory value of 11.04 states/(eV f.u.) (Table 2). Writing , where and are the band theory values of and the current carrier effective mass, is the electron-phonon coupling constant and is the electronic many-body conduction carrier mass enhancement over the band theory value, gives
| (6) |
A similar analysis of obtained at low has been done for paramagnetic , where the authors findSefat2009
| (7a) | |||||
| (7c) | |||||
The and values of and , respectively, are seen to be nearly the same. The difference between the combined electron-phonon and electronic mass enhancements in Eqs. (6) and (7c) arises mainly from the difference in the band structure densities of states of the two compounds.
The Debye temperature is obtained from the value of according to
| (8) |
where is normalized to a mole of formula units (f.u.) and is the number of atoms per f.u. Thus we obtain K. This value is much larger than the value K obtained above in Sec. IV from the Bloch-Grüneisen fit to . This discrepancy may be associated with the unusual negative thermal expansion characteristics discussed in Sec. III.2 above and/or with -dependent spin fluctuation effects discussed in Sec. IX below and associated magnetoelastic coupling effects.
The Kadowaki-Woods (KW) ratio is m cm mol2 J-2 K2, similar to those observed in strongly-correlated electron metals and heavy fermion compounds,Jacko2009 thus suggesting the presence of strong electron correlations in .
The data in the entire range of measurement were fitted by
| (9a) | |||
| where was fixed at the above-determined value 37.8 mJ/mol K2 and is the number of atoms/f.u. The function is the Debye lattice heat capacity at constant volume per mole of atoms due to acoustic phonons given byGopal1966 | |||
| (9b) | |||
where is the Debye temperature. A high-accuracy analytic Padé approximantGoetsch2012 for the Debye function in Eq. (9b) was used for fitting the data which greatly facilitates the fit. The derived from the least-squares fit of the data over the full range in Fig. 9 by Eq. (9a) is 304(3) K as listed in Table 2. This value of is significantly larger than the value of 251(1) K determined above from fitting the data at low K by Eq. (3). Furthermore, the goodness of fit obtained is poor, evident from the large systematic deviations of the fit from the data in Fig. 9 compared to the much better fits we recently obtained for other 122-type compounds.Goetsch2012 ; Anand2013 This unusually large deviation between the two values might be related to the negative thermal expansion reported in Sec. III.2 and/or magnetoelastic coupling effects arising from strongly -dependent spin fluctuations.
The parameters of the above fits and derived quantities are summarized in Table 2.
| Parameter | ||
|---|---|---|
| (This work) | (Refs. Sefat2009, and SafatError, ) | |
| (mJ/mol K2) | 37.8(1) | 41.0 |
| (mJ/mol K4) | 0.611(7) | 0.47 |
| J/mol K6) | 1.01(9) | |
| 111The units are for both spin directions. | 16.0(3) | 17.4 |
| 111The units are for both spin directions. | 54 | 90 |
| 3.4 | 5.2 | |
| 111The units are for both spin directions. | 11.04 | 8.5 |
| (K) (Low ) | 251(1) | 274 |
| (K) (All ) | 304(3) | |
| (K) (All ) | 167(1) | |
| ( cm/K2) | 7.92(3) | 2.2 |
| 222The units are . | 5.7 | 1.3 |
| 1.45 | 2.0 |
VIII Magnetization and Magnetic Susceptibility
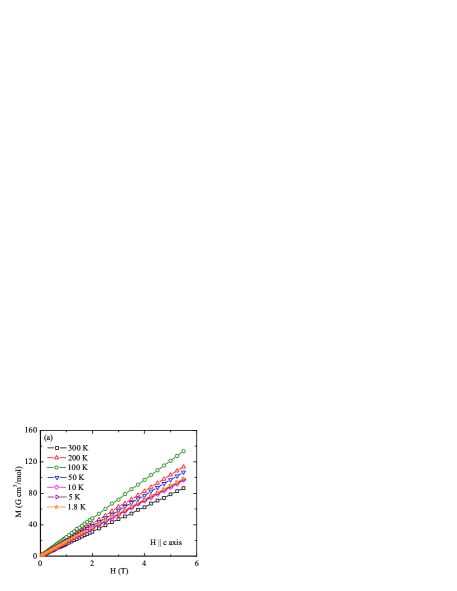
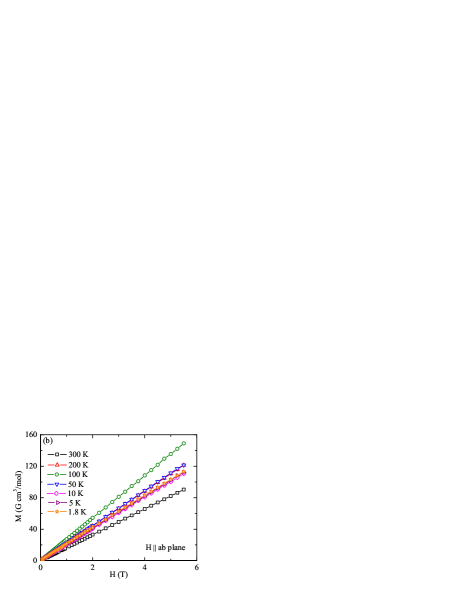
The isothermal magnetization of a single crystal versus for and -plane are shown in Figs. 10(a) and 10(b), respectively. The is proportional to for the entire and ranges of the measurements for both field directions, showing that the crystal does not contain detectable ferromagnetic (FM) or saturable PM impurities. Therefore the susceptibility can be defined at arbitrary field as .
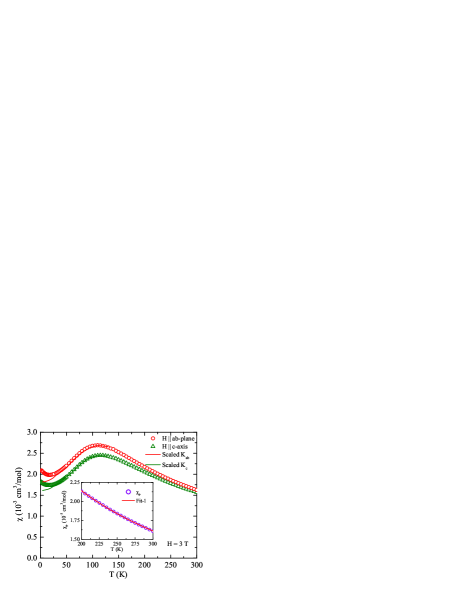
The anisotropic magnetic susceptibilities and of in T are plotted versus in Fig. 11, where and -plane). The data for both field directions exhibit broad maxima at K followed by shallow minima at K and smooth low- upturns below 20 K, with no evidence for long-range magnetic ordering. A very similar broad maximum in at about the same temperature was observed for isostructural .Hardy2013 The maximum in for that compound was attributed to a crossover from a coherent to an incoherent Fermi liquid state with increasing .Hardy2013
The dependences of the 75As NMR Knight shift data in Fig. 16(a) below are in overall agreement with the data in Fig. 11, except that the data do not show the upturns seen in the data below K. This difference indicates that these upturns in are not intrinsic and therefore likely arise from paramagnetic impurities or defects that are not saturable in our field range (see Fig. 10). The Knight shift data from Fig. 16(a) are therefore scaled onto the respective low- data in Fig. 11 as shown by the solid curves, which represent the intrinsic at low . The intrinsic values for at 4.3 K are found to be
| (10a) | |||||
| (10b) | |||||
| (10c) | |||||
| where the powder-averaged susceptibility is | |||||
| (10d) | |||||
The effective density of states at for both spin directions obtained from magnetic susceptibility measurements is calculated from for using the expression
| (11) |
yielding a large density of states
| (12) |
The anisotropy in is small with slightly larger than . The sign of the anisotropy is opposite to that in the PM state of (Refs. Cheng2012, ; Ying2012, ) and in .Sefat2009 ; SafatError
For comparison, from the high-field slopes from 2 to 6.5 T of the data for at K in the inset of Fig. 1 of Ref. Sefat2009, , we obtainSafatError
| (13a) | |||||
| (13b) | |||||
| (13c) | |||||
These values are % larger than our respective values at 4.3 K for in Eqs. (10). The density of states calculated from for using Eq. (11) is
| (14) |
VIII.1 Stoner Enhancement and the Wilson Ratio:
A Conundrum
In an itinerant picture, the Stoner-enhanced susceptibility at and isMizutani2003
| (15) |
where is the conduction carrier spin susceptibility calculated from the band-structure density of states at as in Eq. (11), eV is the Stoner factor for Co (Ref. Sefat2009, ) and the factor of 1/4 arises due to the presence of two Co atoms per f.u. and from the two spin directions counted in . Using states/(eV f.u.) from Eq. (2) and eV gives
| (16) |
which from comparison with Eq. (15) indicates that should have a FM ground state. This inference is wrong because it strongly disagrees with our and data in Figs. 10 and 11, respectively.
The Wilson ratio is defined as
| (17) |
Within an itinerant picture, if –2, and are approximately equally enhanced above the band structure prediction, indicating that any enhancement of and is due to a many-body enhancement of . On the other hand, if or , one would infer that strong FM or AFM conduction spin correlations are present, respectively, which change but not .Grimvall1976 Using the values of and in Eqs. (12) and (5), respectively, Eq. (17) gives
| (18) |
As discussed above, this large value of indicates a significant FM enhancement of , qualitatively consistent with the large value of the factor derived above.
These indications of dominant FM correlations between the itinerant current carriers in are at odds with the broad maximum in at about 115 K in Fig. 11, which instead suggests the dominance of low-dimensional AFM correlations,Johnston1997 and with the linear behaviors in Fig. 10 that show no tendency towards saturation. Indeed, inelastic neutron scattering measurements on this compound showed strong AFM fluctuations at the stripe AFM wave vector,Jayasekara2013 but preliminary searches for FM spin fluctuations in the first BZ yielded no detectable signal. On the other hand, electronic structure calculations of the static showed enhancements at both the FM and stripe AFM wave vectors.Jayasekara2013 Interestingly, enhancements of at the same two wave vectors are found from electronic structure calculations and measurements of the FeAs-based materials.Johnston2010 ; Mazin2008
A similar analysis of and data for isostructural yielded a similar conclusion about the importance of FM itinerant spin correlations in this compound.Sefat2009 Using the densities of states for in Eqs. (7c) and (14), one obtains the value of the Wilson ratio from Eq. (17) as
| (19) |
This value is larger than for in Eq. (18), suggesting stronger FM correlations in this compound. The authors of Ref. Sefat2009, suggested that the suppression of long-range FM order in results from strong spin fluctuations associated with a nearby quantum critical point.
VIII.2 Curie-Weiss Model
| Parameter | Fit 1 | Fit 2 |
|---|---|---|
| 0.65(1) | 1.0(2) | |
| 1.86(2) | 2.3(2) | |
| /Co) | 1.61(2) | 2.0(2) |
| (K) |
Above K, the of resembles a Curie-Weiss-like (CW) behavior
| (20) |
The values of the Curie constant and Weiss temperature obtained by fitting between 200 and 300 K, assuming (Fit 1), are listed in Table 3. In a second fit, the value was allowed to vary, yielding a different set of fit parameters (Fit 2) in Table 3. The Fit 1 is shown as the red curve in the inset of Fig. 11; both fits to the data are equally good and cannot be distinguished on the scale of the inset. In a local-moment model, the Curie constant per mole of spins is given by
| (21) |
where is Avogadro’s number, is the spectroscopic splitting factor (-factor), is the spin quantum number, is the Bohr magneton and is Boltzmann’s constant. The corresponding effective magnetic moment is computed from
| (22) |
The calculated values of and for the two fits taking are given in Table 3.
For an interacting local moment Heisenberg model for identical crystallographically equivalent spins, one hasJohnston2012
| (23) |
where the sum is over all interacting neighbors of a given spin . Within the - model for the square Co lattice where and are the four nearest- and four next-nearest-neighbor exchange interactions, respectively, and using , one obtains
| (24) |
Our values then give
| (25a) | |||||
| (25b) | |||||
which are strongly antiferromagnetic.
We emphasize that the values of and may be in error because the CW fit to the data may not have been done at sufficiently high temperatures for the CW law to accurately describe the data, and/or because may be an itinerant magnetic system instead of a local-moment one.
The results of measurements on a polycrystalline sample were reported earlier by Leithe-Jasper et al.Leithe-Jasper2008 The authors found that is a CW paramagnet showing no magnetic ordering above 1.8 K with and K. These and values are both significantly smaller than our values in Table 3 for a single crystal, and these authors did not report observing the maximum in that we observe at K in Fig. 11 for both field orientations and therefore which also occurs for the polycrystalline average.
VIII.3 Interconfigurational Fluctuation (ICF) Model
As discussed above, in an itinerant picture, one expects and to be ferromagnetic. The observed absence of ferromagnetism in these compounds suggests that strong spin fluctuation effects prevent the occurrence of long-range FM ordering, perhaps due to proximity to a quantum critical point.Sefat2009 The observed broad maximum in in Fig. 11 and the large magnitude of in Table 3 can then be analyzed within a phenomenological interconfigurational fluctuation (ICF) model where the average fluctuating valence of the magnetic ions in a material is -dependent.Sales1975 ; Franz1980 For this model, at high , we find a CW-like with a negative (AFM-like) Weiss temperature, as observed, which conflicts with the positive (FM-like) Weiss temperature expected if were near a FM instability. A many-body theory of intermediate-valence and interconfigurational fluctuation effectsChaloupka2013 has been applied to understand the -dependent local momentGretarsson2013 and associated anomalous dependence of (Ref. Johnston2010, ) in the PM states of the iron arsenides.
The ICF model is derived from the of an isolated two-level local-moment magnetic system. Here we apply it to local-moment -electron systems with quenched orbital angular momentum (). Spin-orbit coupling generally causes a deviation of from the free-electron value and the introduction of a paramagnetic Van Vleck orbital susceptibility. The ground state has energy , spin and Zeeman degeneracy and the excited state has energy , spin and degeneracy . The spin susceptibility of this two-level system is then
| (26a) | |||
| where the probabilities of occupying state 0 or 1 are given by the Boltzmann distribution as | |||
| (26b) | |||
| The susceptibilities of the two levels are given by Curie laws as | |||
| (26c) | |||
| with Curie constants | |||
| (26d) | |||
The phenomenological ICF susceptibility is derived from the above results for an isolated two-level system by making the replacement
| (27a) | |||
| in Eqs. (26), whereFranz1980 | |||
| (27b) | |||
| orSales1975 | |||
| (27c) | |||
and is an effective spin fluctuation temperature that reflects the frequency of fluctuations in the spin state of the magnetic ion between and .
| Model | |||||||
|---|---|---|---|---|---|---|---|
| (K) | (K) | () | () | (K) | |||
| Model 1 | 224(1) | 83.7(7) | 2.25(5) | 1.26 | 0.95 | ||
| Model 2 | 468(5) | 183(3) | 4.8(2) | 5.76 | 4.32 |
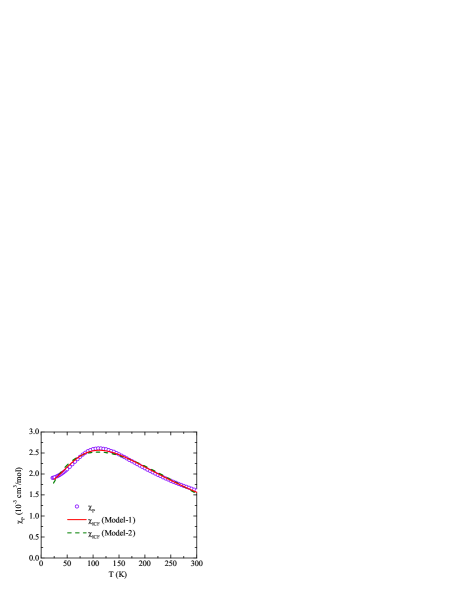
We fitted our experimental by
| (28) |
where is the -independent orbital susceptibility and is the ICF spin susceptibility. We tried the combinations and , but only the combination gave a satisfactory fit to the experimental data, for which Eqs. (26) and (27) yield
| (29a) | |||
| and, using because , | |||
| (29b) | |||
Using the expression for for model 1 in Eqs. (27), a high- series expansion of Eq. (29b) gives
where
| (29d) |
and first appears in the third term. The factor of 3/4 arises because in the limit of high the probability of occupying the triplet excited state is 3/4. In this limit, Eq. (VIII.3) yields a Curie law
| (29e) |
where is the Curie constant of the two-level system at high . Expanding the first two terms in Eq. (VIII.3) in a Taylor series according to gives a Curie-Weiss-like behavior
| (29f) |
where the Weiss temperature is
| (30a) | |||
| with a negative sign (AFM-like). It is interesting that this expression for in model 1 does not contain the ICF parameter . Carrying out the same steps for model 2 gives a Curie-Weiss law (29f) with the same Curie constant but a different Weiss temperature | |||
| (30b) | |||
which for this model does contain .
The values of the fitted parameters , , and for models 1 and 2 using are listed in Table 4 and the fits by the two models are shown in Fig. 12. Also listed in Table 4 are the values of , , and derived from these parameters using Eqs. (26d), (29d) and (30), respectively. Although good fits are obtained using both models, the value for the fit by model 2 is unphysically large and negative and even the value for model 1 is unusually negative. Furthermore, the values of and are much closer to the Curie-Weiss fit values in Table 3 for model 1 compared to model 2. However, we only expect the fitting parameters to be semi-quantitative because the ICF model is phenomenological.
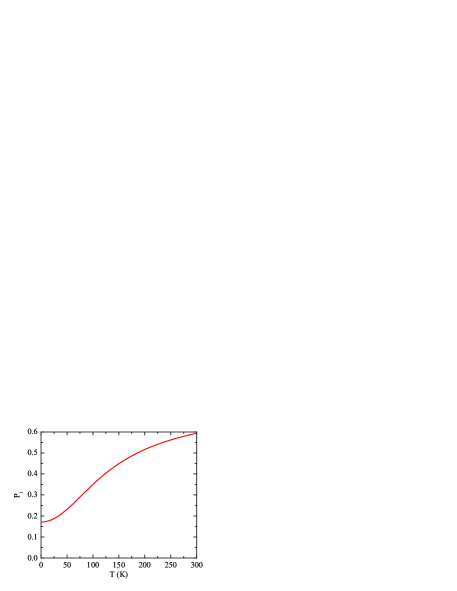
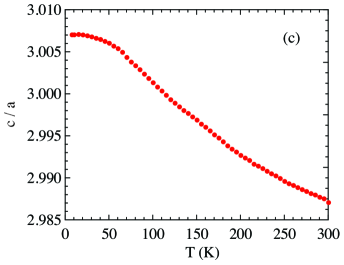
Figure 13 shows the dependence of the fractional population of the magnetic excited triplet state with for model 1 and the parameters in Table 4. Our thermal expansion measurements in Fig. 3(a) show that exhibits anomalous negative thermal expansion along the -direction and positive thermal expansion in the basal plane, which results in a ratio that is dependent and increases with increasing with a dependence similar to that in Fig. 13 [see Fig. 3(c)]. Thus the dependence of and the population are correlated within this model.
VIII.4 - Heisenberg Model with
VIII.4.1 Introduction
It is well known that low-dimensional Heisenberg antiferromagnets exhibit a that has a broad maximum due to the increasing dynamic short-range AFM correlations on cooling below the temperature of the maximum, in conjunction with the suppression of long-range AFM order due to quantum fluctuations associated with the low spin-lattice dimensionality.Johnston1997 In view of the inelastic neutron scattering results that demonstrated the occurrence of dynamic stripe-type AFM correlations in ,Jayasekara2013 we consider in this section a description of our data in Fig. 11, which show a broad maximum, in terms of the - Heisenberg model for the two-dimensional (2D) spin-1/2 square lattice. Due to the Mermin-Wagner theorem,Mermin1966 a 2D Heisenberg spin lattice cannot exhibit static long-range AFM order at finite . This result is due to fluctuation affects associated with the low dimensionality of the spin lattice. However, even weak interlayer coupling can induce long-range AFM order, but usually at a temperature significantly below the temperature of the broad peak in .Johnston2011
The - Heisenberg model with spins on a square lattice is well studied. The Hamiltonian in zero field is
| (31) |
where the first sum is over nearest-neighbor spin pairs along the legs of the square lattice and the second sum is over next-nearest-neighbor spin pairs along the diagonals of the squares, where positive and correspond to AFM interactions and negative ones to FM interactions. A stripe-type AFM phase as observed in the LaFeAsO and compounds occurs classically for and where can be either positive (AFM) or negative (FM).Johnston2010 Early in the Fe-based high- superconductivity field, this (effective) frustration model was used to explain the stripe-type AFM ordering observed in the 1111-type and 122-type iron arsenides in both the itinerantYildirim2008 and local momentSi2008 descriptions of the magnetism. The same stripe-type AFM ordering is predicted from band theory without reference to exchange interactions.Mazin2008 ; Dong2008
Our recent inelastic neutron scattering measurements on indicate the presence of stripe-type AFM correlations with and ,Jayasekara2013 which is consistent with the above classical constraints for stripe-type AFM correlations, and further indicated that the correlations are quasi-two-dimensional. We therefore proceed to analyze our data for in terms of the frustrated 2D - spin-1/2 Heisenberg square lattice model.
VIII.4.2 Determining and from Data
In order to estimate the values of the exchange constants and , one can fit by the high- series expansion (HTSE) for the spin susceptibility of this model which is given for and byRosner2003
| (32) |
where is the number of spins and a table of the values is given in Ref. Rosner2003, . For a given value of , we converted the sum over into a Padé approximant with , which is a ratio of two fourth-order polynomials in (), where the coefficients of the two polynomials are solved for exactly in terms of the original HTSE coefficients, which in turn results in an expression for the susceptibility. The Padé approximant reformulation of the HTSE prediction for decreases the minimum temperature at which the HTSE can be used to fit experimental data.
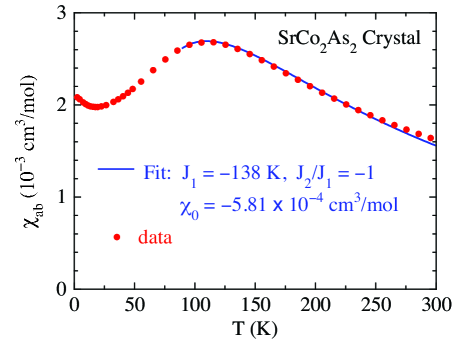
We fitted our data by
| (33) |
A fit of the experimental data in Fig. 11 by Eq. (33) for and was obtained, as dictated by the inelastic neutron scattering measurements,Jayasekara2013 and we also fixed . The fit is shown in Fig. 14, where the fitting parameters and are given in the figure. The high-temperature series and Padé approximant derived from it are not expected to be valid to temperatures much below the temperature of the broad maximum, so we cut off the fit as shown. The value of is perhaps too negative to be physical, which suggests that the model may not include all relevant exchange couplings.
VIII.4.3 Extended 3D -- Spin Heisenberg Model
The above fit of by the - model ignores the magnetic coupling between adjacent stacked Co square lattice layers along the -axis. To include this coupling, we utilize the above intralayer in Eq. (33) as determined from Eq. (32), but augment the - Heisenberg square lattice model by adding a nearest-neighbor -axis Heisenberg coupling between the stacked square lattices using molecular field theory (MFT) as follows, where we utilize the fact that all Co spins are identical and crystallographically equivalent in .
The time- and space-average magnetic moment component in the direction of the applied field is
| (34a) | |||
| where is the exchange field seen by due to the two moments in the two adjacent layers along the -axis. In MFT, one writes | |||
| (34b) | |||
| where is the MFT coupling constant of to the two moments in adjacent layers along the -axis. Substituting Eq. (34b) into (34a) and solving for gives | |||
| (34c) | |||
| so the spin susceptibility per spin is | |||
| (34d) | |||
| and for spins one then obtains | |||
| (34e) | |||
| Taking the reciprocal of each side of this equation gives | |||
| (34f) | |||
Thus the MFT coupling parameter just shifts the entire inverse susceptibility versus curve vertically by an amount , and therefore does not change the temperature of the maximum in at about 115 K in Fig. 14.
Now we express in terms of an exchange constant between a spin and a nearest-neighbor spin in an adjacent layer. The part of the Heisenberg Hamiltonian associated with the interaction of spin Si with the two nearest-neighbor spins Sj in adjacent layers is
| (35) |
where the factor of 1/2 arises because the exchange energy is equally shared by each spin within a pair of interacting spins. The magnetic moment and spin S vectors are related by , where the minus sign arises from the negative sign of the charge on the electron. In MFT, one writes the time- and space-average of the energy per spin in the PM state as
| (36) |
where the factor of 1/2 on the right-hand side arises because when calculating the exchange field, all of the interaction energy between moments and is assigned to the neighbor of . Then, recognizing that the average moments satisfy in the PM state, the exchange field associated with the -axis interactions is found from Eq. (36) to be
| (37) |
Comparing Eqs. (37) and (34b) gives in terms of as
| (38) |
Substituting Eq. (38) into (34e) gives
| (39) |
From Eq. (39), an AFM (positive) suppresses the susceptibility, whereas a FM (negative) enhances it, as expected. Our inelastic neutron scattering results indicated an AFM Co-Co interlayer interaction in .Jayasekara2013 Therefore the anomalously negative value of derived in the previous section that suppresses probably arises at least in part from the presence of the -axis AFM Co-Co interactions that are neglected in the - model. Using Eq. (39), in order to produce the same effect on at its maximum as (Fig. 14) would require K, which according to our inelastic neutron scattering data (Ref. Jayasekara2013, ) is much too large compared to K and should therefore be considered an upper limit. We conclude that within the present model, a significant diamagnetic value as well as a significant AFM -axis coupling are present.
Finally, we add a caveat that our analyses of the magnetic properties of AFM indicate that the magnetism is itinerant,Anand2013 whereas the above analyses of for were carried out within a local-moment picture.
IX NMR Spectroscopy
Figure 15 shows field-swept 75As-NMR spectra of SrCo2As2 at = 4.2 K for two magnetic field directions of -axis and -plane. The spectra exhibit features typical of a nuclear spin with Zeeman and quadrupolar interactions, which result in a sharp central transition and two satellite peaks split by the quadrupolar interaction of the 75As nucleus with the local electric field gradient (EFG). The principle axis of the EFG at the As site in tetragonal SrCo2As2 is found to be along the crystal axis as for members of the family that have tetragonal symmetry,Kitagawa2009 ; Kitagawa2008 ; Baek2008 ; Ning2009 ; Urbano2010 since in our CoAs-based compound and in the tetragonal FeAs-based materials the As site has a local fourfold rotational symmetry about the axis. The spectra for SrCo2As2 for both directions did not show any obvious magnetic broadenings at any temperature between 1.6 and 275 K, which indicates that static magnetic ordering does not occur in this compound above 1.6 K.
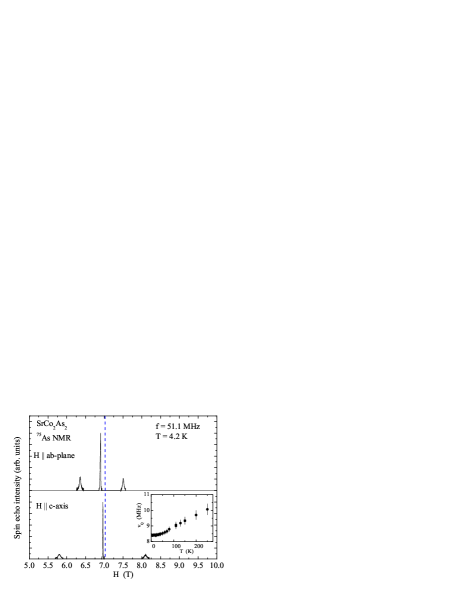
The inset of Fig. 15 shows the temperature dependence of the nuclear quadrupole frequency where is the electric quadrupole moment of the 75As nucleus, is the principal-axis EFG at the As site and is Planck’s constant. arises from hybridization between the As-4 and Co-3 orbitals with an additional contribution from the noncubic part of the spatial distribution of surrounding ions. The decreases by about 15% on cooling, from 10 MHz at 250 K to 8.45 MHz at 1.6 K. A decrease of by % on lowering from 280 to 140 K was also observed in BaFe2As2 (Ref. Kitagawa2009, ) where is much smaller in BaFe2As2 than in SrCo2As2. These behaviors sharply contrast with that observed for SrFe2As2 where increases from 2.0 MHz at 300 K to 2.6 MHz at K.Kitagawa2009
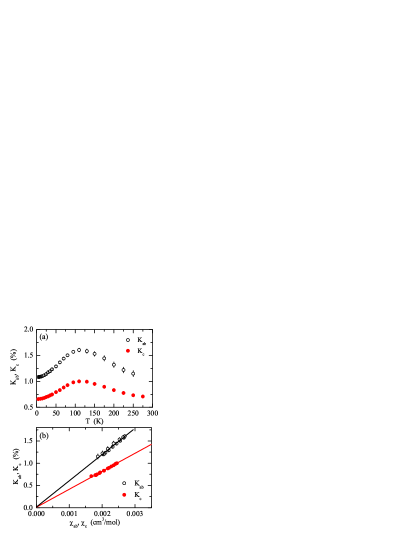
Figure 16(a) shows the dependences of the NMR shifts and for parallel to the plane and parallel to the axis, respectively, where the second-order quadrupole shift was corrected for in . As decreases below room temperature, both and increase and show broad maxima at the about the same temperature of K, similar to the behavior in Fig. 11, and then decrease monotonically at lower without showing upturns. The small upturns in observed at low in Fig. 11 are therefore not intrinsic and evidently arise from a small amount of a PM impurity that is not saturable in fields up to 5.5 T (see Fig. 10).
Figure 16(b) shows and from Fig. 16(a) versus and from Fig. 11, respectively, with as an implicit parameter, for K to avoid the extrinsic low-temperature upturns in . Both and vary linearly with the corresponding and, from the respective slopes, the hyperfine coupling constants are estimated to be kOe/ and kOe/, respectively. These values are much larger than kOe/ and = 20.4 kOe/ for SrFe2As2, respectively.Kitagawa2009 Since the hyperfine coupling is mainly due to hybridization between the and orbitals of the As atoms with the orbitals of the Co atoms, the large hyperfine couplings indicate a strong hybridization between these orbitals. This is consistent with the large for 75As in SrCo2As2 because the is also affected by the strength of the hybridization between the As- and Co- orbitals. The -intercepts of the respective linear fits of versus in Fig. 16(b) are nearly zero. This indicates that the NMR shifts originate mainly from the spin susceptibility with almost negligible net contribution from the orbital (chemical) paramagnetic Van Vleck and diamagnetic conduction electron Landau susceptibilities. Therefore, we identify the measured NMR shifts as Knight shifts.
The 75As nuclear spin-lattice relaxation rate 1/ at each is determined by fitting the nuclear magnetization versus time dependence of the central line after saturation using the double-exponential function ) as expected for the central line of the spectrum of the 75As () nucleus, where and are the nuclear magnetization at time after saturation and the equilibrium nuclear magnetization at , respectively. Figure 17(a) shows versus for magnetic fields parallel and perpendicular to the axis. Both 1/ measurements show very similar dependences which consist of a weak -dependence at high temperatures above K followed by a monotonic decrease at lower .
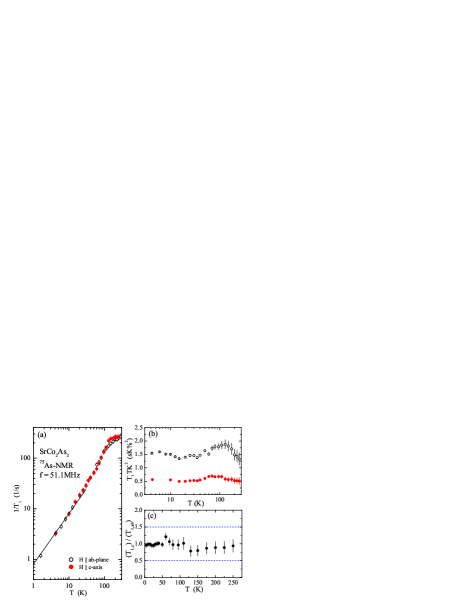
Within a Fermi liquid picture, 1/ is proportional to the square of the density of states at the Fermi energy ). On the other hand, the Knight shift is proportional to the Pauli spin susceptibility ). By looking at the behavior of versus , one can therefore test the applicability of the Fermi liquid theory to our system which predicts the Korringa relation = const. As shown in Fig. 17(b), for both directions are indeed nearly independent of for . This means that the conduction carriers form a Fermi liquid. The dependence of observed below 38 K in the inset of Fig. 4 above is another indication of Fermi liquid behavior.
Next, we discuss the relationship between the anisotropy of our data and the anisotropy of the Co spin fluctuations. Here we follow the same procedure previously performed on Fe pnictides.Kitagawa2009 ; Kitagawa2010 ; Hirano2012 In general, can be described in terms of the fluctuating hyperfine field perpendicular to the applied magnetic field at the NMR angular frequency according to
where the direction corresponds to the external field direction and denotes the q-dependent power spectral density at of a time-dependent random variable .
Defining the hyperfine coupling tensor as , the hyperfine fields at the As site can be described as the sum of contributions from the four nearest-neighbor Co spins asKitagawa2008 ; Hirano2012
| (41) |
where
| (45) |
Here is described in orthorhombic axis (stacked Co square-lattice) notation for consistency with the previous discussion on Fe pnictides.Kitagawa2008 We consider the cases where (), ( = 1,2) and in are, respectively, the diagonal components along the direction with q = (0,0), the off-diagonal components related to stripe AFM correlations with or ), and the off-diagonal components associated with Néel-type spin correlations with . Kitagawa2010 Defining the amplitude of the spin fluctuation spectral density as , using the above equations and writing and appropriate to the tetragonal symmetry of , the ratio
| (46) |
is obtained asHirano2012
| (47a) | |||||
| (47b) | |||||
| (47c) |
As plotted in Fig. 17(c), is almost constant versus with a value . From our inelastic neutron scattering measurements, the dominant AFM fluctuations/correlations are stripe-type with or in Co square-lattice notation.Jayasekara2013 According to Eq. (47b), the value observed in Fig. 17(c) then arises from anisotropic spin fluctuations with . This means that stripe-type AFM Co spin fluctuations along the -axis are stronger than in the plane. An anisotropy in spin fluctuations is also observed in various Fe-based superconductors in the paramagnetic state near , but is always larger than ,Kitagawa2009 ; Nakai2012 in contrast to our result for . Néel-type AFM spin fluctuations with can be ruled out because according to Eq. (47c), that would require in conflict with our measurements in Fig. 17(c) that give .
Our data can also be analyzed with Eq. (47a) solely in terms of FM spin fluctuations with . Using the ratio of the hyperfine fields = 45.0/65.9 = 0.653 determined from the - plot in Fig. 16(b), can be reproduced with anisotropic spin fluctuations with . Interestingly, this analysis also gives the same nature of the anisotropy of the spin fluctuations as discussed above for stripe-type AFM fluctuations. Therefore one cannot uniquely determine the nature of the spin fluctuations utilizing NMR data alone. The q-dependent static susceptibility obtained from electronic structure calculations showed a peak at as well as at and ,Jayasekara2013 so spin fluctuations may well occur with peaks at both the FM and stripe-type AFM wave vectors.
From our NMR data on SrCo2As2 crystals we conclude that the conduction carriers form a Fermi liquid that exhibits significant FM and/or AFM spin fluctuations. The presence of strong AFM spin fluctuations at low temperatures has been specifically demonstrated from our inelastic neutron scattering measurements of single crystals,Jayasekara2013 and FM correlations from the strongly-enhanced discussed above in Sec. VIII.1.
X Single-Crystal Neutron Diffraction
The above thermal expansion, , , and NMR measurements showed no evidence for any phase transitions from 1.3 to 300 K in SrCo2As2. This result is consistent with the neutron scattering measurements on SrCo2As2 crystalsJayasekara2013 that showed no evidence for long-range AFM order at the propagation vector of the stripe-type AFM order foundJohnston2010 in the 122-type iron arsenides. However, the inelastic neutron scattering measurements did show strong dynamic AFM correlations in SrCo2As2 at this propagation vector.Jayasekara2013 On the other hand, neutron diffraction measurements on CaCo2As2 confirmed the presence of A-type long-range AFM order characterized by magnetic Bragg peaks at reciprocal lattice points () with [e.g. (2 0 1) and (2 0 3)] with an upper limit of 0.6 /Co for the ordered moment.Anand2013
To complement the above null result for the occurrence of long-range stripe-type AFM ordering in SrCo2As2, here we searched for evidence of A-typeAnand2013 or G-typeSinghY2009 long-range AFM order in a SrCo2As2 crystal using single-crystal neutron diffraction at the base temperature of K and did not find any such evidence. Figure 18 shows scans through both nuclear [Figs. 18(a) and (b)] and A-type AFM [Figs. 18(c) and (d)] Bragg peak positions. There is no evidence of scattering above background at the latter positions. Note the factor of finer scale of the ordinates for the potential AFM peak positions in Figs. 18(c,d) compared to those of the nuclear reflections in Figs. 18(a,b). The small increase in scattering with decreasing angle in Fig. 18(c) is likely due to some degree of preferred orientation in the Al sample can since the scattering angle is close to that for the Al (2 0 0) powder line. Measurements to check for G-type long-range AFM order are complicated by the fact that the AFM Bragg reflections are coincident with nuclear Bragg peaks. However, we found no evidence of enhanced scattering at the (1 0 1) position of the strongest G-type AFM reflection (not shown).
XI Ground State of
Our x-ray and neutron diffraction, , , , and NMR measurements reveal no evidence for any phase transitions in from 300 K down to 1.3 K. On the other hand, the temperature K at which the broad maximum in occurs, the Weiss temperature K in the Curie-Weiss law fits from 200 to 300 K in Table 3, the large values of K in Fig. 14 obtained by fitting the data by the - model, and the observation of strong stripe-type AFM spin correlations in neutron scattering measurementsJayasekara2013 demonstrate that AFM spin correlations are present and are strong. However, long-range AFM order is not observed above 1.3 K. A measure of the ratio of the energy scale of the AFM spin correlations to the long-range AFM transition temperature K is therefore
| (48) |
In insulating local-moment systems, is called the frustration parameter.Ramirez1994 In such systems in which frustration prevents long-range AFM ordering, a ratio and the absence of static magnetic ordering of any kind occurring in the accessible temperature range point towards a quantum spin-liquid (QSL) ground state, in which quantum fluctuations prevent static long-range magnetic ordering from occurring. Thus to establish a probable quantum spin-liquid ground stateBalents2010 one needs to demonstrate (1) the presence of spin interactions and have a measure of its strength such as , which establishes the presence of a spin liquid instead of a spin gas, (2) that static magnetic ordering does not occur in the accessible temperature range, (3) that a relation such as Eq. (48) is satisfied, and (4) that the lattice symmetry is not broken by the putative QSL ground state. An extensively studied example of an insulator containing Cu+2 spins-1/2 that satisfies these conditions is (or with deuterium replacing H), which is called herbertsmithite.Helton2007 ; Olariu2008 ; deVries2009 ; Han2012 ; Yan2011
The concept of a QSL ground state has been applied in the past to insulating spin local-moment systems.Balents2010 However, some itinerant spin systems such as the iron pnictides and chalcogenides and related materials are moderately correlated electron systems and sometimes have both itinerant and local-moment characteristics.Johnston2010 ; Dai2012 ; Dagotto2013 ; Pandey2012 ; Lamsal2013 In such cases we suggest that one may be able to apply the same four criteria above with respect to a possible QSL ground state. In particular, since we have demonstrated that the above four conditions are satisfied for metallic , we suggest that this compound has a quantum spin-liquid ground state. An alternative and very rare ground state for metallic strongly-correlated frustrated -electron systems is a heavy-fermion ground state as observed in the cubic spinel-structure metallic compound .Kondo1997 ; Johnston2000 ; Lee2001 This compound shows local-moment Curie-Weiss behavior at high and crosses over to the heavy-fermion ground state below about 10 K.
XII Summary and Conclusions
A comprehensive study of the crystallographic, electronic, magnetic and thermal properties of SrCo2As2 single crystals is reported. The room-temperature crystal structure was confirmed to be the body-centered tetragonal -type () structure with an As–As interlayer distance intermediate between the uncollapsed- and collapsed-tetragonal values in BaCo2As2 and CaCo2As2, respectively. No phase transitions of any kind were detected between 1.3 and 300 K in any of our measurements, in spite of the strong negative thermal expansion of the axis from 7.4 to 300 K and the negative volume expansion from 7.4 to K. The -axis thermal expansion is normal (positive) from 7.4 to 300 K. Furthermore, we determined from neutron diffraction measurements on a single crystal that long-range AFM order is not present at 3 K for either A-type or G-type ordering, which complements our previous determination that such ordering also does not occur at the propagation vector for stripe-type AFM ordering.Jayasekara2013
The and ARPES measurements and the LDA band structure calculations consistently demonstrate that SrCo2As2 is metallic with electron Fermi surfaces centered at (0,0) and on the edges of the first Brillouin zone (BZ) at and . An anomalous flat band with character is also present in the second BZ that extends over a large fraction of the zone and results in a sharp and high peak in the electronic density of states . This feature may be responsible for some of the anomalous properties we observe such as the negative thermal expansion and perhaps some of the -dependent magnetic properties. The and NMR data also exhibit metallic Fermi liquid character via the presence of a Sommerfeld electronic contribution and a Korringa contribution, respectively. A comparison of the measured and band structure values of indicates a value of the combined many-body electron-phonon and electron-electron density of states enhancements of %.
The data show a Curie-Weiss-like dependence above 200 K with a large negative (AFM) Weiss temperature K indicative of dominant AFM correlations in the system, consistent with our inelastic neutron scattering measurements that demonstrated the presence of strong stripe-type AFM fluctuationsJayasekara2013 that occur at the same wave vector as in the high- parent compounds.Johnston2010 ; Lumsden2010 However, our ARPES measurements and band structure calculations for SrCo2As2 show no obvious Fermi surface nesting occurring at this wave vector, in contrast to the clear nesting at this wave vector in the semimetallic compounds.Johnston2010 The anisotropy of determined from our NMR measurements is consistent with either stripe-type AFM spin correlations or FM spin correlations or a combination of these. At low temperatures, the data for the two field directions show an upturn, but our NMR Knight shift measurements of the spin susceptibility show that these upturns are not intrinsic.
We modeled our data at high by a Curie-Weiss law and obtained values for the Curie constant and for the Weiss temperature K, which is strongly antiferromagnetic. We also modeled the data, including the broad maximum at 115 K, using a local-moment interconfigurational fluctuation model between a ground state level with spin and an excited triplet state with , and obtained good fits to the powder-averaged data. We further modeled the data in terms of the - frustrated local-moment spin-1/2 square lattice Heisenberg model. For the latter model, a good fit to the data was obtained for a FM (negative) , AFM and , as suggested by the inelastic neutron scattering results,Jayasekara2013 with K.
The for SrCo2As2 has a large magnitude, roughly a factor of 3–5 larger than those of the compounds in the paramagnetic state.Johnston2010 Within an itinerant magnetism picture, this suggests an even larger Stoner enhancement than in the FeAs-based compounds.Johnston2010 Moreover, the Wilson ratio for SrCo2As2 is and the Stoner criterion indicates that this compound should be an itinerant ferromagnet. A similar situation occurs in BaCo2As2, where it was suggested that strong quantum fluctuations occur due to proximity to a quantum critical point that suppress long-range FM order.Sefat2009
Thus, in SrCo2As2, both FM and stripe-type AFM fluctuations/correlations appear to coexist, as also indicated by static calculations that show peaks at both wave vectors.Jayasekara2013 This competition, the formal intermediate valence of the Co ions and the resultant quantum fluctuations may suppress the occurrence of any type of static long-range magnetic order in this compound. As discussed in Sec. XI, we suggest that metallic SrCo2As2 has a gapless quantum spin-liquid (QSL) ground state. It will be very interesting to study in detail the spin excitation spectrum of this compound and compare it with those of insulating local-moment systems that are the traditional candidates for QSL ground states.
The FeAs-based and cuprate high- superconductors have a common phenomenology in which long-range AFM order of the parent compounds must be largely suppressed before superconductivity appears, but where strong AFM fluctuations must still be present to act as the superconducting glue. Even though we have demonstrated that these two conditions are met in undoped SrCo2As2, this compound is not superconducting above 1.8 K. Key open questions are therefore why superconductivity does not occur in SrCo2As2, what the role of the FM correlations is, and whether chemical substitutions of some type or applied pressure can induce superconductivity, perhaps even at high temperatures.
Acknowledgements.
We thank V. K. Anand for numerous helpful discussions and A. Bostwick and E. Rotenberg for excellent support at the Advanced Light Source. V.O. thanks the Ames Laboratory–USDOE for providing the opportunity to be a visiting scientist at the Laboratory and also thanks the Russian Foundation for Basic Research (No. 12-02-31814) for support. The research at Ames Laboratory was supported by the U.S. Department of Energy, Office of Basic Energy Sciences, Division of Materials Sciences and Engineering. Ames Laboratory is operated for the U.S. Department of Energy by Iowa State University under Contract No. DE-AC02-07CH11358. Use of the National Synchrotron Light Source, Brookhaven National Laboratory, was supported by the U.S. Department of Energy, Office of Basic Energy Sciences, under contract No. DE-AC02-98CH10886. The Advanced Light Source is supported by the Director, Office of Science, Office of Basic Energy Sciences, U.S. Department of Energy under Contract No. DE-AC02-05CH11231.References
- (1) Y. Kamihara, T. Watanabe, M. Hirano, and H. Hosono, J. Am. Chem. Soc. 130, 3296 (2008).
- (2) C. Wang, L. Li, S. Chi, Z. Zhu, Z. Ren, Y. Li, Y. Wang, X. Lin, Y. Luo, S. Jiang, X. Xu, G. Cao, and Z. Xu, Europhys. Lett. 83, 67006 (2008).
- (3) D. C. Johnston, Adv. Phys. 59, 803 (2010).
- (4) J. Paglione and R. L. Greene, Nature Phys. 6, 645 (2010).
- (5) G. R. Stewart, Rev. Mod. Phys. 83, 1589 (2011).
- (6) J. G. Bednorz and K. A. Müller, Z. Phys. B 64, 189 (1986).
- (7) D. C. Johnston, in Handbook of Magnetic Materials, Vol. 10, edited by K. H. J. Buschow, Ch. 1 (Elsevier, Amsterdam, 1997), pp. 1–237.
- (8) M. A. Kastner, R. J. Birgeneau, G. Shirane, and Y. Endoh, Rev. Mod. Phys. 70, 897 (1998).
- (9) P. C. Canfield and S. L. Bud’ko, Annu. Rev. Condens. Matter Phys. 1, 27 (2010).
- (10) M. D. Lumsden and A. D. Christianson, J. Phys.: Condens. Matter 22, 203203 (2010).
- (11) I. I. Mazin, D. J. Singh, M. D. Johannes, and M. H. Du, Phys. Rev. Lett. 101, 057003 (2008).
- (12) J. Dong, H. J. Zhang, G. Xu, Z. Li, G. Li, W. Z. Hu, D. Wu, G. F. Chen, X. Dai, J. L. Luo, Z. Fang, and N. L. Wang, Europhys. Lett. 83, 27006 (2008).
- (13) I. I. Mazin and J. Schmalian, Physica C 469, 614 (2009).
- (14) R. M. Fernandes, D. K. Pratt, W. Tian, J. Zarestky, A. Kreyssig, S. Nandi, M. G. Kim, A. Thaler, N. Ni, P. C. Canfield, R. J. McQueeney, J. Schmalian, and A. I. Goldman, Phys. Rev. B 81, 140501(R) (2010).
- (15) D. N. Basov and A. V. Chubukov, Nature Phys. 7, 272 (2011).
- (16) M. Rotter, M. Tegel, and D. Johrendt, Phys. Rev. Lett. 101, 107006 (2008).
- (17) A. S. Sefat, R. Jin, M. A. McGuire, B. C. Sales, D. J. Singh, and D. Mandrus, Phys. Rev. Lett. 101, 117004 (2008).
- (18) A. Leithe-Jasper, W. Schnelle, C. Geibel, and H. Rosner, Phys. Rev. Lett. 101, 207004 (2008).
- (19) S. Nandi, M. G. Kim, A. Kreyssig, R. M. Fernandes, D. K. Pratt, A. Thaler, N. Ni, S. L. Bud’ko, P. C. Canfield, J. Schmalian, R. J. McQueeney, and A. I. Goldman, Phys. Rev. Lett. 104, 057006 (2010).
- (20) S. Jiang, H. Xing, G. Xuan, C. Wang, Z. Ren, C. Feng, J. Dai, Z. Xu, and G. Cao, J. Phys.: Condens. Matter 21, 382203 (2009).
- (21) K. Matan, R. Morinaga, K. Iida, and T. J. Sato, Phys. Rev. B 79, 054526 (2009).
- (22) T. J. Sato, K. Matan, S. Ibuka, R. Morinaga, S. Chi, J. W. Lynn, A. D. Christianson, and M. D. Lumsden, Phys. Rev. B 83, 059901(E) (2011).
- (23) W. Jayasekara, Y. Lee, A. Pandey, G. S. Tucker, A. Sapkota, J. Lamsal, S. Calder, D. A. Abernathy, B. N. Harmon, A. Kreyssig, D. Vaknin, D. C. Johnston, A. I. Goldman, and R. J. McQueeney, arXiv:1306.5174.
- (24) A. S. Sefat, D. J. Singh, R. Jin, M. A. McGuire, B. C. Sales, and D. Mandrus, Phys. Rev. B 79, 024512 (2009).
- (25) B. Cheng, B. F. Hu, R. H. Yuan, T. Dong, A. F. Fang, Z. G. Chen, G. Xu, Y. G. Shi, P. Zheng, J. L. Luo, and N. L. Wang, Phys. Rev. B 85, 144426 (2012).
- (26) J. J. Ying, Y. J. Yan, A. F. Wang, Z. J. Xiang, P. Cheng, G. J. Ye, and X. H. Chen, Phys. Rev. B 85, 214414 (2012).
- (27) V. K. Anand, R. S. Dhaka, D. G. Quirinale, B. G. Kim, Y. Lee, B. N. Harmon, P. W. Stephens, T. W. Heitmann, A. Kreyssig, R. J. McQueeney, A. I. Goldman, A. Kaminski, and D. C. Johnston, (unpublished).
- (28) M. Pfisterer and G. Nagorsen, Z. Naturforsch. 35b, 703 (1980); 38b, 811 (1983).
- (29) V. K. Anand, P. K. Perera, A. Pandey, R. J. Goetsch, A. Kreyssig, and D. C. Johnston, Phys. Rev. B 85, 214523 (2012).
- (30) B. Cordero, V. Gómez, A. E. Platero-Prats, M. Revés, J. Echeverría, E. Cremades, F. Barragán, and S. Alvarez, Dalton Trans. 2008, 2832 (2008).
- (31) A. Kreyssig, M. A. Green, Y. Lee, G. D. Samolyuk, P. Zajdel, J. W. Lynn, S. L. Bud’ko, M. S. Torikachvili, N. Ni, S. Nandi, J. B. Leão, S. J. Poulton, D. N. Argyriou, B. N. Harmon, R. J. McQueeney, P. C. Canfield, and A. I. Goldman, Phys. Rev. B 78, 184517 (2008).
- (32) A. I. Goldman, A. Kreyssig, K. Prokes̆, D. K. Pratt, D. N. Argyriou, J. W. Lynn, S. Nandi, S. A. J. Kimber, Y. Chen, Y. B. Lee, G. Samolyuk, J.B. Leão, S. J. Poulton, S. L. Bud’ko, N. Ni, P. C. Canfield, B. N. Harmon, and R. J. McQueeney, Phys. Rev. B 79, 024513 (2009).
- (33) D. K. Pratt, Y. Zhao, S. A. J. Kimber, A. Hiess, D. N. Argyriou, C. Broholm, A. Kreyssig, S. Nandi, S. L. Bud’ko, N. Ni, P. C. Canfield, R. J. McQueeney, and A. I. Goldman, Phys. Rev. B 79, 060510(R) (2009).
- (34) R. Hu, S. L. Bud’ko, W. E. Straszheim, and P. C. Canfield, Phys. Rev. B 83, 094520 (2011).
- (35) J. Zhao, D.-X. Yao, S. Li, T. Hong, Y. Chen, S. Chang, W. Ratcliff II, J. W. Lynn, H. A. Mook, G. F. Chen, J. L. Luo, N. L. Wang, E. W. Carlson, J. Hu, and P. Dai, Phys. Rev. Lett. 101, 167203 (2008).
- (36) R. A. Ewings, T. G. Perring, J. Gillett, S. D. Das, S. E. Sebastian, A. E. Taylor, T. Guidi, and A. T. Boothroyd, Phys. Rev. B 83, 214519 (2011).
- (37) N. Ni, S. L. Bud’ko, A. Kreyssig, S. Nandi, G. E. Rustan, A. I. Goldman, S. Gupta, J. D. Corbett, A. Kracher, and P. C. Canfield, Phys. Rev. B 78, 014507 (2008).
- (38) X. F. Wang, T. Wu, G. Wu, H. Chen, Y. L. Xie, J. J. Ying, Y. J. Yan, R. H. Liu, and X. H. Chen, Phys. Rev. Lett. 102, 117005 (2009).
- (39) J. Rodríguez-Carvajal, Physica B 192, 55 (1993); see also www.ill.eu/sites/fullprof/
- (40) A. C. Larson and R. B. Von Dreele, Tech. Rep. LAUR 86-748, Los Alamos National Laboratory (2004).
- (41) Y. Singh, M. A. Green, Q. Huang, A. Kreyssig, R. J. McQueeney, D. C. Johnston, and A. I. Goldman, Phys. Rev. B 80, 100403(R) (2009).
- (42) P. Blaha, K. Schwarz, G.K.H. Madsen, D. Kvasnick, and J. Luitz, WIEN2k, An Augmented Plane Wave + Local Orbitals Program for Calculation Crystal Properties (K. Schwarz, TU Wien, Austria, 2001) ISBN 3-9501031-1-2.
- (43) J. P. Perdew and Y. Wang, Phys. Rev. B 45, 13244 (1992).
- (44) S. L. Bud’ko, N. Ni, and P. C. Canfield, Phil. Mag. 90, 1219 (2010).
- (45) S. L. Bud’ko, N. Ni, S. Nandi, G. M. Schmiedeshoff, and P. C. Canfield, Phys. Rev. B 79, 054525 (2009).
- (46) A. Rebello, J. J. Neumeier, Z. Gao, Y. Qi, and Y. Ma, Phys. Rev. B 86, 104303 (2012).
- (47) G. R. Stewart, Rev. Mod. Phys. 73, 797 (2001).
- (48) R. J. Goetsch, V. K. Anand, A. Pandey, and D. C. Johnston, Phys. Rev. B 85, 054517 (2012).
- (49) F. J. Blatt, Physics of Electronic Conduction in Solids (McGraw-Hill, New York, 1968).
- (50) N. F. Mott, Proc. Roy. Soc. London A 153, 699 (1936).
- (51) M. Giovannini, H. Michor, E. Bauer, G. Hilscher, and P. Rogl, J. Alloys Compd. 280, 26 (1998).
- (52) D. J. Singh, Phys. Rev. B 79, 174520 (2009).
- (53) T. Kondo, R. M. Fernandes, R. Khasanov, C. Liu, A. D. Palczewski, N. Ni, M. Shi, A. Bostwick, E. Rotenberg, J. Schmalian, S. L. Bud’ko, P. C. Canfield, and A. Kaminski, Phys. Rev. B 81, 060507(R) (2010).
- (54) C. Liu, A. D. Palczewski, R. S. Dhaka, T. Kondo, R. M. Fernandes, E. D. Mun, H. Hodovanets, A. N. Thaler, J. Schmalian, S. L. Bud’ko, P. C. Canfield, and A. Kaminski, Phys. Rev. B 84, 020509(R) (2011).
- (55) R. S. Dhaka, Y. Lee, V. K. Anand, D. C. Johnston, B. N. Harmon, and A. Kaminski, Phys. Rev. B 87, 214516 (2013).
- (56) P. Mohn, Magnetism in the Solid State–An Introduction, (Springer-Verlag, Berlin, 2003).
- (57) F. Ronning, T. Klimczuk, E. D. Bauer, H. Volz, and J. D. Thompson, J. Phys.: Condens. Matter 20, 322201 (2008).
- (58) G. F. Chen, Z. Li, J. Dong, G. Li, W. Z. Hu, X. D. Zhang, X. H. Song, P. Zheng, N. L. Wang, and J. L. Luo, Phys. Rev. B 78, 224512 (2008).
- (59) C. R. Rotundu, B. Freelon, T. R. Forrest, S. D. Wilson, P. N. Valdivia, G. Pinuellas, A. Kim, J.-W. Kim, Z. Islam, E. Bourret-Courchesne, N. E. Phillips, and R. J. Birgeneau, Phys. Rev. B 82, 144525 (2010).
- (60) A. C. Jaco, J. O. Fjærestad, and B. J. Powell, Nature Phys. 5, 422 (2009).
- (61) E. S. R. Gopal, Specific Heats at Low Temperatures (Plenum, New York, 1966).
- (62) F. Hardy, A. E. Böhmer, D. Aoki, P. Burger, T. Wolf, P. Schweiss, R. Heid, P. Adelmann, Y. X. Yao, G. Kotliar, J. Schmalian, and C. Meingast, Phys. Rev. Lett. 111, 027002 (2013).
- (63) The values of quoted for a crystal in the text of Ref. Sefat2009, and plotted in Fig. 1 of Ref. Sefat2009, were and , which are 65% and 40% larger than the values that we obtained from the high-field slopes of the data at 1.8 K in the inset of their Fig. 1, respectively, as quoted in our Eqs. (13). These errors in the quoted values of and in Ref. Sefat2009, are due to the presence of a small amount of ferromagnetic impurity in the crystal that was not accounted for, combined with the small field T that was used to obtain the data in their Fig. 1. Furthermore, the anisotropy obtained from their high-field measurements may be reversed compared that shown in their Fig. 1 obtained at T and in the inset to their Fig. 1 (A. S. Sefat, private communication). In very recent measurements on single crystals [V. K. Anand, D. C. Johnston, et al., (unpublished)], our group finds that the anisotropy of is reversed from that in Fig. 1 of Ref. Sefat2009, and from that in our Eqs. (13) derived from their data. For a discussion of the effects of ferromagnetic impurities on the measured and values of materials see Sec. 3.5.2 of Ref. Johnston2010, . We thank A. S. Sefat for sending us a listing of the data in the inset of Fig. 1 of Ref. Sefat2009, .
- (64) U. Mizutani, Introduction to the Electron Theory of Metals (Cambridge University Press, New York, 2003).
- (65) G. Grimvall, Phys. Scr. 14, 63 (1976).
- (66) D. C. Johnston, Phys. Rev. Lett. 109, 077201 (2012).
- (67) B. C. Sales and D. K. Wohlleben, Phys. Rev. Lett. 35, 1240 (1975).
- (68) W. Franz, F. Steglich, W. Zell, D. Wohlleben, and F. Pobell, Phys. Rev. Lett. 45, 64 (1980).
- (69) J. Chaloupka and G. Khaliullin, Phys. Rev. Lett. 110, 207205 (2013).
- (70) H. Gretarsson, S. R. Saha, T. Drye, J. Paglione, J. Kim, D. Casa, T. Gog, W. Wu, S. R. Julian, and Y.-J. Kim, Phys. Rev. Lett. 110, 047003 (2013).
- (71) N. D. Mermin and H. Wagner, Phys. Rev. Lett. 17, 1133 (1966).
- (72) D. C. Johnston, R. J. McQueeney, B. Lake, A. Honecker, M. E. Zhitomirsky, R. Nath, Y. Furukawa, V. P. Antropov, and Y. Singh, Phys. Rev. B 84, 094445 (2011).
- (73) T. Yildirim, Phys. Rev. Lett. 101, 057010 (2008).
- (74) Q. Si and E. Abrahams, Phys. Rev. Lett. 101, 076401 (2008).
- (75) H. Rosner, R. R. P. Singh, W. H. Zheng, J. Oitmaa, and W. E. Pickett, Phys. Rev. B 67, 014416 (2003).
- (76) K. Kitagawa, N. Katayama, K. Ohgushi, and M. Takigawa, J. Phys. Soc. Jpn. 78, 063706 (2009).
- (77) K. Kitagawa, N. Katayama, K. Ohgushi, M. Yoshida, and M. Takigawa, J. Phys. Soc. Jpn. 77, 114709 (2008).
- (78) S.-H. Baek, N. J. Curro, T. Klimczuk, E. D. Bauer, F. Ronning, and J. D. Thompson, Phys. Rev. B 79, 052504 (2009).
- (79) F. L. Ning, K. Ahilan, T. Imai, A. S. Sefat, R. Jin, M. A. McGuire, B. C. Sales, and D. Mandrus, Phys. Rev. B 79, 140506(R) (2009).
- (80) R. R. Urbano, E. L. Green, W. G. Moulton, A. P. Reyes, P. L. Kuhns, E. M. Bittar, C. Adriano, T. M. Garitezi, L. Bufaiçal, and P. G. Pagliuso, Phys. Rev. Lett. 105, 107001 (2010).
- (81) S. Kitagawa, Y. Nakai, T. Iye, K. Ishida, Y. Kamihara, M. Hirano, and H. Hosono, Phys. Rev. B 81, 212502 (2010).
- (82) M. Hirano, Y. Yamada, T. Saito, R. Nagashima, T. Konishi, T. Toriyama, Y. Ohta, H. Fukazawa, Y. Kohori, Y. Furukawa, K. Kihou, C.-H. Lee, A. Iyo, and H. Eisaki, J. Phys. Soc. Jpn. 81, 054704 (2012).
- (83) Y. Nakai, S. Kitagawa, T. Iye, K. Ishida, Y. Kamihara, M. Hirano, and H. Hosono, Phys. Rev. B 85, 134408 (2012).
- (84) A. P. Ramirez, Annu. Rev. Mater. Sci. 24, 453 (1994).
- (85) L. Balents, Nature 464, 199 (2010).
- (86) J. S. Helton, K. Matan, M. P. Shores, E. A. Nytko, B. M. Bartlett, Y. Yoshida, Y. Takano, A. Suslov, Y. Qiu, J.-H. Chung, D. G. Nocera, and Y. S. Lee, Phys. Rev. Lett. 98, 107204 (2007).
- (87) A. Olariu, P. Mendels, F. Bert, F. Duc, J. C. Trombe, M. A. de Vries, and A. Harrison, Phys. Rev. Lett. 100, 087202 (2008).
- (88) M. A. de Vries, J. R. Stewart, P. P. Deen, J. O. Piatek, G. J. Nilsen, H. M. Rønnow, and A. Harrison, Phys. Rev. Lett. 103, 237201 (2009).
- (89) T.-H. Han, J. S. Helton, S. Chu, D. G. Nocera, J. A. Rodriguez-Rivera, C. Broholm, and Y. S. Lee, Nature 492, 406 (2012).
- (90) S. Yan, D. A. Huse, and S. R. White, Science 332, 1173 (2011).
- (91) P. Dai, J. Hu, and E. Dagotto, Nature Phys. 8, 709 (2012).
- (92) E. Dagotto, Rev. Mod. Phys. 85, 849 (2013).
- (93) A. Pandey, R. S. Dhaka, J. Lamsal, Y. Lee, V. K. Anand, A. Kreyssig, T. W. Heitmann, R. J. McQueeney, A. I. Goldman, B. N. Harmon, A. Kaminski, and D. C. Johnston, Phys. Rev. Lett. 108, 087005 (2012).
- (94) J. Lamsal, G. S. Tucker, T. W. Heitmann, A. Kreyssig, A. Jesche, A. Pandey, W. Tian, R. J. McQueeney, D. C. Johnston, and A. I. Goldman, Phys. Rev. B 87, 144418 (2013).
- (95) S. Kondo, D. C. Johnston, C. A. Swenson, F. Borsa, A. V. Mahajan, L. L. Miller, T. Gu, A. I. Goldman, M. B. Maple, D. A. Gajewski, E. J. Freeman, N. R. Dilley, R. P. Dickey, J. Merrin, K. Kojima, G. M. Luke, Y. J. Uemura, O. Chmaissem, and J. D. Jorgensen, Phys. Rev. Lett. 78, 3729 (1997).
- (96) For a review, see D. C. Johnston, Physica B 281–282, 21 (2000).
- (97) S.-H. Lee, Y. Qiu, C. Broholm, Y. Ueda, and J. J. Rush, Phys. Rev. Lett. 86, 5554 (2001).