Phase Diagrams for the = 1/2 Fractional Quantum Hall Effect in Electron Systems Confined to Symmetric, Wide GaAs Quantum Wells
Abstract
We report an experimental investigation of fractional quantum Hall effect (FQHE) at the even-denominator Landau level filling factor = 1/2 in very high quality wide GaAs quantum wells, and at very high magnetic fields up to 45 T. The quasi-two-dimensional electron systems we study are confined to GaAs quantum wells with widths ranging from 41 to 96 nm and have variable densities in the range of to cm-2. We present several experimental phase diagrams for the stability of the FQHE in these quantum wells. In general, for a given , the 1/2 FQHE is stable in a limited range of intermediate densities where it has a bilayer-like charge distribution; it makes a transition to a compressible phase at low densities and to an insulating phase at high densities. The densities at which the FQHE is stable are larger for narrower quantum wells. Moreover, even a slight charge distribution asymmetry destabilizes the FQHE and turns the electron system into a compressible state. We also present a plot of the symmetric-to-antisymmetric subband separation (), which characterizes the inter-layer tunneling, vs density for various . This plot reveals that at the boundary between the compressible and FQHE phases increases linearly with density for all the samples. There is no theoretical explanation for such a simple dependence. Finally, we summarize the experimental data in a diagram that takes into account the relative strengths of the inter-layer and intra-layer Coulomb interactions and . We conclude that, consistent with the conclusions of some of the previous studies, the FQHE observed in wide GaAs quantum wells with symmetric charge distribution is stabilized by a delicate balance between the inter-layer and intra-layer interactions, and is very likely described by a two-component () state.
I Introduction
The fractional quantum Hall effect (FQHE) Tsui et al. (1982) is predominantly seen in high-quality two-dimensional (2D) electron systems in the lowest () Landau level at odd-denominator fillings Jain (2007). In the first, excited () Landau level, a FQHE exists at the even-denominator filling Willett et al. (1987); Pan et al. (1999). This enigmatic FQHE has become the focus of considerable theoretical and experimental attention, partly because of its potential application in topological quantum computing Nayak et al. (2008). Despite numerous experimental efforts during the past two decades, however, a thorough understanding of its origin remains elusive. In particular, it is yet not known whether or not the spin degree of freedom is necessary to stabilize this state. If yes, then the 5/2 FQHE state could be described by a two-component, Halperin-Laughlin () wavefunction Halperin (1983). But if the 5/2 FQHE is stable in a fully spin-polarized 2D electron system, then it is likely to be the one-component, Moore-Read (Pfaffian) state Moore and Read (1991). The latter is of enormous interest as it is expected to obey non-Abelian statistics and have use in topological quantum computing Nayak et al. (2008).
The possibility of an even-denominator FQHE in the lowest Landau level, e.g. at , has been theoretically discussed in numerous publications Halperin (1983); Rezayi and Haldane (1987); Chakraborty and Pietiläinen (1987); Yoshioka et al. (1989); MacDonald (1990); Moore and Read (1991); He et al. (1991); Greiter et al. (1991); He et al. (1993); Halperin (1994); Nomura and Yoshioka (2004); Papić et al. (2009, 2009); Storni et al. (2010); Peterson and Das Sarma (2010); Peterson et al. (2010). Experimentally, FQHE states at have been seen in electron systems confined to either double Eisenstein et al. (1992), or wide Suen et al. (1992a, b); Suen (1993); Suen et al. (1994); Manoharan et al. (1996); Shayegan et al. (1996); Shayegan (1999); Luhman et al. (2008); Shabani et al. (2009a, b) GaAs quantum well (QW) systems; FQHE was also reported very recently in bilayer graphene system Ki, Fal’ko, and Morpurgo . In wide GaAs QWs, FQHE has also been seen at other even-denominator fillings, namely at Suen et al. (1994) and at Luhman et al. (2008); Shabani et al. (2009a, b). In a double QW with negligible inter-layer tunneling but comparable inter-layer and intra-layer Coulomb interactions, it is generally accepted that the FQHE is stabilized by the additional (layer) degree of freedom, and is described by the two-component, state Rezayi and Haldane (1987); Chakraborty and Pietiläinen (1987); Yoshioka et al. (1989); MacDonald (1990); He et al. (1991, 1993); Halperin (1994); Nomura and Yoshioka (2004); Papić et al. (2009, 2009); Storni et al. (2010); Peterson and Das Sarma (2010); Peterson et al. (2010); in this case the components are the layer indices. However, the situation is more subtle for the case of electrons in a single, wide QW where the electron-electron repulsion lifts the potential energy near the well center and creates an effective barrier Suen et al. (1992a, b); Suen (1993); Suen et al. (1994); Manoharan et al. (1996); Shayegan et al. (1996); Shayegan (1999); Luhman et al. (2008); Shabani et al. (2009a, b); Suen et al. (1991); Lay, Suen, Manoharan, Ying, Santos, and Shayegan . Although the system can have a ”bilayer-like” charge distribution at sufficiently high densities, the inter-layer tunneling, quantified by the symmetric-to-antisymmetric subband separation (), can be substantial. Moreover, in a QW with fixed well-width, the magnitude of can be tuned from small to large values by decreasing the electron density in the QW while keeping the total charge distribution symmetric (”balanced”). When is negligible compared to the intra-layer Coulomb energy () then, similar to the double-QW system, is the likely ground state if a FQHE is observed ( is the magnetic length and is the dielectric constant). If is a significant fraction of , however, then it is likely that the FQHE state is a one-component, Pfaffian state Greiter et al. (1991).
Here we present results of our extensive experimental study of the FQHE in very high quality, wide GaAs QWs with well widths () ranging from 41 to 96 nm and tunable densities () in the range of to cm-2. Our data, taken at low temperatures and very high perpendicular magnetic fields ( up to 45 T) allow us to determine the most comprehensive set of experimental conditions for the stability of the FQHE in symmetric, wide GaAs QWs. We present our data in several experimental phase diagrams, including a vs diagram; is the ratio of the inter-layer distance () and the magnetic length, and is a measure of the relative strengths the intra-layer () and inter-layer () interactions. Our transport data also reveal that, even in the narrowest QWs, making the charge distribution slightly asymmetric (”imbalanced”), the FQHE disappears and is replaced by a compressible state. We conclude that, consistent with the conclusions of previous experimental Suen (1993); Suen et al. (1994); Shabani et al. (2009a) and theoretical He et al. (1993); Storni et al. (2010); Peterson and Das Sarma (2010) studies, the FQHE observed in wide GaAs QWs with symmetric charge distribution is likely a two-component state. Comparing our experimental vs phase diagram to a recently calculated diagram Peterson and Das Sarma (2010), we find that, while there is some overall qualitative agreement, there are also significant quantitative discrepancies.
II Experimental details
Our samples were grown by molecular beam epitaxy and each consists of a GaAs QW bounded on both sides by undoped AlxGa1-xAs barrier layers ( 0.24 to 0.30) and Si -doped layers. The well widths of these samples range from 41 to 96 nm, but the focus of our work is on narrower QWs ( nm) where is large. These narrower QW samples typically have low-temperature mobilities of 250 to 600 m2/Vs and the Al composition in their barriers is 0.24. The wider QW samples used in older studies Suen et al. (1992a, b); Suen (1993); Suen et al. (1994) had mobilities of 100 m2/Vs and their barriers had 0.30. All the samples had a van der Pauw geometry, an approximately 3 mm 3 mm square shape, and were fitted with an evaporated Ti/Au front-gate and a Ga or an In back-gate to change the 2D density while keeping the charge distribution in the well symmetric. We carried out measurements in dilution refrigerators with base temperatures of 30 mK, housed in either a 16 T superconducting magnet, a 35 T resistive magnet, or a 45 T hybrid (resistive plus superconducting) magnet.
Most of the samples used in our study were cut from GaAs wafers which were not rotated during the epitaxial growth. This resulted in a non-uniformity of the growth rate across the wafer surface and an uncertainty in the QW width. To determine the QW width more accurately, we carefully measured and analyzed the low-field Shubnikov-de Haas oscillations in each sample to obtain as a function of . We also performed calculations of the charge distribution and the QW’s potential and energy levels by solving Schroedinger and Poisson’s equations self-consistently (at zero magnetic field) while treating the QW width as an adjustable parameter. We then compared the measured vs data to the calculations using as a fitting parameter. We show examples of these fits in Section V (Fig. 5) where we present the vs data. The values of we quote here are from such fits, and have an estimated absolute accuracy of about 5%, although their relative accuracy is better than about 2%. The quoted also agree with the nominal QW widths based on the epitaxial growth rates to within about 10%.
III GaAs single wide quantum wells
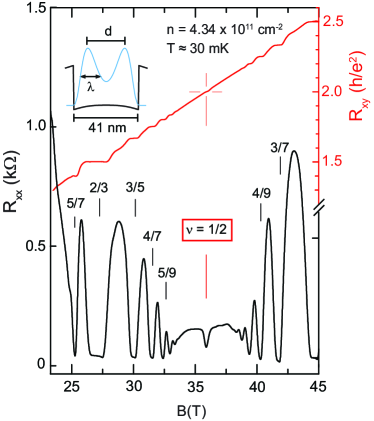
We first briefly describe the electron system confined to a modulation-doped wide QW. When electrons at very low density are placed in a single wide QW, they occupy the lowest electric subband and have a single-layer-like (but rather thick in the growth direction) charge distribution. As more electrons are added to the well while keeping the charge distribution symmetric, their electrostatic repulsion forces them to pile up near the QW boundaries and the electron charge distribution appears increasingly bilayer-like Suen et al. (1992a, b); Suen (1993); Suen et al. (1994); Manoharan et al. (1996); Shayegan et al. (1996); Shayegan (1999); Luhman et al. (2008); Shabani et al. (2009a, b); Suen et al. (1991); Lay, Suen, Manoharan, Ying, Santos, and Shayegan . At high the electrons typically occupy the lowest two, symmetric and antisymmetric electric subbands; these are separated in energy by , which for a bilayer system can be considered as the inter-layer tunneling energy. An example of the potential energy and the charge distribution in such a system is given in Fig. 1 inset where we show the results of our self-consistent calculations for cm-2 electrons symmetrically distributed in a 41-nm-wide QW.
A crucial property of the electron system in a wide QW is that both and (the inter-layer separation, see Fig. 1 inset), which characterize the coupling between the layers, depend on density: Increasing the density makes larger and smaller so that the system can essentially be tuned from a (thick) single-layer-like electron system at low density to a bilayer one by increasing the density Suen et al. (1992a, b); Suen (1993); Suen et al. (1994); Shayegan et al. (1996); Manoharan et al. (1996); Shayegan (1999); Luhman et al. (2008); Shabani et al. (2009a, b); Suen et al. (1991); Lay, Suen, Manoharan, Ying, Santos, and Shayegan . This evolution with density plays a decisive role in the properties of the correlated electron states in the system Suen et al. (1991, 1992a, 1992b); Suen (1993); Suen et al. (1994); Shayegan et al. (1996); Manoharan et al. (1996); Shayegan (1999); Luhman et al. (2008); Shabani et al. (2009a, b); Suen et al. (1991); Lay, Suen, Manoharan, Ying, Santos, and Shayegan . At low densities, when is large, the electron system exhibits odd-denominator FQHE characteristic of a standard, single-layer sample. In particular, at the electron system is compressible and there is no FQHE. At very high densities, it shows an insulating phase near , which likely signals the formation of a bilayer Wigner crystal Manoharan et al. (1996); Shayegan et al. (1996); Shayegan (1999). And eventually, at the highest densities, becomes small and the system is very much bilayer-like; it typically exhibits FQHE at odd-denominator fillings which have , consistent with the presence of two layers in parallel. In the intermediate density regime, on the other hand, a FQHE is seen at in the highest quality samples. This FQHE, and its transition into a compressible state as the density is lowered, are the subjects of our study presented here.
Experimentally, we control both the density and the charge distribution symmetry in our samples via front- and back-side gates, and by measuring the densities of the two occupied electric subbands from Fourier transforms of the low-field Shubnikov-de Haas magnetoresistance oscillations. These Fourier transforms typically exhibit two peaks whose frequencies are directly proportional to the subband densities. By carefully monitoring the evolution of these frequencies as a function of density and, at a fixed density, as a function of the values of the back and front gate biases, we can determine and tune the symmetry of the charge distribution Suen (1993); Suen et al. (1994); Shayegan et al. (1996); Manoharan et al. (1996); Shayegan (1999); Shabani et al. (2009a, b); Suen et al. (1991); Lay, Suen, Manoharan, Ying, Santos, and Shayegan . Note that is directly proportional to the difference between the subband densities and, for a fixed density in the QW, is smallest when the total charge distribution in the QW is symmetric. The data presented here were all taken on wide QWs with symmetric (”balanced”) charge distributions, except in Fig. 4. Also, all the quoted values of are from the measured Shubnikov-de Haas oscillation frequencies.
IV Examples of magnetoresistance data
Figure 1 provides an example of the longitudinal () and Hall () resistance traces at high magnetic fields for a 41-nm-wide QW at a density of cm-2. minima are observed at numerous Landau level fillings such as 2/3, 3/5, 4/7, 5/9, 6/11, 7/13, and 2/5, 3/7, 4/9, 5/11, 6/13, 7/15, attesting to the very high quality of the sample. These odd-denominator FQHE states and their relative strengths resemble those seen in standard, single-layer, 2D electrons confined to high quality GaAs QWs with narrower well widths. Of particular interest here is of course the well-developed FQHE at as evidenced by a deep minimum and a developing plateau at . This FQHE has no counterpart in standard 2D electron systems in narrow QWs. The charge distribution and potential for this QW at cm-2, calculated self-consistently (at ), are also shown in Fig. 1 inset. The charge distribution is bilayer-like, with denoting the inter-layer distance and the full-width-at-half-maximum of the charge distribution in each ”layer”.
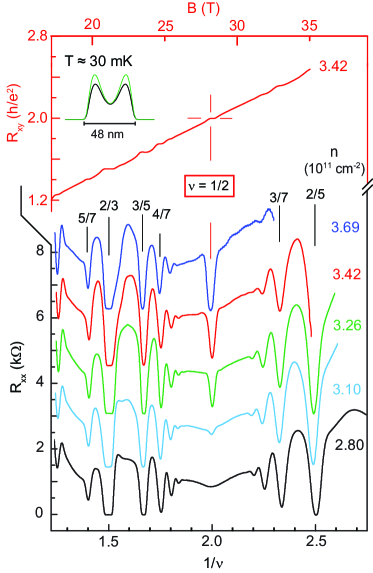
In Fig. 2 we show the density dependence of the traces for a 48-nm-wide QW sample. The bottom -axis used in Fig. 2 is the inverse filling factor in order to normalize the magnetic field for the different densities. At the lowest density (bottom trace) the FQHE states are very similar to those seen in the standard, narrow 2D electron systems; more precisely, they are all at odd-denominator fillings and there is no FQHE at . As the density increases, the traces reveal a clear sharp minimum developing in at = 1/2 which is accompanied by a quantized plateau in at (see the trace in the top part of Fig. 1). In the inset we show the calculated charge distributions for cm-2 (black), when the state at is compressible, and cm-2 (green), when the FQHE is observed. It is clear in Fig. 2 that a very small change in the electron density is sufficient to turn the ground state at from compressible to FQHE.
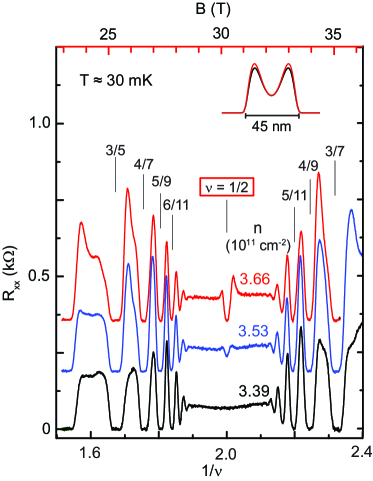
Similar data for a slightly narrower, 45-nm-wide QW are shown in Fig. 3. The data again attest to the very high quality of this sample, as they exhibit high-order FQHE at odd-denominator fillings up to 7/15 and 8/15. The trend for the ground state at is similar to the 48-nm-wide sample of Fig. 2: At the lowest density the state is compressible but as the density is slightly increased a FQHE appears. But note in Fig. 3 that the density for the transition between the compressible and FQHE ground state is somewhat larger for the 45-nm-wide sample compared to the slightly wider QW of Fig. 2.
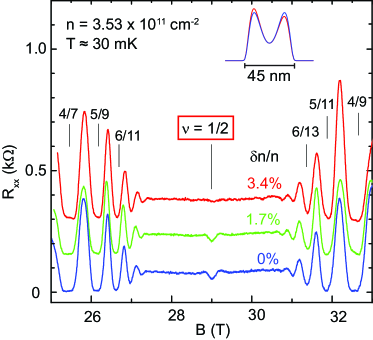
In Fig. 4 we demonstrate the crucial role of electron charge distribution symmetry on the stability of the FQHE.
Here we fix the density in the 45-nm-wide sample at cm-2, and show vs magnetic field measured for different QW charge distribution symmetries. We
change the symmetry by increasing the density by via
applying the front-gate bias and decreasing the density by
via the back-gate bias. The FQHE is strong when the QW is
symmetric (). It becomes weak when and is completely destroyed when . This
evolution is also very similar to what is observed in electron systems confined
to wider GaAs QWs Suen (1993); Suen et al. (1994); Manoharan et al. (1996); Shayegan et al. (1996); Shayegan (1999); Shabani et al. (2009a). It shows that, even in relatively narrow QWs, the FQHE is destabilized by a slight asymmetry in the charge distribution.
V Phase diagrams for the stability of FQHE
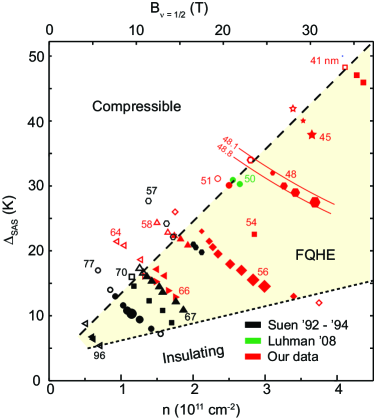
We have made measurements similar to those shown in Figs. 2 and 3 for several samples with different QW widths, and summarize the results in various ”phase diagrams” shown in Figs. 5-7. In all these figures, the charge distribution in the wide QW is symmetric, and the filled symbols indicate that the FQHE is stable. The size of the filled symbols for data from some representative QW widths ( 45, 48, 56, and 77 nm) give an approximate indication of the strength of the FQHE as deduced, e.g., from the depth of the minimum or from the measured energy gaps Suen (1993); Suen et al. (1994). The open symbols in Figs. 5-7 denote the absence of a FQHE. In all the samples, the trend is the same: The FQHE is seen in an intermediate density range which depends on the QW width, but turns into a compressible state when the density is sufficiently lowered. In Figs. 5-7 we mark the approximate boundary between the FQHE and the compressible state with a dashed curve. This boundary is a main focus of our work presented here. At sufficiently high densities, the electron system turns into an insulating phase whose characteristics suggest the formation of a pinned bilayer Wigner crystal Manoharan et al. (1996); Shayegan et al. (1996); Shayegan (1999). We have indicated the boundary between the FQHE and the insulating phase with a dotted curve in Figs. 5-7. This boundary, and the properties of the insulating phase are interesting in their own right, but are beyond the scope of our study. We note, however, that this boundary is difficult to determine in narrower QWs because of the very high densities, and hence very high magnetic fields, that are required for its access.
Before discussing these phase diagrams, we would like to highlight some additional information that Fig. 5 provides: For a given well-width , decreases with increasing , and this dependence allows us to determine reasonably precise values for . This is important because, as stated in Section II, many of our samples were not rotated during the molecular beam epitaxial growth and is not precisely known. To determine , we performed self-consistent (Hartree) calculations of the charge distribution and potential, and hence , while keeping as a fitting parameter. Examples of the results of such calculations are shown by two thin, red, solid lines in Fig. 5 for 48.1 and 48.8 nm. It is clear that the measured data points for the sample whose we quote as 48 nm fall between these two lines. Using a similar procedure, we determined for all other samples, except for the sample of Ref. Luhman et al. (2008) (green circles in Fig. 5). For this sample, a 50 nm was quoted in Ref. Luhman et al. (2008) but no measurements of were reported. We thus used 50 nm and in Fig. 5 we plot our calculated for the two densities reported in Ref. Luhman et al. (2008). We would like to emphasize that, for consistency in our presentation, we used the same calculations to determine for the older samples of Suen Suen et al. (1992a, b); Suen (1993); Suen et al. (1994) (black data points in Fig. 5). We have found that there is a small discrepancy between determined from our fits and those quoted previously. In particular, we find 57, 67, and 70 nm while in Refs. Suen et al. (1992a, b); Suen (1993); Suen et al. (1994) the quoted values are 60, 68, and 71 nm, respectively. These discrepancies mainly stem from the differences in the self-consistent calculations and the band parameters used. Given the accuracies of the measured and also the self-consistent calculations, we estimate the overall absolute accuracy of the quoted to be about 5%. Their relative accuracy, however, is better than about 2%. Our quoted also agree with the nominal QW widths based on the epitaxial growth rates to within about 10%.
Returning to the phase diagrams in Figs. 5-7, each provides a different perspective on the stability of the FQHE in wide GaAs QWs. Figure 5 plot is rather unique in that the parameters for both axes, and density, are experimentally measured quantities. The plot clearly demonstrates that the FQHE is only stable in a range of intermediate densities which depends on the QW width. More remarkably, it reveals that the boundary between the FQHE and compressible ground states (dashed line in Fig. 5) appears to be well described by essentially a line. We are not aware of any theoretical calculations which predict such a simple (linear) boundary for the transition between the compressible and FQHE phases in wide QWs at .
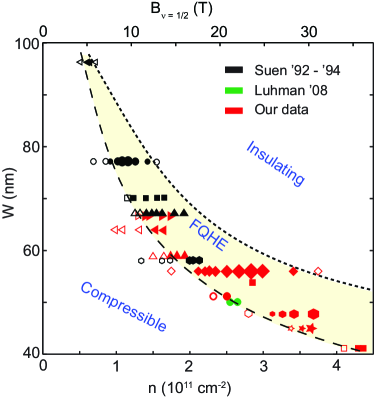
Figure 6 provides perhaps the simplest phase diagram as it gives at a glance the range of densities within which the FQHE is stable for electrons confined to a symmetric GaAs QW of width . It is clear that the narrower the QW, the higher the density range where the FQHE is seen. Figure 6 also indicates that in very wide QWs the FQHE is stable only in a very small range of very low densities.
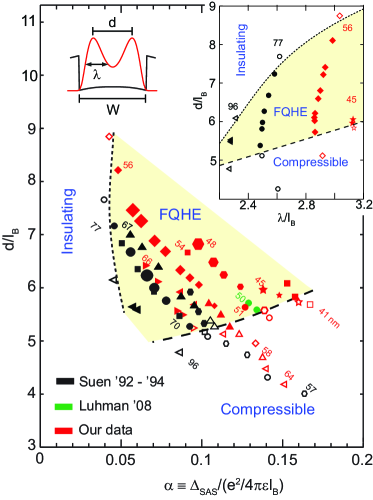
Finally, we provide the phase diagram of Fig. 7 which is often used to discuss the origin and stability of the FQHE in a wide QW or in a double QW system He et al. (1993); Suen (1993); Suen et al. (1994); Peterson and Das Sarma (2010). This diagram takes into account the competition between three relevant energies: (i) the inter-layer tunneling energy (), (ii) the intra-layer (in-plane) Coulomb energy (), and (iii) the inter-layer Coulomb energy (). The coordinates in the diagram of Fig. 7 are the ratios of , which we denote as , and which is equal to . It is worth noting that in a wide QW, as the density increases, decreases because both and (at ) decrease, and increases.
Besides the above three energies, another potentially relevant energy is the Zeeman energy where
is the effective Lande g-factor and is the Bohr
magneton. Using the GaAs band value of ,
K/T. This is smaller than at magnetic fields where
the FQHE is observed in our samples (see, e.g., Fig. 5),
implying that the spin degree of freedom is important. However, in
our wide GaAs QW samples, is typically enhanced by a factor of
or larger Liu et al. (2011), so that
is more than twice larger than . We therefore expect
the spin degree of freedom not to play a role in the stability of
the FQHE in our samples. This is consistent with data in
tilted magnetic field data which show that, starting near the
compressible-FQHE boundary, the FQHE gets stronger at
small tilt angles Lay et al. (1997); Luhman et al. (2008). Such
strengthening is consistent with becoming effectively
smaller because of the parallel field component Hu and MacDonald (1992),
thus moving the electron system towards a region of higher stability
for the FQHE (see, e.g., Fig. 5).
VI Discussion and conclusions
Consider first a bilayer electron system with inter-layer separation but with zero inter-layer tunneling (). If is very large, there should be no FQHE at as the electron system behaves as two independent layers with little or no inter-layer interaction, each at filling factor . As the layers are brought closer together (, a FQHE, described by the two-component state, is possible. This is indeed believed to be the case for the FQHE observed in bilayer electron systems in double QW samples with very little inter-layer tunneling Eisenstein et al. (1992); He et al. (1993); Note (6).
For finite values of tunneling () two types of FQHE states can exist at . At small values of the intra-layer correlations can dwarf the tunneling energy, thus stabilizing a two-component FQHE state. For larger , on the other hand, the one-component (Pfaffian) FQHE might be stable. For very large , it is most likely that the ground state is compressible. The relative stabilities of a or Pfaffian FQHE state compared to a compressible state are of course also influenced by the ratio of the inter-layer to intra-layer interactions () as well as the thickness of the ”layers” (the parameter in the insets to Figs. 1 and 7) which, as we discuss below, softens the intra-layer short-range interactions Suen et al. (1992a, b); Suen (1993); Suen et al. (1994).
Following some of the earlier theoretical work Rezayi and Haldane (1987); Chakraborty and Pietiläinen (1987); Yoshioka et al. (1989); MacDonald (1990); Moore and Read (1991); He et al. (1991); Greiter et al. (1991); He et al. (1993); Halperin (1994), recently there have been several reports of calculations to determine the stability of the different FQHE and compressible states in double and wide QWs Nomura and Yoshioka (2004); Papić et al. (2009, 2009); Storni et al. (2010); Peterson and Das Sarma (2010); Peterson et al. (2010). A main conclusion of these calculations is that the Pfaffian FQHE state at is not stable in a strictly 2D electron system with zero layer thickness Storni et al. (2010). However, for a system with finite (non-zero) layer thickness and tunneling, such as electrons in a wide QW, the calculations indicate that at the Pfaffian FQHE state could in principle exist at relatively large values of . In particular, the FQHE state is found to be stable in a range of small values of but as increases the system makes a transition into a Pfaffian state before it becomes compressible at very large values of Nomura and Yoshioka (2004); Peterson and Das Sarma (2010). Interestingly, the calculations suggest that very near the transition between the and Pfaffian states, the energy gap for the 1/2 FQHE is maximum, i.e., there is an upward cusp in the energy gap vs plot Nomura and Yoshioka (2004); Peterson and Das Sarma (2010). This is indeed what is qualitatively seen in experiments Suen (1993); Suen et al. (1994). In Ref. Nomura and Yoshioka (2004) it was concluded that the presence of this cusp and the finite value of the energy gap on the Pfaffian side suggest that the Pfaffian state could be stable at in wide QWs. Authors of Ref. Peterson and Das Sarma (2010), on the other hand, concluded that although a Pfaffian FQHE state at = 1/2 could in principle exist near this cusp, the chances that such a state would survive in the thermodynamic limit are slim Storni et al. (2010).
The phase diagrams we present here provide the comprehensive experimental conditions under which the FQHE is observed in wide GaAs QWs with symmetric charge distributions. We note that the samples whose data we summarize in these diagrams span a large parameter range (well width, density, mobility), and yet the observed trends are remarkably consistent among the different samples. Of special interest are the samples with relatively narrow QW width, i.e., with large where the Pfaffian state is most likely to exist.
It is worth closely comparing our Fig. 7 diagram with the latest theoretical diagrams, namely those in Fig. 5 of Ref. Peterson and Das Sarma (2010). Suppose we assume that the FQHE we observe is a state and associate the dashed curve in Fig. 7 which separates the FQHE from the compressible state with the dashed curve in Fig. 5 of Ref. Peterson and Das Sarma (2010) which separates the FQHE state from the (unstable) Pfaffian state. There is overall some qualitative agreement between the characteristics of these curves in that they both have positive slopes and cover approximately the same ranges of and . There are, however, major quantitative discrepancies. For example, the experimental boundary in Fig. 7 is relatively horizontal and suggests that the critical values for the transition are between 5 and 6 in the range of Note (8). The boundary calculated in Ref. Peterson and Das Sarma (2010), on the other hand, has a much stronger dependence on . Moreover, in the phase diagram of Fig. 7, for our narrowest QW ( nm) in which we observe the FQHE is 0.16. This , which is the largest value at which a FQHE at has been observed, exceeds typical values of where the is theoretically predicted to be stable Peterson and Das Sarma (2010). Interestingly, the plots in Fig. 5 of Ref. Peterson and Das Sarma (2010) imply that the FQHE state would be stable at only when the bilayer system has a very narrow layer thickness (measured in units of ). However, our data summarized in Fig. 7 upper-right inset indicate that, for the FQHE we observe at in the 41-nm-wide QW, the layer thickness exceeds 3 times .
Despite the above discrepancies between the experimental and theoretical phase diagrams, we believe that the FQHE we observe in symmetric, wide GaAs QWs is very likely the state. We base our conclusion on two experimental observations. First, as seen in Fig. 4, the FQHE is most stable when the charge distribution is symmetric and quickly disappears and turns into a compressible state when the distribution is made asymmetric Note (7); Scarola et al. (2010). Similar observations were reported for wider GaAs QWs Suen (1993); Suen et al. (1994); Manoharan et al. (1996); Shayegan et al. (1996); Shayegan (1999); Shabani et al. (2009a). Our data of Fig. 4 demonstrate that this trend of extreme sensitivity to charge distribution symmetry extends to the narrowest QWs which have the largest values of . Concurring with the conclusion reached in these previous experimental studies Suen (1993); Suen et al. (1994); Manoharan et al. (1996); Shayegan et al. (1996); Shayegan (1999); Shabani et al. (2009a), we suggest that the FQHE observed in symmetric, wide GaAs QWs is a two-component state, stabilized by a delicate balance between the intra-layer and inter-layer correlations.
Second, an examination of the parameters where we see the FQHE favors the above conjecture. Note that the two-component state is theoretically expected to be stable when the intra-layer and
inter-layer Coulomb interactions are comparable, i.e., have a ratio of
about unity Yoshioka et al. (1989); He et al. (1991). For an ideal
bilayer electron system (with zero layer thickness), the ratio
accurately reflects the relative strengths of the intra-layer and
inter-layer Coulomb interactions and the FQHE should be
observable for . However, in an electron system whose
layer thickness is comparable to or larger than , the short-range
component of the Coulomb interaction, which is responsible for the
FQHE, softens Shayegan et al. (1990); He et al. (1990). This softening is
significant in bilayer electron systems confined to wide QWs and, in
particular, (for each layer) is about 2.4 to 3.3 in the
regime where the FQHE is stable (see Fig. 7 upper-right
inset) Suen et al. (1992a, b); Suen (1993); Suen et al. (1994). Associating the FQHE we observe with the
state, it is thus not surprising that we see this FQHE
when is much larger than unity (Fig. 7): The short-range component of
the intra-layer interaction is weaker for a bilayer system with larger
; therefore to ensure the proper intra-layer to
inter-layer interaction ratio which favors the state, a
relatively weaker inter-layer interaction (smaller ) is also needed, implying a larger
Suen et al. (1992a, b); Suen (1993); Suen et al. (1994). It is clearly evident in Fig. 7 upper-right inset that for a
sample with larger , the FQHE is indeed stable in a
region of larger .
VII Summary
The phase diagrams we present here establish the experimental conditions under which the FQHE is observed in electron systems confined to symmetric, wide GaAs QWs in large ranges of density and QW width. The disappearance of the FQHE when the charge distribution is made asymmetric (Fig. 4) suggests that the FQHE has a two-component origin even in narrow QWs where the inter-layer tunneling is quite significant. We also compare our experimental phase diagram of normalized inter-layer distance vs tunneling (Fig. 7) to the theoretical diagrams which have been used to conclude a two-component origin for the FQHE. We find some agreement between the experimental and theoretical phase diagrams, but there are certainly quantitative discrepancies. Our observation that in a simple tunneling vs density diagram (Fig. 5) the boundary between the FQHE and compressible state is essentially a
straight line is also intriguing and seeks explanation. We
conclude that, in light of our new data, more detailed and precise
calculations are needed to make a quantitative connection to the experimental data and help unveil the physics of the FQHE in
symmetric, wide GaAs QWs.
We acknowledge support through the NSF (Grants DMR-0904117, DMR-1305691, and MRSEC DMR-0819860), the Keck Foundation, and the Gordon and Betty Moore Foundation (Grant GBMF2719). A portion of this work was performed at the National High Magnetic Field Laboratory which is supported by National Science Foundation Cooperative Agreement No. DMR-1157490, the State of Florida and the US Department of Energy. We are grateful to J.K. Jain and Z. Papic for illuminating discussions, and to E. Palm, S. Hannahs, T. P. Murphy, J. H. Park and G. E. Jones for technical assistance with the high magnetic field measurements.
References
- Tsui et al. (1982) D. C. Tsui, H. L. Stormer, and A. C. Gossard, Phys. Rev. Lett. 48, 1559 (1982).
- Jain (2007) J. K. Jain, Composite Fermions (Cambridge University Press, Cambridge, UK, 2007).
- Willett et al. (1987) R. L. Willett, J. P. Eisenstein, H. L. Störmer, D. C. Tsui, A. C. Gossard, and J. H. English, Phys. Rev. Lett. 59, 1776 (1987).
- Pan et al. (1999) W. Pan, J.-S. Xia, V. Shvarts, D. E. Adams, H. L. Stormer, D. C. Tsui, L. N. Pfeiffer, K. W. Baldwin, and K. W. West, Phys. Rev. Lett. 83, 3530 (1999).
- Nayak et al. (2008) C. Nayak, S. H. Simon, A. Stern, M. Freedman, and S. Das Sarma, Rev. Mod. Phys. 80, 1083 (2008).
- Halperin (1983) B. Halperin, Helv. Phys. Acta 56, 75 (1983).
- Moore and Read (1991) G. Moore and N. Read, Nuclear Physics B 360, 362 (1991).
- Rezayi and Haldane (1987) E. H. Rezayi and F. D. M. Haldane, Bull. Am. Phys. Soc. 32, 892 (1987).
- Chakraborty and Pietiläinen (1987) T. Chakraborty and P. Pietiläinen, Phys. Rev. Lett. 59, 2784 (1987).
- Yoshioka et al. (1989) D. Yoshioka, A. H. MacDonald, and S. M. Girvin, Phys. Rev. B 39, 1932 (1989).
- MacDonald (1990) A. MacDonald, Surf. Sci. 229, 1 (1990).
- He et al. (1991) S. He, X. C. Xie, S. Das Sarma, and F. C. Zhang, Phys. Rev. B 43, 9339 (1991).
- Greiter et al. (1991) M. Greiter, X.-G. Wen, and F. Wilczek, Phys. Rev. Lett. 66, 3205 (1991).
- He et al. (1993) S. He, S. Das Sarma, and X. C. Xie, Phys. Rev. B 47, 4394 (1993).
- Halperin (1994) B. I. Halperin, Surf. Sci. 305, 1 (1994).
- Nomura and Yoshioka (2004) K. Nomura and D. Yoshioka, J. Phys. Soc. of Jap. 73, 2612 (2004).
- Papić et al. (2009) Z. Papić, G. Möller, M. V. Milovanović, N. Regnault, and M. O. Goerbig Phys. Rev. B 79, 245325 (2009).
- Papić et al. (2009) Z. Papić, N. Regnault, and S. Das Sarma, Phys. Rev. B 80, 201303 (2009).
- Storni et al. (2010) M. Storni, R. H. Morf, and S. Das Sarma, Phys. Rev. Lett. 104, 076803 (2010).
- Peterson and Das Sarma (2010) M. R. Peterson and S. Das Sarma, Phys. Rev. B 81, 165304 (2010).
- Peterson et al. (2010) M. R. Peterson, Z. Papić, and S. Das Sarma, Phys. Rev. B 82, 235312 (2010).
- Eisenstein et al. (1992) J. P. Eisenstein, G. S. Boebinger, L. N. Pfeiffer, K. W. West, and S. He, Phys. Rev. Lett. 68, 1383 (1992).
- Suen et al. (1992a) Y. W. Suen, L. W. Engel, M. B. Santos, M. Shayegan, and D. C. Tsui, Phys. Rev. Lett. 68, 1379 (1992a).
- Suen et al. (1992b) Y. W. Suen, M. B. Santos, and M. Shayegan, Phys. Rev. Lett. 69, 3551 (1992b).
- Suen (1993) Y. W. Suen, Ph.D. thesis, Princeton University (1993).
- Suen et al. (1994) Y. W. Suen, H. C. Manoharan, X. Ying, M. B. Santos, and M. Shayegan, Phys. Rev. Lett. 72, 3405 (1994).
- Manoharan et al. (1996) H. C. Manoharan, Y. W. Suen, M. B. Santos, and M. Shayegan, Phys. Rev. Lett. 77, 1813 (1996).
- Shayegan et al. (1996) M. Shayegan, H. C. Manoharan, Y. W. Suen, T. S. Lay, and M. B. Santos, Semiconductor Science and Technology 11, 1539 (1996).
- Shayegan (1999) M. Shayegan, in Topological Aspects of Low Dimensional Systems, edited by A. C. A. Comtet, T. Jolicoeur, and S. Ouvry (Springer, Berlin, 1999), pp. 1–51.
- Luhman et al. (2008) D. R. Luhman, W. Pan, D. C. Tsui, L. N. Pfeiffer, K. W. Baldwin, and K. W. West, Phys. Rev. Lett. 101, 266804 (2008).
- Shabani et al. (2009a) J. Shabani, T. Gokmen, and M. Shayegan, Phys. Rev. Lett. 103, 046805 (2009a).
- Shabani et al. (2009b) J. Shabani, T. Gokmen, Y. T. Chiu, and M. Shayegan, Phys. Rev. Lett. 103, 256802 (2009b).
- (33) D. K. Ki, V. I. Fal’ko, and A. F. Morpurgo, arXiv:1305.4761 .
- Suen et al. (1991) Y. W. Suen, J. Jo, M. B. Santos, L. W. Engel, S. W. Hwang, and M. Shayegan, Phys. Rev. B 44, 5947 (1991).
- (35) T. S. Lay, Y. W. Suen, H. C. Manoharan, X. Ying, M. B. Santos, and M. Shayegan, Phys. Rev. B. 50, 17725 (1994).
- Liu et al. (2011) Yang Liu, J. Shabani, and M. Shayegan, Phys. Rev. B 84, 195303 (2011).
- Lay et al. (1997) T. S. Lay, T. Jungwirth, L. Smrčka, and M. Shayegan, Phys. Rev. B 56, R7092 (1997).
- Hu and MacDonald (1992) J. Hu and A. H. MacDonald, Phys. Rev. B 46, 12554 (1992).
- Note (6) It is worth emphasizing that the experimental phase diagram we present in Fig. 7 is for electron systems confined to a single wide GaAs QWs. The data of Ref. Eisenstein et al. (1992), which exhibit FQHE in double GaAs QWs with very small inter-layer tunneling () and , fall well outside the yellow-shaded region of Fig. 7 where the 1/2 FQHE is stable in wide GaAs QWs. An intriguing question is how far would the yellow region in Fig. 7 extend for even wider GaAs QWs, and whether it would ever contain the parameter range where the 1/2 FQHE is stable in double QWs.
- Note (8) It is worth noting that the value of at the compressible-FQHE boundary is also nearly a constant and ranges between 8.0 and 9.5.
- Note (7) The observation of developing FQHE states in highly asymmetric, wide GaAs QWs near fillings factors and 1/4 was recently reported and was interpreted to suggest that these states might have a one-component origin Shabani et al. (2009b). Subsequent calculations, however, seem to indicate that these are more likely two-component states, stabilized by a partial subband polarization Scarola et al. (2010).
- Scarola et al. (2010) V. W. Scarola, C. May, M. R. Peterson, and M. Troyer, Phys. Rev. B 82, 121304 (2010).
- Shayegan et al. (1990) M. Shayegan, J. Jo, Y. W. Suen, M. Santos, and V. J. Goldman, Phys. Rev. Lett. 65, 2916 (1990).
- He et al. (1990) S. He, F. C. Zhang, X. C. Xie, and S. Das Sarma, Phys. Rev. B 42, 11376 (1990).