THE GALAXY ENVIRONMENT OF A QSO AT
Abstract
High-redshift quasars are believed to reside in massive halos in the early universe and should therefore be located in fields with overdensities of galaxies, which are thought to evolve into galaxy clusters seen in the local universe. However, despite many efforts, the relationship between galaxy overdensities and quasars is ambiguous. This can possibly be attributed to the difficulty of finding galaxies with accurate redshifts in the vicinity of quasars. So far, overdensity searches around quasars have been based on studies of Lyman break galaxies (LBGs), which probe a redshift range of . This range is large enough to select galaxies that may not be physically related to the quasar. We use deep narrow- and broadband imaging to study the environment of the quasar ULAS J0203+0012. The redshift range probed by our narrow-band selection of Lyman alpha emitters (LAEs) is , which is significantly narrower than the LBG searches. This is the first time that LAEs were searched for near a quasar, in an effort to provide clues about the environments of quasars at the end of the epoch of reionization. We find no enhancement of LAEs in the surroundings of ULAS J0203+0012 in comparison with blank fields. We explore different explanations and interpretations for this non-detection of a galaxy overdensity, including that (1) the strong ionization from the quasar may prevent galaxy formation in its immediate vicinity and (2) high-redshift quasars may not reside in the center of the most massive dark matter halos.
Subject headings:
galaxies: formation — galaxies: high redshift — quasars: individual (ULAS J0203+0012)1. Introduction
Observations of the highest redshift () quasars indicate that they contain supermassive black holes with masses (e.g., Jiang et al., 2007; Kurk et al., 2007; De Rosa et al., 2011). Detecting of such massive black holes less than a gigayear after the big bang is challenging for structure-formation models. Some models propose that supermassive black holes are hosted in high-density peak dark matter halos (e.g., Volonteri & Rees, 2006). Numerical models predict that the most massive dark matter halos at will evolve into massive clusters in the local Universe (e.g., Springel et al., 2005).
At redshifts of , significant galaxy overdensities or protoclusters have been found around more than a half dozen luminous radio galaxies, confirming the idea that luminous active galactic nuclei (AGNs) pinpoint dense regions in the early universe (see, e.g., Venemans et al., 2007b, and references therein). Nevertheless, the environments associated with other classes of AGNs, such as the optically selected quasars, are currently less well constrained.
Recently, there have been a number of studies finding contradictory results regarding the galaxy environment of quasars at –. Cantalupo et al. (2012), in a narrow-band imaging survey around a quasar at , found a much larger number of Lyman alpha emitters (LAEs) than in blank-field Ly surveys. They suggest that this overdensity may be fully explained by quasar fluorescence, which boosts gas-rich but intrinsically faint LAEs, increasing the number of detectable objects. Francis & Bland-Hawthorn (2004) carried out deep narrow-band observations centered on a quasar. They were expecting to see – Ly-fluorescent clouds and tens of normal LAEs, based on similar surveys. However, they did not detect any Ly emission. In light of this result, Bruns et al. (2012) developed a semi-analytical model to interpret the observations. They concluded that the intense ultraviolet emission of the quasar may be suppressing the star formation in galaxies that are situated close to the quasar. This is consistent with the findings of Kashikawa et al. (2007) that LAEs are clustered around a quasar at but avoid it in its immediate vicinity ( comoving Mpc). Swinbank et al. (2012), on the other hand, reported a galaxy overdensity an order of magnitude higher than that which might be expected in the field within comoving Mpc of a quasar at . The same authors did not find clear evidence of overdensities in the fields of two quasars at . Very recently, Husband et al. (2013) noted that the luminous quasars in their sample at were typically found in overdense regions. Nevertheless, they mentioned that even the richest quasar environment they studied was no richer than others structures identified in blank fields.
Since the discovery of quasars, several groups have tried to identify galaxy overdensities associated with them. The results were as puzzling as those at lower redshifts. No unambiguous relation has been found between galaxy overdensities and quasars, mainly due to the difficulty of finding galaxies with accurate redshifts at . So far, these efforts were mainly based on studies of continuum -dropout galaxies, characterized by a large magnitude difference between the and bands (i.e., using the same technique that was used to detect the quasars). This technique probes a redshift range of approximately , which is large enough to identify galaxies that are not physically related to the quasar. Willott et al. (2005) carried out a survey with Gemini of three quasars. They found no evidence for an overdensity of -dropouts in the arcmin2 field surrounding the quasars. Stiavelli et al. (2005), however, came to a different conclusion for one of these fields. They observed a small field around SDSS J at with the Advanced Camera for Surveys (ACS) of the Hubble Space Telescope (HST) and found more than twice the number of dropouts with expected from statistics obtained by GOODS. The ACS field used in this study only surveys the region close to the quasar, but the observations are more sensitive to faint galaxies. Stiavelli et al. (2005) explain that the difference is that their data set is deeper and the majority of the excess sources are fainter than the limiting magnitude of Willott et al. (2005). Zheng et al. (2006), using ACS observations, found an overdensity in the field of a radio-loud quasar at : the surface density of sources was about six times higher than the number expected from ACS deep fields. Kim et al. (2009) studied -dropout galaxies in five fields centered on quasars using ACS and reported that regions near quasars are sometimes overdense and sometimes underdense. From a theoretical perspective, Overzier et al. (2009), using semi-analytic galaxy models in combination with the dark matter Millennium simulation (Springel et al., 2005; De Lucia & Blaizot, 2007), showed that the lack of neighboring galaxies as found by Willott et al. (2005) and Kim et al. (2009) was not inconsistent with quasars occupying massive halos due to a combination of depth, field-of-view, and projection effects. However, the same simulations also predicted that there were regions much more overdense than seen around any quasar observed to date. Utsumi et al. (2010) found an overdensity of -dropout galaxies around a quasar at , but at the same time these objects avoided the center near the quasar ( comoving Mpc), similar to what Kashikawa et al. (2007) found at lower redshift. At high redshift, it is very hard to obtain spectra of faint galaxies, but there are a few cases at , based on available spectroscopy, where quasars are located in regions with an overdensity of galaxies (Capak et al., 2011; Walter et al., 2012; Husband et al., 2013). It is worth noting that in some of these cases, the quasars do not reside in the center of the overdensities but at distances of – comoving Mpc. It is important to note that a few galaxy overdensities or protoclusters have been discovered serendipitously in random fields (e.g., Ouchi et al. 2005 at ; Toshikawa et al. 2012 at ; Trenti et al. 2012 at 8), suggesting that not all overdensities host AGNs, although this could also be explained by the duty cycle of AGN activity.
In summary, current dropout studies at give partly contradictory results. An efficient alternative is to search for LAEs in a narrow redshift range near the quasar using narrow-band filters. However, mainly due to the extremely low density of quasars of Mpc-3 (Fan et al., 2004), until recently no high-redshift quasars were known to have a redshift that shifts the Ly line into a region of the optical spectrum that is devoid of bright sky emission lines. These atmospheric windows, for example, around Å and Å, have successfully been used by blank field Ly surveys to search for galaxies at and (e.g., Hu et al., 1999, 2002; Ouchi et al., 2005, 2008). So far, the only study using narrow-band imaging to detect the Ly-emitting halo and possibly companions around quasars at was carried out using the HST by Decarli et al. (2012). Even though the goal of these observations was to detect the Ly halo around the quasars, they did not find any companions in the immediate vicinity of two quasars. This latter result was not unexpected because of the small field-of-view covered by their study ( arcmin2).
In the present work, we use deep narrow- and broad-band imaging to study the environment of the broad-absorption line quasar ULAS J0203+0012 (hereafter J0203; Venemans et al., 2007a; Jiang et al., 2008; Mortlock et al., 2009), one of the first quasars known with a redshift that shifts the Ly line into an atmospheric window that allows for deep narrow-band imaging. We assume the quasar redshift of determined by Mortlock et al. (2009), which is based on the N v, Si iv, C iv, and C iii lines from a combined optical and near-infrared spectrum. However, we have to keep in mind that any redshift in the range of is consistent with their data. Ryan-Weber et al. (2009), using a Keck/NIRSPEC spectrum, independently confirmed this quasar, reporting a redshift of based on a broad emission feature that they presume to be C iv . In any case, the uncertainty in redshift does not shift the Ly line outside the narrow-band filter used in our work.
In Section 2 we describe the data used in this study, photometry, and object detection. Section 3 describes how LAE and dropout or Lyman break galaxy (LBG) candidates were selected. In Section 4 we present our results, including a number count comparison with blank fields, photometric properties of the LAE sample, and our estimation of the black hole mass of the quasar. Finally, in Section 5 we discuss the results and present our conclusions.
In this paper, all magnitudes are given in the AB system and are corrected for Galactic extinction (Schlafly & Finkbeiner, 2011). We employ a CDM cosmology with Mpc-1, , and , which yields an age of the universe of Gyr and a spatial scale of kpc arcsec-1 in comoving units at .
2. Data, Reduction and Photometry
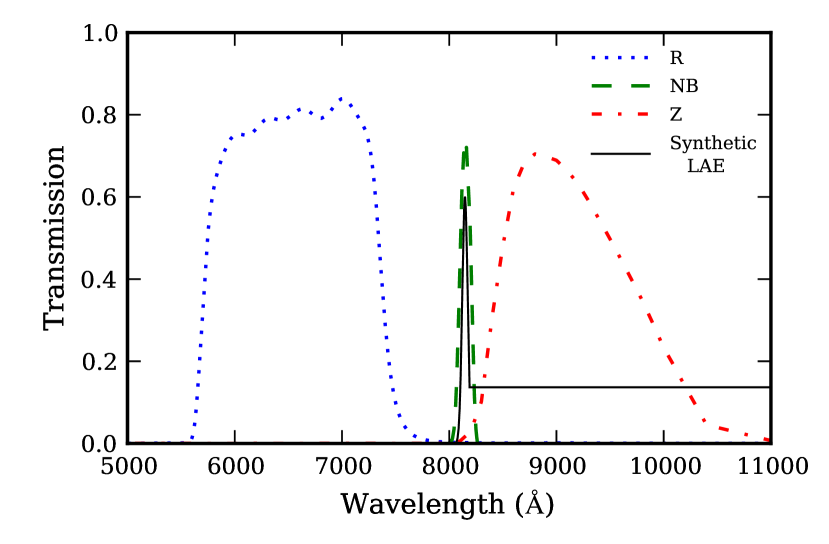
The field centered on the quasar J0203 at was observed during 2010 November–December. Narrow- and broad-band imaging was carried out with the FOcal Reducer/low dispersion Spectrograph 2 (FORS2; Appenzeller & Rupprecht, 1992) using the red sensitive detector consisting of two 2k 4k MIT CCDs at the Very Large Telescope (VLT). The pixels were binned to decrease the readout time and noise, giving a spatial scale of arcsec pixel-1. The field-of-view was . The field was observed in the narrow-band filter (FILT_815_13, Å, Å, hereafter NB) and the broad-band filters (Z_GUNN, Å, Å) and (R_SPECIAL, Å, Å). The filter transmission curves are shown in Figure 1. This filter set allowed us to sample both LAEs in a redshift range of with the narrow-band filter and LBGs in a broader redshift range with the broad-bands (, if we add the narrow-band filter to the selection).
The individual exposure times in NB, , and were 800s, 110s, and 240s per pointing, respectively. The individual exposures were shifted by with respect to each other to facilitate the removal of bad pixels and flat field errors associated with a fixed position of the CCD pixel. The total integration times were 6 hr in NB, 1.5 hr in , and 48 minutes in .
Standard data reduction was performed, which consisted of bias subtraction, flat fielding, sky subtraction, image alignments, and stacking. We calculated the photometric zero points by using the magnitudes and colors of stellar objects in the Sloan Digital Sky Survey (SDSS) catalog (Abazajian et al., 2009). With this procedure, the flux losses for point sources are corrected, which is appropriate for this study since we are interested in high-redshift LAEs that are expected to be unresolved. The accuracy of the photometric zero points was , , and for the NB, , and frames, respectively.
The area covered by the reduced images was arcmin2. The seeing for the final NB, , and images was , , and respectively. The limiting magnitudes of the reduced images with a diameter aperture were , , and .
In order to determine appropriate colors, the NB and images were convolved to match the PSF of the image, the image with the worst seeing, using the IRAF task psfmatch. The NB total magnitudes were calculated from the unconvolved image.
The source catalog was created running SExtractor (Bertin & Arnouts, 1996) in dual image mode with the narrow-band frame as the detection image. Aperture magnitudes were calculated using a diameter aperture (FWHM of the seeing). The chosen aperture was a good balance between optimizing the signal-to-noise (S/N) photometry of point sources and minimizing the amount of flux outside the aperture (Labbé et al., 2003). This size assured that at least of the flux of a point source was inside the aperture. We also tested larger apertures (e.g., 1″.8 diameter) and the results did not change, but the S/N of the objects slightly decreased. Magnitudes of objects not detected or fainter than limiting magnitudes either in or were replaced by the corresponding limiting magnitude. Finally, we only considered objects with S/N greater than 4, objects with , and with SExtractor flag in order to eliminate objects flagged as truncated (too close to an image boundary), incomplete or corrupted. The final catalog contained 2424 objects.
In order to conclude whether or not an overdensity around the quasar was present, we needed a comparison field obtained at similar depth in a region that did not target a quasar. For LAEs we were able to use results from the literature (see Section 4.1.1), whereas for LBGs there were no dropout searches with large spectroscopic follow-up in the literature. We performed our own selection of dropouts using the public catalogs of the Subaru Deep Field (SDF) imaging survey (Kashikawa et al., 2004), which (after removing low-quality regions) had an effective area of arcmin2. The SDF had several characteristics that made it a suitable comparison field for our study. (1) It is a large field, which helps to reduce cosmic variance. (2) It has and bands covering similar wavelength ranges compared to the ones in FORS2. (3) There are 42 spectroscopically confirmed -dropout galaxies discovered in different studies (Nagao et al., 2004, 2005, 2007; Ota et al., 2008; Jiang et al., 2011; Toshikawa et al., 2012; Jiang et al., 2013), which can be directly used to quantify the accuracy of our LBG selection.
The confirmed -dropout galaxies in the SDF were originally selected in the -band and all of them have a redshift (with one exception at ). For that reason, these galaxies would either not be detected or have negligible flux in our NB filter. Thus, in order to perform a consistent comparison, we created a second catalog for the J0203 field this time using the -band frame as the detection image (see Section 4.1.2).
3. Candidates Selection
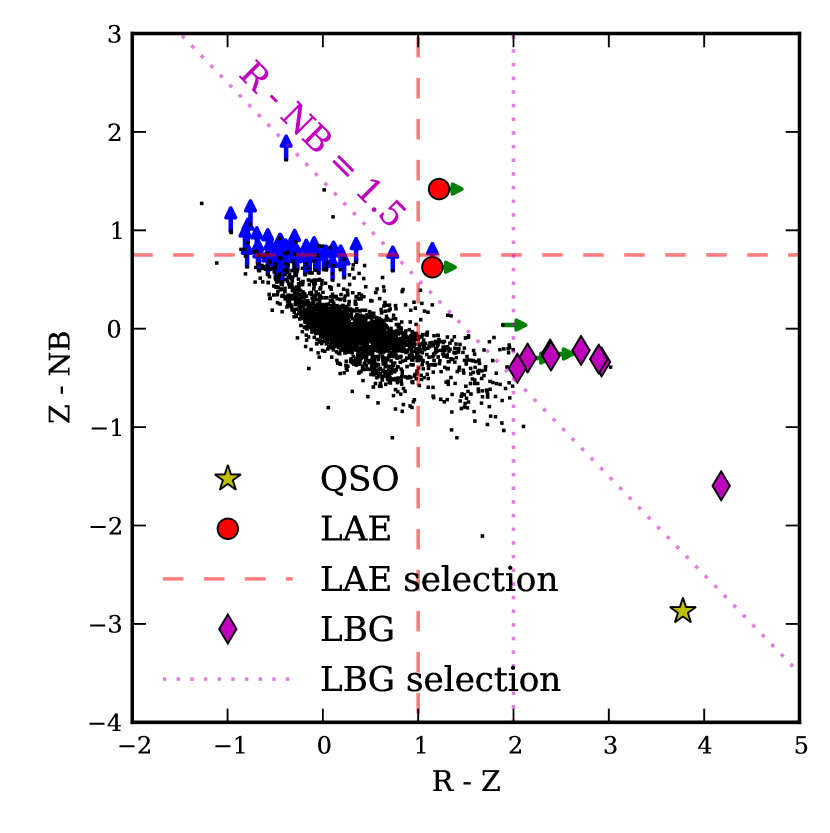
Figure 2 shows the two-color diagram of and for the objects detected in the narrow-band filter and summarizes the selection criteria for LAE and dropout candidates.
3.1. LAEs
LAEs are a population of high-redshift galaxies whose spectra are dominated by a strong Ly emission line and have a very flat and faint continuum. The LAE candidates were selected according to the following criteria:
-
•
Narrow-band excess. A positive indicates an excess in the narrow-band flux intensity. We determine a color cut such that the flux in the narrow-band is twice that in the band: . This cut corresponds to selecting objects with a rest-frame equivalent width greater than Å (see Section 4.2).
-
•
Continuum break. To differentiate between high-redshift LAEs and low-redshift emission line interlopers, we require a break in the continuum: .
-
•
Significance of the narrow-band excess. To avoid contamination by objects that satisfy the color criteria only due to photometric errors, we require: .
As seen in Figure 2, there is one object that satisfies our criteria (LAE 1). There is another one that is not detected in either of the broad-band images (LAE 2). LAE 2 has a lower limit in the narrow-band excess of . Additionally, when visually inspecting the -band image of LAE 2 a faint source is apparent. Forced photometry in the -band image at the position of LAE 2 gives a signal, thus, increasing the chances of LAE 2 being a real object. We consider LAE 2 to be a tentative LAE candidate, although deeper observations and/or spectroscopy are needed to confirm its nature.
3.2. Lyman Break Galaxies
Dropout galaxies are also known as LBGs, given that they are selected using the Lyman break technique (Steidel et al., 1996). The basis of this method is the fact that hydrogen is very effective at absorbing radiation at wavelengths shorter than Å (the Lyman limit). Therefore, radiation with Å is strongly suppressed by intergalactic and interstellar absorption, so a very small fraction of these photons will reach us, forming the so-called Lyman Break. At high-redshifts, the Ly forest becomes so optically thick that a large fraction of the light coming from Å to Å is also absorbed. At this point the Lyman break selection becomes, in effect, a selection of objects with a sharp break at Å.
Dropout candidates were selected with the following criteria:
-
•
Continuum break. A prominent break in the continuum is expected for high-redshift galaxies due to the hydrogen absorption. We require a continuum break of . Additionally, in an attempt to bias our high-redshift candidates toward a redshift closer to the redshift of the quasar, we require a break between the flux in the NB and filters: . However, this last criterion has a small effect and excludes only one candidate.
-
•
Significance of the break. To avoid contamination by objects that only satisfy the color criteria due to photometric errors, we require: .
-
•
Faintness. Since high-redshift galaxies are expected to be faint, we impose a minimum magnitude of .
As shown in Figure 2, there are eight LBG candidates satisfying the criteria.
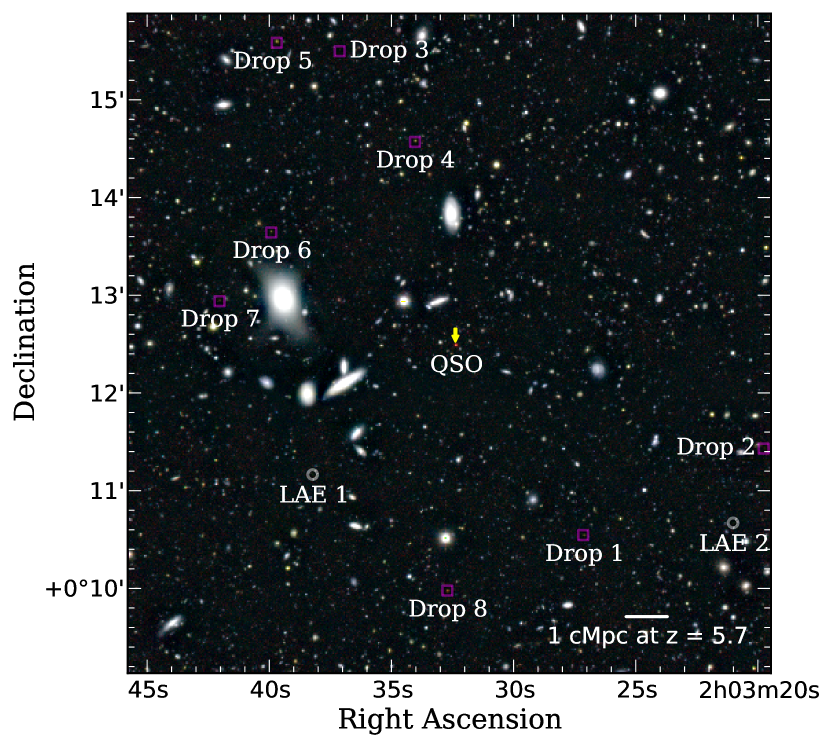
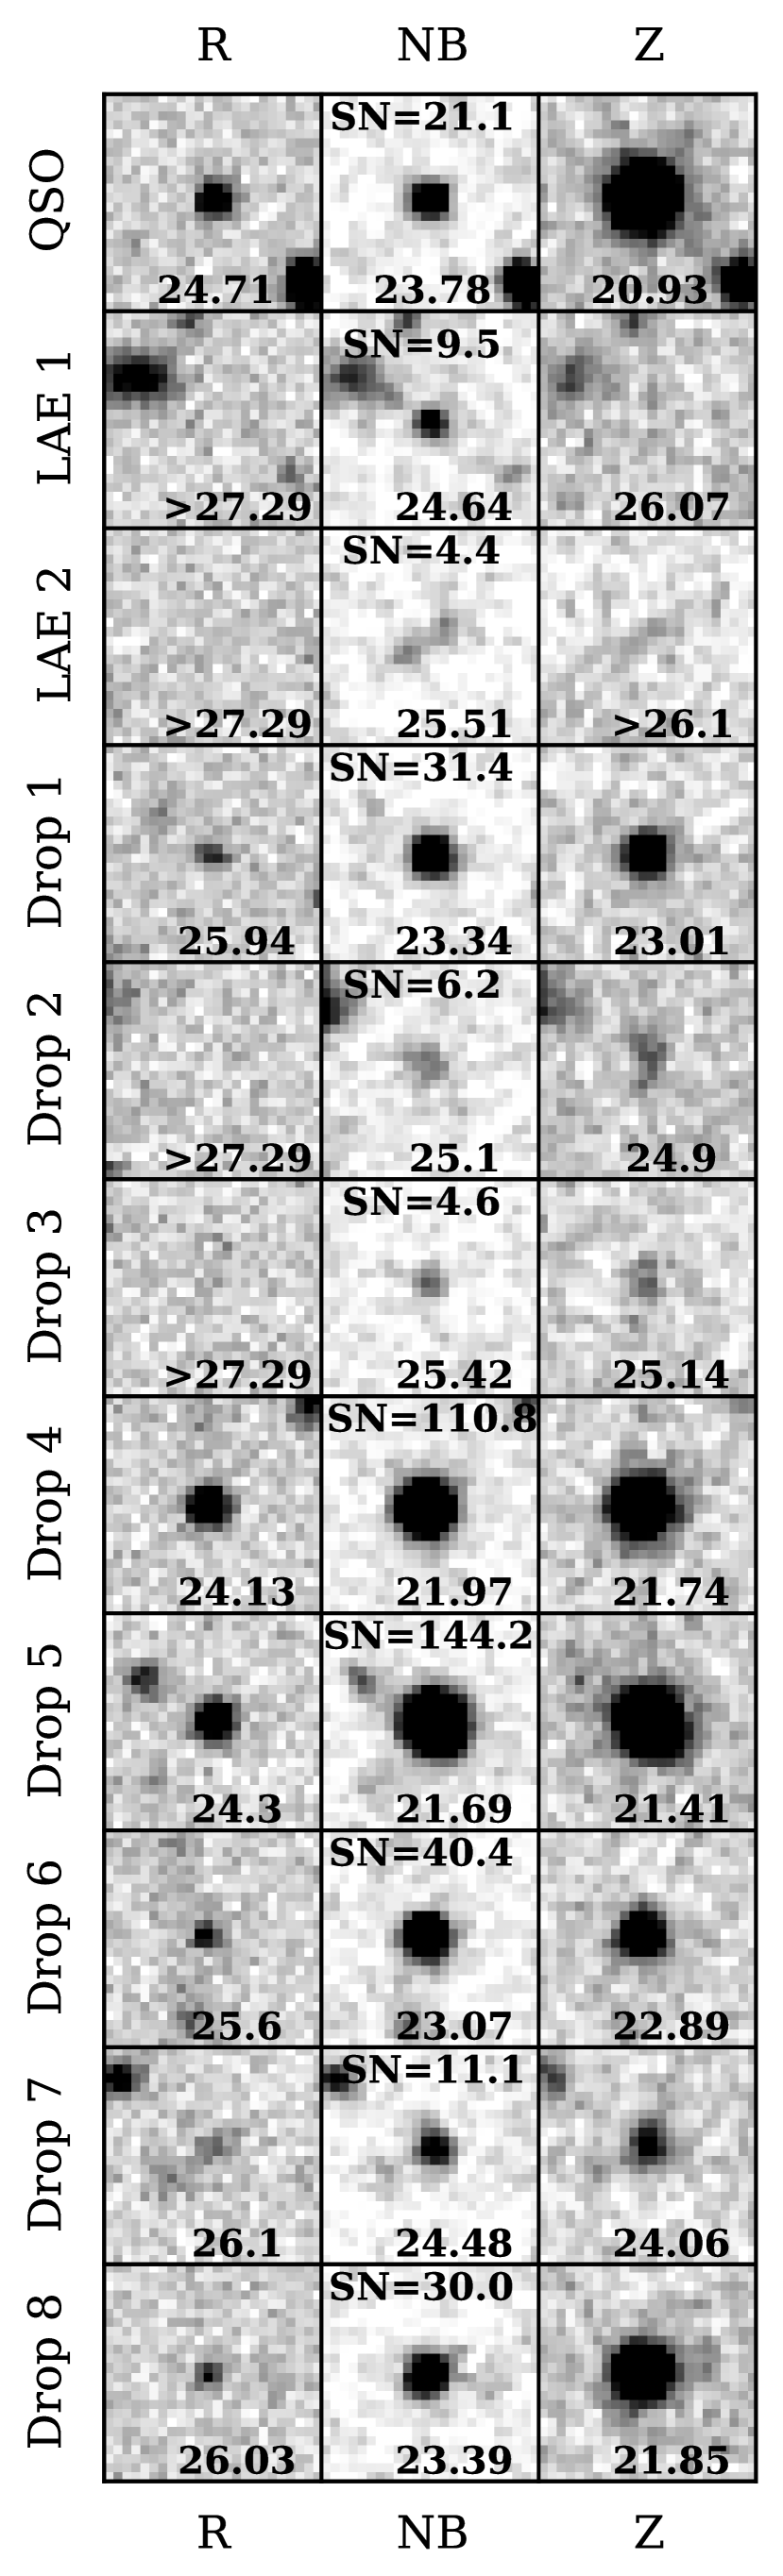
The coordinates of the LAE and LBG candidates and their projected distances to the quasar are presented in Table 1. Figure 3 shows the color image of the field overlaid with the positions of the LAE and LBG candidates, and the quasar. Postage-stamp images of these objects are shown in Figure 4.
| Object | R.A. | Decl. | Distance | Distance |
|---|---|---|---|---|
| (J2000.0) | (J2000.0) | (arcmin) | (cMpca) | |
| LAE 1 | 02:03:38.23 | +00:11:09.9 | 1.97 | 4.65 |
| LAE 2 | 02:03:21.02 | +00:10:40.2 | 3.37 | 7.96 |
| Drop 1 | 02:03:27.15 | +00:10:32.7 | 2.34 | 5.52 |
| Drop 2 | 02:03:19.76 | +00:11:25.8 | 3.33 | 7.85 |
| Drop 3 | 02:03:37.12 | +00:15:29.9 | 3.24 | 7.64 |
| Drop 4 | 02:03:34.04 | +00:14:34.2 | 2.13 | 5.02 |
| Drop 5 | 02:03:39.69 | +00:15:35.0 | 3.60 | 8.49 |
| Drop 6 | 02:03:39.92 | +00:13:38.5 | 2.21 | 5.22 |
| Drop 7 | 02:03:42.04 | +00:12:56.3 | 2.46 | 5.78 |
| Drop 8 | 02:03:32.71 | +00:09:58.6 | 2.51 | 5.92 |
aComoving Mpc at
4. Results
4.1. Blank Field Comparison
4.1.1 LAEs
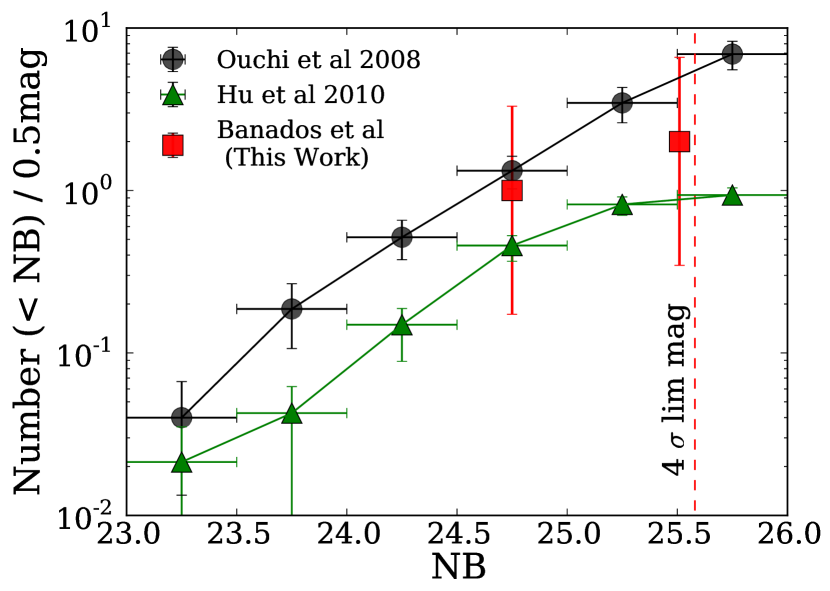
The selection criteria used in the present work (see Section 3.1) is close to that used by Ouchi et al. (2005, 2008). Thus, it is natural to use their LAE sample for comparison. Their observations cover a larger area and reach fainter luminosities than this work: the area they imaged is 1.04 deg2 on the sky and a 5 limiting magnitude of ( Å, Å). Unlike our field, the Ouchi et al. (2008) sample is not centered on a quasar, which is why we consider it a blank field. However, even in blank fields, protoclusters can exist. In fact, Ouchi et al. (2005) detected two overdensities that could be clusters in a formation phase.
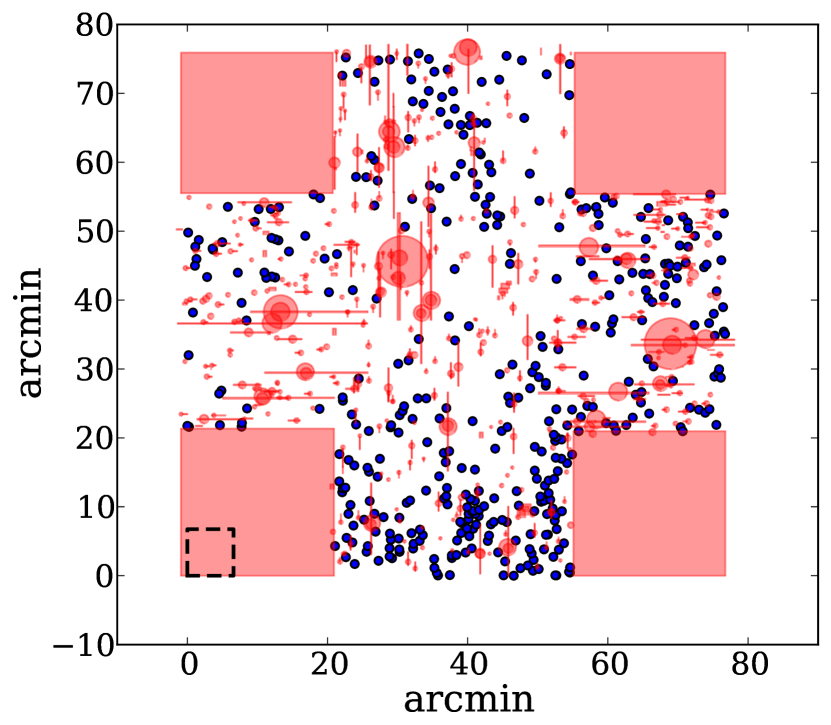
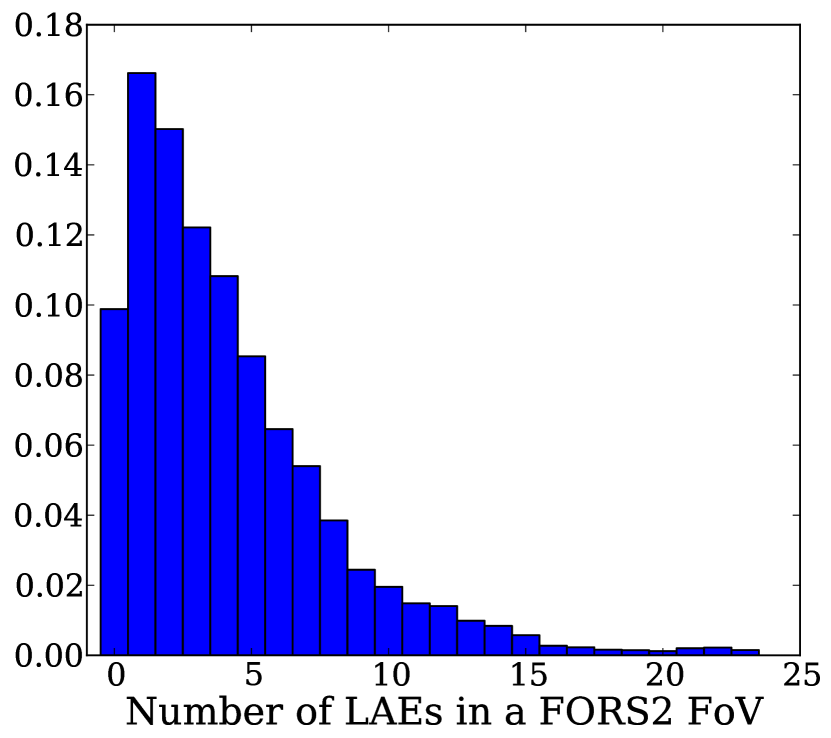
In Figure 5, we show our cumulative number of LAEs and also the numbers from Ouchi et al. (2008) scaled to our area. Our results are in good agreement with the expected number from Ouchi et al. (2008). Figure 6 shows the distribution on the sky of the 401 LAEs at detected by Ouchi et al. (2008). Masked regions due to bright stars or image artifacts are shown in red. The dashed square in the bottom-left corner represents the effective size of the FORS2 field-of-view used in this work. With the goal of estimating the probability of detecting, in a blank field, the number of LAEs that we find in this work, we placed FORS2 fields-of-view at random positions in the Ouchi et al. (2008) field. Only fields where less than 10% of the region is masked out were considered. We counted how many LAEs fell in each FORS2 field and the result is summarized in the histogram of Figure 7. Even considering that Ouchi et al. (2008) would have detected more galaxies since they were sensitive to fainter magnitudes, we find from Figure 7 that the number of LAEs in our field-of-view is consistent with the most typical number expected in their blank field, i.e., one or two galaxies.
Our results also compare with the study by Hu et al. (2010), which is based on a sample of 88 spectroscopically confirmed LAEs at in an area of 1.16 deg2. Figure 5 shows their cumulative number of LAEs scaled to our area. The fact that their numbers are lower than the numbers of the Ouchi et al. (2008) sample, could be explained by the fact that Hu et al. (2010) could not spectroscopically confirm approximately half of their photometric candidates. Nevertheless, our results are still consistent, within the errors, with the number expected from Hu et al. (2010). We conclude that there is no overdensity of LAEs in the quasar field.
4.1.2 LBGs
As stated in Section 3.2 and shown in Figures 3 and 4, we found eight objects satisfying our LBG criteria. These objects were detected in the NB filter and our criteria place them in the redshift range: . However, we cannot follow the same approach if we want to exploit the information of the 42 confirmed -dropout galaxies in our comparison field (SDF), due to the fact that essentially all of these confirmed galaxies have a redshift (except one that has a redshift of , in Toshikawa et al. 2012) and would not be detected in our NB filter.
We consider the SDF to be a blank field because it does not contain known quasars. The only caveat, is that it has been claimed that the SDF contains two overdensities. One is at (Shimasaku et al., 2003), from which we expect minimal contamination due to our selection criteria. The other one is a protocluster at (Ota et al., 2008; Toshikawa et al., 2012), which in principle could complicate our analysis.
The creation of the source catalogs for both the quasar and comparison fields was carried out in the same manner as for the J0203 field in Section 2, but this time using the -frame as the detection image. We applied the same selection criteria as in Section 3.2, except for the narrow-band constraints. Additionally, since the depth of the fields are different, in order to make a consistent comparison, we have constrained our LBG candidates to have a magnitude brighter than the limiting magnitude in the quasar field, i.e., . Since all the confirmed members of the protocluster at have magnitudes (Toshikawa et al., 2012), our selection cut should at least prevent us from dealing with a large fraction of the protocluster galaxies.
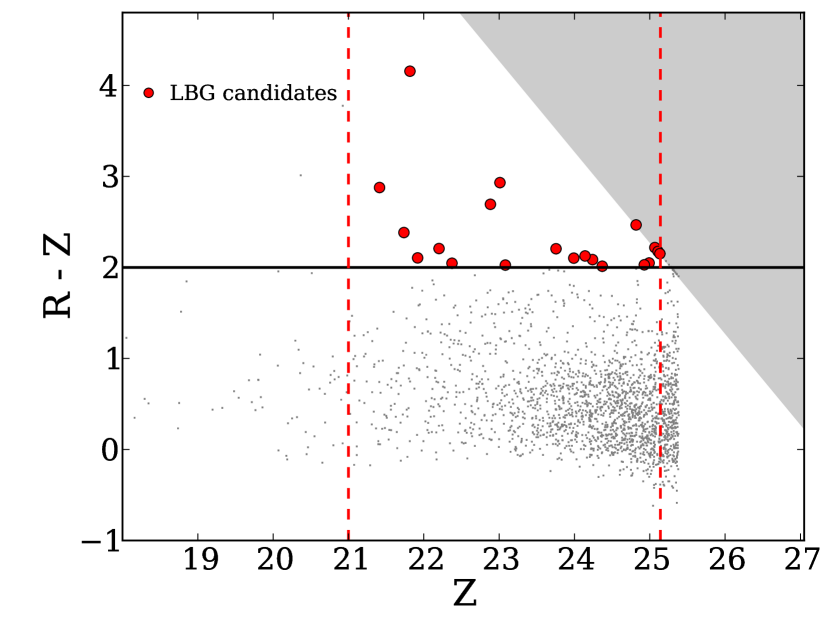
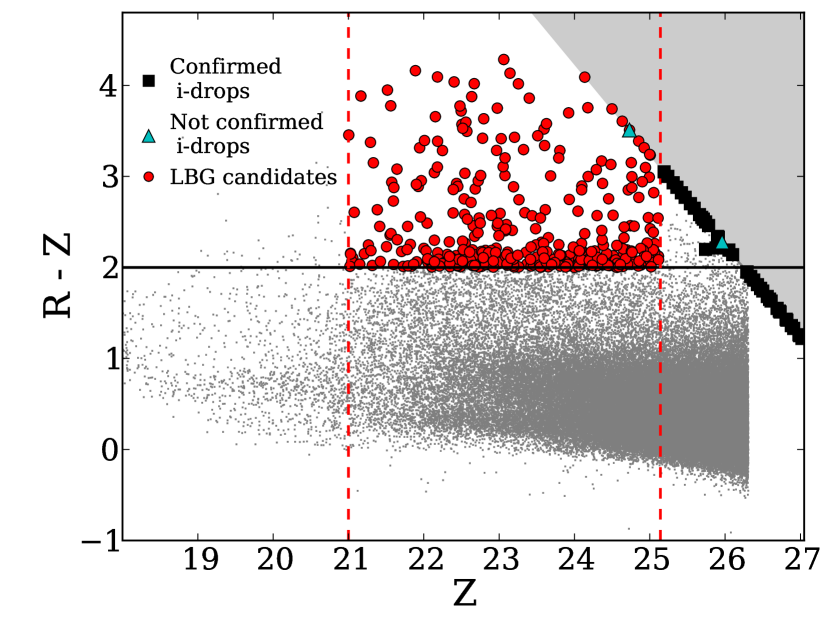
Figures 8 and 9 present the color–magnitude diagram and the selection criteria of the -band selected objects in the J0203 and SDF fields respectively. In red circles we show the LBG candidates detected in these fields. There were 20 LBG candidates in the quasar field, and this sample contained the 8 NB-selected LBGs from Section 3.2. We found 370 LBG candidates in the SDF. Scaling the LBG candidates in the SDF to our effective area, the expected number of candidates is . Additionally, we placed FORS2 fields-of-view at random positions in the SDF. Counting how many LBG candidates fell in each FORS2 field, resulted in a Gaussian distribution with mean and standard deviation . We concluded that the density of LBG candidates in the quasar field is consistent with that of a blank field.
Figure 9 also presents the compilation of known -dropout galaxies in the SDF. With our depth we could not detect any of the 42 spectroscopically confirmed galaxies. We were only able to recover the brightest candidate of Nagao et al. (2007), a source that could not be confirmed or ruled out as a galaxy at by its spectrum. Additionally, if we used the extra information of the SDF provided by the band, we noticed that the majority of the objects that we selected as possible LBGs seemed to be contaminants with a rather shallow slope in the , colors instead of having a sharp break.
From this analysis, we concluded that our LBG sample is very likely to be highly contaminated. We therefore cannot reliably estimate the (over)density of LBGs around our quasar. In the following sections we thus focus primarily on the LAE results.
4.2. Photometric Properties of the LAEs
We assume a simple model where the LAE spectrum consists of the Ly line with flux , a continuum flux density redward of Ly with strength and a power law slope (). Then, the flux density in the NB () and () can be written as:
| (1) | |||||
| (2) |
with the effective wavelength of the filter and the width of the filter. Dunlop et al. (2012) found that high redshift galaxies () have an average slope of and this does not show a significant trend with either redshift or . Assuming a flat continuum, i.e., , we solve the previous linear system and estimate the line flux and continuum flux density.
To calculate and equivalent width, we use the relations:
| (3) | |||||
| (4) |
with the luminosity distance and the wavelength of the Ly line. The rest-frame equivalent width is given by .
To calculate star formation rates (SFRs), we follow the approach of Ouchi et al. (2008):
| (5) |
where they used the relation of H luminosity and star formation rate (Kennicutt, 1998) and assumed the standard case B recombination factor of 8.7 for the LyH luminosity ratio (Brocklehurst, 1971).
We calculate the input parameters for the filters used in this project, taking into account both the filter curves and the quantum efficiency of the CCD: Å, Å, and Å. The star formation rates and rest-frame equivalent widths for our two LAE candidates from Section 3.1 are and for LAE 1 and LAE 2, respectively (see Figures 3 and 4).
The properties derived for LAE 1 are within the expected range for typical LAEs (see Ouchi et al., 2008, SFR = for LAEs at ), whereas for LAE 2, the SFR is lower than for typical LAEs and the equivalent width is only a lower limit.
4.3. Black Hole Mass of the Quasar
High-redshift quasars hosting black holes with masses are thought to be hosted by supermassive dark matter halos as suggested by their extremely low comoving density and large black hole masses (e.g., Volonteri & Rees, 2006). No black hole measurement exists for J0203. Typically, black hole masses of high-redshift quasars are estimated using the single-epoch black hole mass estimators based on continuum luminosities and broad emission lines such as Mg ii and C iv (e.g., Jiang et al., 2007; Kurk et al., 2007; De Rosa et al., 2011). For a source at , the Mg ii line appears at 1.88 m, in the middle of the strong telluric absorption band at m. Moreover, since J0203 is a broad absorption line quasar, the C iv line is strongly absorbed (see Figure 7 in Mortlock et al. 2009). That is why we cannot use these lines to measure the black hole mass of J0203. Instead, we estimate the quasar Eddington luminosity in order to determine the black hole mass, assuming that the central black hole accretes at the Eddington limit. We measure the flux at Å, yielding a monochromatic luminosity of erg s-1. Using the bolometric correction of 3.81 from Richards et al. (2006), we obtain a bolometric luminosity of erg s-1 with 0.2 dex of uncertainty. De Rosa et al. (2011) found that with a scatter of 0.2 dex for luminous ( erg s-1) quasars. Assuming this ratio applies to J0203, our estimate of the black hole mass is with 0.3 dex uncertainty. This mass is comparable to the typical black hole masses of the brightest SDSS quasars, thus it is plausible that J0203 resides in a massive dark matter halo.
5. Discussion and Conclusions
We present a deep study of the LAE and dropout population centered on the quasar J0203 with an estimated black hole mass of . The redshift of the quasar enables a LAE narrow-band search in its vicinity. We detect 2 LAE and 20 dropout candidates (the number of dropout candidates decreases to 8 if we use the narrow band for detection and selection). The LAE sample spans a very narrow redshift range around the quasar: . On the other hand, the dropout sample spans a larger redshift range as is typical for dropout selections: (, if the narrow-band filter is added to the selection).
Comparing our LAE counts with the luminosity functions of two LAE surveys that do not target a quasar (Ouchi et al., 2008; Hu et al., 2010), we find that our number counts are consistent with what is observed in blank fields.
The number of dropout candidates in the field of J0203 is consistent with the expected number from the SDF blank field. However, we find that with our depth and using only two broad bands for the selection, it is very likely that our candidates are highly contaminated. This implies that we cannot establish a reliable estimate of the (over)density of LBGs around J0203.
There are various ways to explain the non-detection of an overdensity of LAEs around the quasar.
-
1.
Low number statistics may prevent us from detecting a possible overdensity of emission line galaxies. If there were an overdensity it would be at least a factor of –, based on environmental studies of radio galaxies. Since we are studying only one quasar, it could be that we are targeting a rare source and that other quasars still harbor overdensities in their surroundings. This is certainly a possibility, but we believe that it is unlikely given the relatively low counts of LAEs and LBGs toward other quasars studied to date.
-
2.
The lack of neighbors in the immediate vicinity could be due to mergers of galaxies in the halo that hosts the quasar. However, we believe that such mergers should not prevent us from detecting an overdensity based on the protoclusters found around radio galaxies (e.g., Venemans et al., 2007b) and the recently spectroscopically confirmed LBGs in the vicinities of quasars at found by Husband et al. (2013), which in principle should have been affected in the same manner.
-
3.
The strong ionizing radiation from the quasar may prevent galaxy formation in its surroundings. There are several studies that support this claim (e.g., Bruns et al., 2012; Francis & Bland-Hawthorn, 2004) and therefore it would be important to understand and quantify this effect in order to consider it in simulations. Indeed, our results present evidence to support this idea because none of our candidates are at a distance closer than comoving Mpc ( physical Mpc), as can be seen in Figure 3 and Table 1. This is similar to the results presented by Kashikawa et al. (2007) and Utsumi et al. (2010), i.e., that galaxies avoid the vicinity of a quasar within distances of comoving Mpc and comoving Mpc, respectively.
Yet, the quasar ionization hypothesis fails to explain why apparent overdensities are found in the vicinities of other high-redshift quasars (e.g., Stiavelli et al., 2005). Further, we believe that is hard to reconcile a hypothesis in which the radiation affects the environment isotropically, with the unified AGN model where quasars have two collimated beams. However, contrary to the ionization hypothesis, Cantalupo et al. (2012) suggest that the radiation of the quasar may enhance the number of LAEs in its surroundings. They show that gas-rich objects with little or no associated star formation, known as proto-galactic clouds or dark galaxies, can be detected thanks to the Ly fluorescence induced by a nearby quasar. One of the main characteristics of these sources is a high Ly equivalent width ( Å). A detailed comparison with Cantalupo et al. (2012) is challenging because of the different redshifts and because the Lyman limit luminosity of our quasar, calculated following Hennawi et al. (2006), is about one order of magnitude smaller than the luminosity of the hyperluminous quasar (HLQSO) observed by Cantalupo et al. (2012). Additionally, since J0203 is a broad absorption line quasar (Mortlock et al., 2009), it is possible that the amount of escaping ionizing radiation is lower than expected in typical quasars.
Nevertheless, in our study, we do not find such fluorescent clouds. It should be noted that in our work, LAE 1 has an Å which has a 4% probability of having Å based on the uncertainties of the measured fluxes and LAE 2 only has a lower limit of Å.
-
4.
High-redshift quasars may not reside in the most massive halos. It is expected that the relation between black hole mass and halo mass that arises from combining the local relations between black hole and bulge mass on the one hand, and the relation between galaxy and halo mass on the other, is significantly different (both in slope and in scatter) at high redshift. Evidence for this has been found recently at by Trainor & Steidel (2012) who studied fifteen HLQSOs (; ) that are associated with galaxy overdensities. The authors conclude that HLQSOs do not require environments very different from their much less luminous quasar counterparts and are not being hosted by rarer dark matter halos. However, if this applies to the quasars as well, one would have to explain their extremely low space density. One possibility is that, due to selection effects, the bright quasars thus far discovered are biased toward more average-sized halos that are inhabited by very massive black holes.
-
5.
High-redshift quasars may not always reside in highly overdense, large-scale environments. All observational evidence considered, there appears to be a trend for quasars to sit in low-to-average galaxy environments on megaparsec scales. CDM predictions have shown that the most massive halos at high redshift do not invariably grow into the most massive ones at low redshift. Moreover, the most massive present-day structures (clusters) originated primarily from regions that were overdense on very large scales (tens of megaparsec) at (De Lucia & Blaizot, 2007; Overzier et al., 2009; Angulo et al., 2012). Although few studies have probed out to such large radii and with significant sensitivity, the lack of companion galaxies on megaparsec scales may indicate that the quasars do not pinpoint progenitors of the most massive clusters even if the quasars themselves are hosted by very massive halos. It is also possible that quasars reside in large-scale overdense environments, but just not in the center of them. Studies with larger fields-of-view are required to test this hypothesis.
One question that emerges naturally is why radio-galaxy-based protocluster surveys have been much more successful than any quasar-based protocluster survey. From a theoretical perspective, N. Fanidakis & Orsi (2013, in preparation) suggest that radio galaxies and quasars are observational manifestations of different accretion states, which are determined by the accretion and black hole properties and the large scale environment. Quasars accrete vast amounts of gas and form in the gas-rich environments of intermediate mass () dark-matter halos (Fanidakis et al., 2013). Radio galaxies, in comparison, are powered by rapidly spinning black holes that typically inhabit the centers of the most massive () dark matter halos in the universe and accrete low-density gas (for the properties of their AGN model; see Fanidakis et al., 2011, 2012). The largest concentrations of baryons are expected to be found within these halos and thus, radio galaxies can be used to pinpoint the location of large galaxy overdensities. The suggestion of a discrete halo environment of quasars and radio galaxies is also supported by clustering analysis of AGNs in the low-redshift universe (; e.g., Ross et al., 2009; Donoso et al., 2010; Wake et al., 2011).
More detailed studies of the environment and of the host galaxy of high-redshift quasars are needed to clarify the picture of overdensities around quasars. Future observational campaigns targeting high-redshift quasars either at , , or (corresponding to the few gaps of OH night-sky emission bands where narrow-band filters can be most effectively targeted to detect Ly emission) will be crucial to increase the sample and to quantify possible object-to-object variations.
References
- Abazajian et al. (2009) Abazajian, K. N., Adelman-McCarthy, J. K., Agüeros, M. A., et al. 2009, ApJS, 182, 543
- Angulo et al. (2012) Angulo, R. E., Springel, V., White, S. D. M., et al. 2012, MNRAS, 425, 2722
- Appenzeller & Rupprecht (1992) Appenzeller, I., & Rupprecht, G. 1992, Msngr, 67, 18
- Bertin & Arnouts (1996) Bertin, E., & Arnouts, S. 1996, A&AS, 117, 393
- Brocklehurst (1971) Brocklehurst, M. 1971, MNRAS, 153, 471
- Bruns et al. (2012) Bruns, L. R., Wyithe, J. S. B., Bland-Hawthorn, J., & Dijkstra, M. 2012, MNRAS, 421, 2543
- Cantalupo et al. (2012) Cantalupo, S., Lilly, S. J., & Haehnelt, M. G. 2012, MNRAS, 425, 1992
- Capak et al. (2011) Capak, P. L., Riechers, D., Scoville, N. Z., et al. 2011, Natur, 470, 233
- Decarli et al. (2012) Decarli, R., Walter, F., Yang, Y., et al. 2012, ApJ, 756, 150
- De Lucia & Blaizot (2007) De Lucia, G., & Blaizot, J. 2007, MNRAS, 375, 2
- De Rosa et al. (2011) De Rosa, G., Decarli, R., Walter, F., et al. 2011, ApJ, 739, 56
- Donoso et al. (2010) Donoso, E., Li, C., Kauffmann, G., Best, P. N., & Heckman, T. M. 2010, MNRAS, 407, 1078
- Dunlop et al. (2012) Dunlop, J. S., McLure, R. J., Robertson, B. E., et al. 2012, MNRAS, 420, 901
- Fan et al. (2004) Fan, X., Hennawi, J. F., Richards, G. T., et al. 2004, AJ, 128, 515
- Fanidakis et al. (2011) Fanidakis, N., Baugh, C. M., Benson, A. J., et al. 2011, MNRAS, 410, 53
- Fanidakis et al. (2012) Fanidakis, N., Baugh, C. M., Benson, A. J., et al. 2012, MNRAS, 419, 2797
- Fanidakis et al. (2013) Fanidakis, N., Maccio, A. V., Baugh, C. M., Lacey, C. G., & Frenk, C. S. 2013, arXiv:1305.2199
- Francis & Bland-Hawthorn (2004) Francis, P. J., & Bland-Hawthorn, J. 2004, MNRAS, 353, 301
- Hennawi et al. (2006) Hennawi, J. F., Prochaska, J. X., Burles, S., et al. 2006, ApJ, 651, 61
- Hu et al. (2010) Hu, E. M., Cowie, L. L., Barger, A. J., et al. 2010, ApJ, 725, 394
- Hu et al. (2002) Hu, E. M., Cowie, L. L., McMahon, R. G., et al. 2002, ApJL, 568, L75
- Hu et al. (1999) Hu, E. M., McMahon, R. G., & Cowie, L. L. 1999, ApJL, 522, L9
- Hunter et al. (2007) Hunter, J. D. 2007, CSE, 9, 90
- Husband et al. (2013) Husband, K., Bremer, M. N., Stanway, E. R., et al. 2013, MNRAS, 432, 2869
- Jiang et al. (2011) Jiang, L., Egami, E., Kashikawa, N., et al. 2011, ApJ, 743, 65
- Jiang et al. (2013) Jiang, L., Egami, E., Mechtley, M., et al. 2013, ApJ, 772, 99
- Jiang et al. (2008) Jiang, L., Fan, X., Annis, J., et al. 2008, AJ, 135, 1057
- Jiang et al. (2007) Jiang, L., Fan, X., Vestergaard, M., et al. 2007, AJ, 134, 1150
- Kashikawa et al. (2007) Kashikawa, N., Kitayama, T., Doi, M., et al. 2007, ApJ, 663, 765
- Kashikawa et al. (2004) Kashikawa, N., Shimasaku, K., Yasuda, N., et al. 2004, PASJ, 56, 1011
- Kennicutt (1998) Kennicutt, R. C., Jr. 1998, ApJ, 498, 541
- Kim et al. (2009) Kim, S., Stiavelli, M., Trenti, M., et al. 2009, ApJ, 695, 80
- Kurk et al. (2007) Kurk, J. D., Walter, F., Fan, X., et al. 2007, ApJ, 669, 32
- Labbé et al. (2003) Labbé, I., Franx, M., Rudnick, G., et al. 2003, AJ, 125, 1107
- Mortlock et al. (2009) Mortlock, D. J., Patel, M., Warren, S. J., et al. 2009, A&A, 505, 97
- Nagao et al. (2005) Nagao, T., Kashikawa, N., Malkan, M. A., et al. 2005, ApJ, 634, 142
- Nagao et al. (2007) Nagao, T., Murayama, T., Maiolino, R., et al. 2007, A&A, 468, 877
- Nagao et al. (2004) Nagao, T., Taniguchi, Y., Kashikawa, N., et al. 2004, ApJL, 613, L9
- Ota et al. (2008) Ota, K., Kashikawa, N., Malkan, M. A., et al. 2008, arXiv:0804.3448
- Ouchi et al. (2005) Ouchi, M., Shimasaku, K., Akiyama, M., et al. 2005, ApJL, 620, L1
- Ouchi et al. (2008) Ouchi, M., Shimasaku, K., Akiyama, M., et al. 2008, ApJS, 176, 301
- Overzier et al. (2009) Overzier, R. A., Guo, Q., Kauffmann, G., et al. 2009, MNRAS, 394, 577
- Richards et al. (2006) Richards, G. T., Lacy, M., Storrie-Lombardi, L. J., et al. 2006, ApJS, 166, 470
- Ryan-Weber et al. (2009) Ryan-Weber, E. V., Pettini, M., Madau, P., & Zych, B. J. 2009, MNRAS, 395, 1476
- Ross et al. (2009) Ross, N. P., Shen, Y., Strauss, M. A., et al. 2009, ApJ, 697, 1634
- Schlafly & Finkbeiner (2011) Schlafly, E. F., & Finkbeiner, D. P. 2011, ApJ, 737, 103
- Shimasaku et al. (2003) Shimasaku, K., Ouchi, M., Okamura, S., et al. 2003, ApJL, 586, L111
- Springel et al. (2005) Springel, V., White, S. D. M., Jenkins, A., et al. 2005, Nature, 435, 629
- Steidel et al. (1996) Steidel, C. C., Giavalisco, M., Pettini, M., Dickinson, M., & Adelberger, K. L. 1996, ApJL, 462, L17
- Stiavelli et al. (2005) Stiavelli, M., Djorgovski, S. G., Pavlovsky, C., et al. 2005, ApJL, 622, L1
- Swinbank et al. (2012) Swinbank, J., Baker, J., Barr, J., Hook, I., & Bland-Hawthorn, J. 2012, MNRAS, 422, 2980
- Toshikawa et al. (2012) Toshikawa, J., Kashikawa, N., Ota, K., et al. 2012, ApJ, 750, 137
- Trainor & Steidel (2012) Trainor, R. F., & Steidel, C. C. 2012, ApJ, 752, 39
- Trenti et al. (2012) Trenti, M., Bradley, L. D., Stiavelli, M., et al. 2012, ApJ, 746, 55
- Utsumi et al. (2010) Utsumi, Y., Goto, T., Kashikawa, N., et al. 2010, ApJ, 721, 1680
- Venemans et al. (2007a) Venemans, B. P., McMahon, R. G., Warren, S. J., et al. 2007a, MNRAS, 376, L76
- Venemans et al. (2007b) Venemans, B. P., Röttgering, H. J. A., Miley, G. K., et al. 2007b, A&A, 461, 823
- Volonteri & Rees (2006) Volonteri, M., & Rees, M. J. 2006, ApJ, 650, 669
- Wake et al. (2011) Wake, D. A., Whitaker, K. E., Labbé, I., et al. 2011, ApJ, 728, 46
- Walter et al. (2012) Walter, F., Decarli, R., Carilli, C., et al. 2012, Natur, 486, 233
- Willott et al. (2005) Willott, C. J., Percival, W. J., McLure, R. J., et al. 2005, ApJ, 626, 657
- Zheng et al. (2006) Zheng, W., Overzier, R. A., Bouwens, R. J., et al. 2006, ApJ, 640, 574