Phonon structure in dispersion curves and density of states of massive Dirac Fermions
Abstract
Dirac fermions exist in many solid state systems including graphene, silicene and other two dimensional membranes such as are found in group VI dichalcogenides, as well as on the surface of some insulators where such states are protected by topology. Coupling of those fermions to phonons introduces new structures in their dispersion curves and, in the case of massive Dirac fermions, can shift and modify the gap. We show how these changes present in angular-resolved photoemission spectroscopy of the dressed charge carrier dispersion curves and scanning tunneling microscopy measurements of their density of states. In particular we focus on the region around the band gap. In this region the charge carrier spectral density no longer consists of a dominant quasiparticle peak and a smaller incoherent phonon related background. The quasiparticle picture has broken down and this leads to important modification in both dispersion curves and density of states.
pacs:
73.22 Pr, 71.38 Cn, 78.67.-nI Introduction
With the isolation of graphene,Novo1 ; Zhang a single layer of carbon atoms on a honeycomb lattice, the study of the properties of relativistic Dirac fermions has continued to intensify and has been extended to many other materials. An important example of a new class of materials which support massless helical Dirac fermions are topological insulators(TI).Hasan ; Moore1 ; Qi ; Bernevig ; Fu ; Moore2 ; Hsieh ; Chen1 ; Hsieh2 ; Hsieh3 These materials are insulators in their bulk but have metallic topological surface states consisting of an odd number of Dirac cones protected by time reversal invariance (TRI). Dirac fermions with finite mass are also found in some systems. A prominent example which has only relatively recently come to the forefront are single layer group VI dichalcogenides such as . Novo2 It consists of a layer of molybdenum atoms between two layers of sulfur in a trigonal arrangement without inversion symmetry. At the K and -K points of the honeycomb lattice Brillouin zone the Dirac valence and conduction bands are separated by a direct band gap which fall in the infrared and there is spin polarization of the bands due to a large spin orbit coupling. This material is considered ideal for valleytronicsXiao ; Zeng ; Mak ; Cao in which the valley index is manipulated in direct analogy to the spin degree of freedom for spintronics.Wolf ; Fabian A closely related single layered material is siliceneDrum ; Aufray ; Stille ; Ezawa1 ; Ezawa2 which is made of silicon atoms on a honeycomb lattice with one sublattice slightly shifted out of the plane of the other sublattice i.e. there is a buckling. Its model Hamiltonian can be considered as a subcase of that for involving however very different energy scales. Massive Dirac fermions are also found in bilayer graphene.Nicol1 ; Nicol2 The Dirac fermions seen in topological insulators can become massive when time reversal symmetry is violated through the introduction of magnetic dopants. This was done by Chen et.al. Chen2 in with as magnetic dopants. A composition can put the chemical potential inside the surface Dirac gap. An alternative is to use sufficiently thin topological insulator that top and bottom surfaces communicate through tunneling and this gaps the Dirac fermions on each of the two surfaces as discussed by Lu et.al.Lu A very different proposal to produce massive Dirac fermion was made by Ojanen and KitagawaOjanen using irradiation of a two dimensional spin orbit coupled electron gas with circular polarized THz electromagnetic waves. Finally we mention that in their angle-resolved photoemission spectroscopy (ARPES) study of the TI, , Sato et.al Sato go from a topological massless Dirac state in to a ordinary non-topological massive state in . As the system goes through a quantum phase transition (QPT) from topological to non-topological the Dirac fermions acquire a mass before reaching the non-topological state. While the mechanism by which mass is acquired is not yet known the authors suggest the possibility of spontaneous symmetry breaking as in a Higgs mechanism.
Coupling of massive Dirac fermions to an Einstein phonon modeled with a Holstein hamiltonian leads not only to the usual modification of the bare dispersion relations through an electron-phonon self energy but also modifiesLi1 ; asgari the gap itself which becomes complex and acquires energy dependence. This finding is analogous to Eliashberg theoryCarbotte1 ; Carbotte2 ; Carbotte3 of superconductivity which is a generalization of BCS theory. In Eliashberg theory, the details of the electron-phonon interaction responsible for the condensation into Cooper pairs are explicitly included rather than modeled by a constant pair potential of BCS theory. This leads to renormalizations in the single particle channel which gives a shift in the quasiparticle energies as well as provides a lifetime. In addition the pairing or gap channel is directly modified by the electron-phonon term and the gap which would be constant and real in BCS theory is now complex and energy dependent. In this paper we calculate the effect of electron-phonon coupling on the gapped Dirac dispersion curves measured in angular resolved photo emission spectroscopy (ARPES) and in the density of state which can be measured in scanning tunneling microscopy (STM).
In section II we provide the necessary formalism. Our numerical results for the case of Topological Insulators are found in Section III. Results specific to the single layer membrane and silicene are presented in section IV with a summary and conclusion in section V.
II Formalism
We begin with a two by two matrix Hamiltonian for the bare bands which is sufficiently general to describe topological insulators as well as single layer and silicene. This Hamiltonian is given by Eq. (1)
| (1) |
where is a valley index, is momentum and are Pauli matrices with the gap parameter. To describe single layer the spin orbit coupling , is the nearest neighbor hopping of with the lattice parameter and is the z-component of spin. The same form of this Hamiltonian applies to silicene dropping the in the last term which leads to equal spin splitting in valence and conduction band in contrast to where it is large in the valence band and small in the conduction band. The energy scales are however very different with of order as is also the gap which is now associated here with an electric field applied perpendicular to the two sublattice planes. To describe a topological insulator surface the last term is to be dropped () and the ’s are to be understood as real spins rather than the pseudospin of graphene, and silicene. Also the valley index is to take on a single value and spin degeneracy no longer arises. A Holstein hamiltonian has been widely used to describe the coupling of electrons to an Einstein phonon of energy and this will be sufficient here. It takes the form
| (2) |
where create a phonon of energy and momentum and an electron of momentum and spin . The coupling strength is . For this very simple model the interacting two by two matrix Matsubara Green’s function for the charge carriers
| (3) |
with
| (4) |
and
| (5) |
In these formulas and and are the quasiparticle and gap self energy corrections at Matsubara frequency . These quantities at temperature can be written as
| (6) |
and
| (7) |
Here and are fermion and boson distribution functions respectively and is the bare band quasiparticle energy . Note that in Eq. (7) is directly proportional to which appears linearly on the right hand side of the equation.
III Numerical results

As we saw in the previous section the electron-phonon interaction given by Eq. (2) leads to two self energy renormalizations in the Green’s function of Eq. (3). The quasiparticle self energy given by Eq. (6) renormalizes the bare energies in the denominator of Eq. (5) and remains even when the gap is set to zero. However there is also a second self energy correction of Eq. (7), not present for the case of massless Dirac fermions, which directly modifies the gap. It has both real and imaginary part and is frequency dependent. It is this frequency dependence in both and which carries the information about phonon structure and on how this structure manifests itself in the dynamics of the Dirac fermions. For simplicity we start with the case of massive Dirac fermions but with =0 in the bare band Hamiltonian of Eq. (1). In the top two frames of Fig. 1 we show respectively the renormalized self energy and as a function of . For illustrative purpose the chemical potential was set at =0.03 eV and the Einstein phonon energy =7.5 meV with a gap of 40 meV. Our choice of phonon frequency is motivated by the experimental finding of La Forge et.alForge who found phonon absorption feature in their infrared optical work at and . The theoretical work of Zhu et.alZhu1 identifies a dispersive surface phonon branch ending at 1.8THz which they associate with a strong Kohn anomaly indicative of a large electron-phonon interaction. This observation is further supported by the angular-resolved photoemission study of where the electron-phonon mass enhancement parameter is foundHofm to be 0.25 so that we can expect significant effects of the electron-phonon interaction in the properties of topological insulators. This provides a motivation for the present work. The electron-phonon coupling constant is set to be about 0.3, well within the range of the reported value of 0.25 in the reference [Hofm, ] and 0.43 in the reference [Zhu2, ]. The fermi surface falls, by arrangement, at =0. We see prominent logarithmic structure in the real part (solid curve) at with corresponding small jumps in the imaginary part (dashed curve). There are additional phonon induced signature at and . We note from the mathematical structure of Eq. (6) and Eq. (7) that these boson structures fall at precisely the same energies in both and . For the imaginary part there is a Dirac Delta function of the form which leads to jumps, as we have noted. By Kramers-Kronig relations these imply logarithmic type singularities in the real part. These phonon structure get directly mirrored in the Dirac spectral function which is given by
| (8) |
and works out to be
| (9) |
where and . The density of states follows as
| (10) |
We note that it is only the imaginary part of the quasiparticle self energy which broadens the Lorentzian form of Eq. (9). However both real and imaginary part of the gap self energy modify the gap which becomes an effective gap
| (11) |
and is now a frequency dependent quantity in sharp contrast to the bare band case for which it is a constant and equal to in magnitude. Also, in general the bare band density of state is independent of filling factor i.e. of the chemical potential . Introducing the electron-phonon interaction lifts this simplicity and the DOS is, in principle, different for each value of .
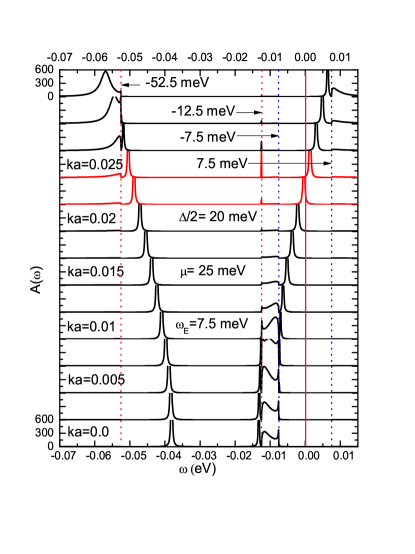
In the lower frame of Fig. 1 we present results for the density of states of gapped Dirac fermions vs. given in Eq. (10). The parameters are, chemical potential =30 meV above the center of the gap with 20 meV. The dashed curve includes renormalizations due to the coupling to phonons while the solid curve, given for comparison, is for the bare band. Some care is required in making such a comparison. The chemical potential of the interacting system () is not the same as for the bare band (). The two are related by the equation . From the lower frame of the top panel of Fig. 1 we find meV. This gives =35 meV so the gap in the bare band case falls between meV (bottom of conduction band) to meV (top of valence band). Including interactions further shifts the bottom of the conduction band to lower energies and the top of the valence band to higher energies. These shifts effectively reduce the band gap in the interacting case to about 25 meV as compared with a bare band value of 40 meV. A feature to be noted is that the value of the dressed density of states at =0 (vertical dashed line) remains unchanged from its bare band value as is known for conventional systems.Carbotte1 ; Carbotte2 ; Carbotte3 In addition we note sharp phonon structures originating from both and . These structures in the self energies and of top and middle frames are at , , and as identified in the figure. We emphasized that the last two structures, placed symmetrically around the Fermi surface at , are very familiar in metal physics. The other two at and are not. As noted, the top of the valence band has been shifted to higher energy by correlation effects but the shape of its profile is not very different. By contrast, the onset of the conduction band has a very much altered shape. In particular it shows sharp phonon structure at . Further, there is a prominent dip around . In the energy region between these two structures, electrons and phonon are strongly mixed by the interactions. This can be seen clearly in Fig. 2 where we show a plot of the Dirac fermion spectral function vs. of Eq. (9) for various values of momentum . This function is measured directly in angular-resolved photoemission spectroscopy. Fourteen values of are considered as indicated and each curve is restricted to the region below 600 for clarity. The solid vertical pink line identifies the fermi energy placed at . The vertical dotted blue lines are at and the dotted red lines identify . The two curves close to are shown as red. In both curves we see a well defined quasiparticle peak near . For the bare band we would have a Dirac delta function at . If some residual scattering rate is included, the delta function broadens into a Lorentzian form. When the electron-phonon interaction of Eq. (2) is included there are further shifts associated with the real part of and the gap is modified by both real and imaginary part of (see top and middle frame of Fig.1). In addition to the quasiparticle peak seen in the red curves of Fig. 2 there are also small incoherent phonon assisted side bands with onset at . As is increased beyond the phonon side band on the right hand side of the main quasiparticle peak becomes more prominent and as is decreased below it is the left side phonon assisted band which becomes stronger. As the quasiparticle peak falls at smaller energy with decreasing , the onset of the boson structure remains fixed in energy and eventually they meet. When this happens the phonon and the electron lose individual identity and merge into a composite whole. As is reduced towards zero the quasiparticle peak crosses the boson structure and we see that it re-emerges on the opposite side. It is clear from this discussion that the bottom of the conduction band falls precisely in the region where electron quasiparticle and phonon are not separately well defined. Instead the electron spectral density consists of a composite incoherent entity with no identifiable sharp quasiparticle peak. This situation is very different when the top of the valence band is considered. In this case, there appears a well defined quasiparticle peak near and consequently this region looks very much quasiparticle like. Of course as is increased the spectral density of the valence band starts to show a sideband with onset at , as the quasiparticle peak approaches more closely this energy.
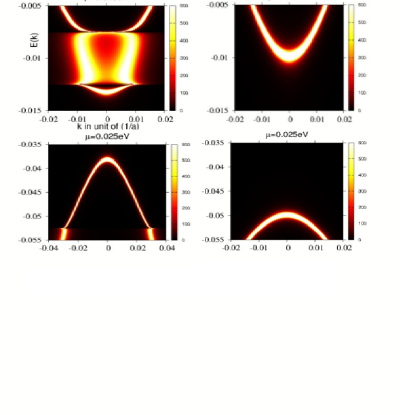
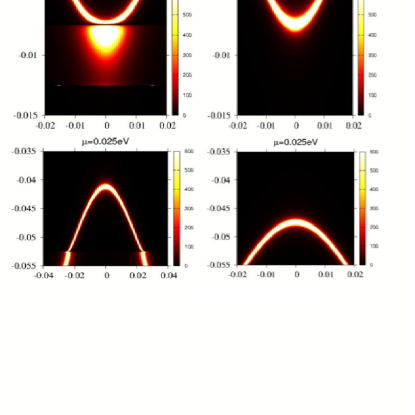
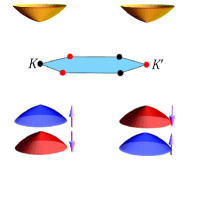
In frame (a) of Fig. 3 we show a color plot of the spectral density (, the dressed dispersion curves) for the bottom of the conduction band (top left) and for the top of the valence band (bottom left). In the right frames we show results for the corresponding bare band case with residual smearing meV. For the bare band the chemical potential has been shifted because renormalized () and bare () chemical potential are related by . In frame (b) we provide similar results but have halved the value of the electron-phonon coupling in Eq. (2), consequently the renormalization effects are smaller but still quite significant. Returning to the top left frame of panel Fig. 3(a) we noted the region of the conduction band between meV (dotted blue in Fig. 2) and meV (dotted red in Fig. 2) which showed complex changes due to the phonon. Below this region however we see a much more conventional type of gapped Dirac fermion dispersion curve which is recognizable as a distortion of a bare dispersion curves (shown on the right). This is also true for the valence band dispersion in the bottom left frame. Here it is only below -52.5 meV that significant phonon distortions can be seen. Analogous modifications of the Dirac fermion dispersion curves due to correlations have been observed in graphene.Bost1 ; Bost2 ; Walter When electron-electron interaction are accounted for in a random phase approximation to lowest order perturbation theory, one finds that the Dirac point at the intersection of valence and conductance band splits into two Dirac points with a plasmaron ring inserted in between. This represents resonant scattering between Dirac quasiparticles and plasmons (collective modes of the charge fluid) which are called plasmarons. Here it is the electron-phonon interaction which is involved instead. We hope the region where quasiparticles cease to be well defined excitations can be observed in future ARPES experiments.
IV Results specific to single layer and silicene
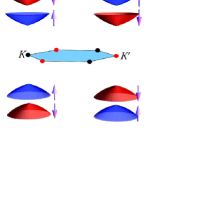
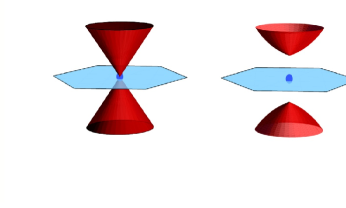
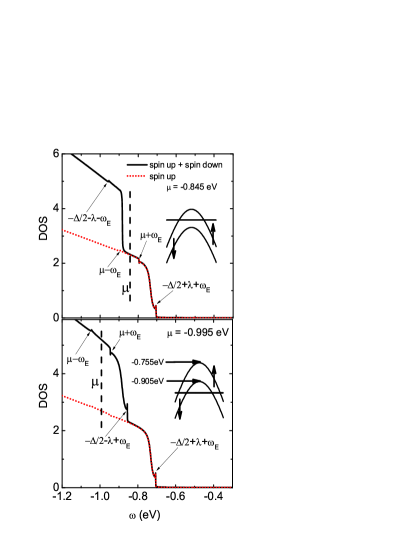
We turn next to the specific case of single layer .Li2 ; Chei ; Zhu ; Stille In this material both valence and conduction bands are spin polarized. This is shown schematically in the inset of the top panel of Fig. 4 for the valence band as well as in the bottom panel where valence and conduction bands are both shown schematically in color, spin up valence band in blue and down in red. We note that the spin splitting in the conduction band (in gold) is small and does not appear in the schematic. In a related material siliceneEzawa1 ; Ezawa2 the splitting is the same size in both bands (see lower panel of Fig. 6) as we will discuss later. It is the -1 in the last term of Eq. (1) which controls the amount of spin polarization seen in the conduction band and this term is missing in silicene. Our numerical results for the energy dependence of the valence band density of states (DOS) are shown in the top and bottom frame (top panel) for two values of chemical potential (see heavy black dashed vertical lines) respectively -0.845 and -0.995 mev. The electron-phonon coupling constant is set so that the mass enhancement parameter =0.1. In the first instance the chemical potential falls below the top of the spin up band but above the top of the spin down band while in the second instance the chemical potential falls below the top of both up and down valence bands. The density of states for the spin up band alone is shown as the heavy dotted red curve and for the combined up and down band by the solid black curve. The phonon structures are at , , and in the top frame and at , , and in the bottom frame. They are ordered according to the larger energy first. In addition to phonon kinks, the electron-phonon interaction has also shifted and modified the top of each of the two bands. As we have already seen there are two distinctly different behaviors which characterize the shape of the top (bottom) of these renormalized bands. We refer to the first as quasiparticle like. This designation applies to the spin up band in the top frame. The band edge rises smoothly although rather sharply. The second behavior seen is referred to as correlation dominated. It applies to the other three cases. Here a quasiparticle description ceases to be possible and a sharp phonon induced structure is associated with the ending of the band.
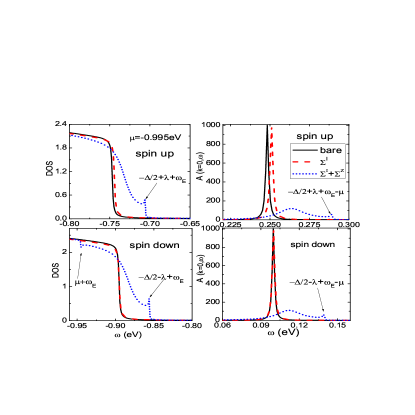
These issues are elaborated upon and better illustrated in Fig. 5 where we show a blow up of the band edges. For both top and bottom frame the chemical potential has a value of -0.995 eV and thus falls below the top of both spin up and spin down valence bands. The solid black curve is the bare band case and is shown for comparison with the dressed case. The long dashed red curves include only the quasiparticle self energy while the dotted blue curve includes in addition the gap renormalization . In both top and bottom frames we note that when we include only the quasiparticle self energy, the edge shifts slightly to higher energy but does not change its shape which remains characteristic of the existence of good Dirac quasiparticles as is the case for the bare bands. On the other hand, the dotted blue curve which includes gap renormalizations as well as quasiparticle self energy corrections has change radically as compared to the bare band. The shift of the edge to higher energies is greater and its shape is also very different. There is a sharp rise at and at for up and down bands respectively which is followed by a second rise of magnitude and shape much more comparable to that for the bare band. In the lower frame there is also a second phonon kink at .
In the right panel of Fig. 5 we show results for the spectral density at for the valence bands of the left hand frame. The solid black curve is for the bare band but includes a small constant scattering rate =1 meV so as to broaden the Dirac delta function of the pure case. The long dashed red curve is for the electron-phonon dressed band where we include only the quasiparticle self energy correction which renormalizes directly the bare quasiparticle energies. When gap self energy renormalization is additionally included we get the dotted blue curve which has entirely lost its sharp quasiparticle peak. The spectral density also shows a phonon peak at and at in top and bottom frame respectively. These kinks are directly mirrored in the DOS of the left hand frames. Of course we expect that it is not just the k=0 value of the spectral density that contributes to the density of state around the band edge but the results given are enough to understand how the band edge becomes modified from its bare band behavior.
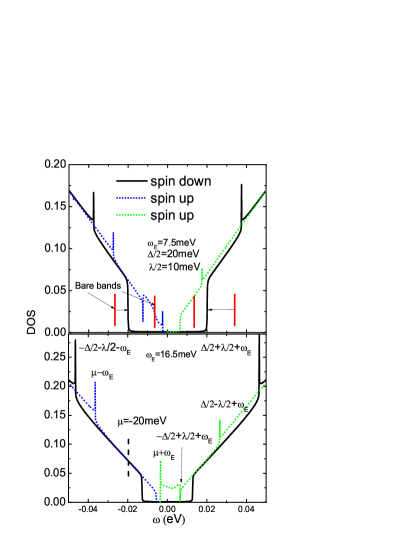
In Fig. 6 (top panel) we present additional results for the dressed density of state when the -1 in the last term of our Hamiltonian Eq. (1) is left out and we use much reduced energy scales with = 20 meV and =10 meV which is more representative of silicene (see illustrative figure in right hand frame). In both upper and lower frames the black solid line gives the contribution to the total DOS of the spin down band and the dotted of the spin up band. In this case the green and blue color apply to the conduction and valence band respectively. In the upper frame we employ a phonon energy of 7.5 meV and in the lower frame the Einstein energy is increased to 16.5 meV. We keep the electron-phonon coupling in Eq. (2) fixed. Comparing upper and lower frame shows that this increase in has lead to much more filling of the gap between valence and conduction band. In fact the band gap in the lower frame has almost closed. For comparison with the dressed case the band edges in the bare bands is shown as the heavy red vertical lines. It should be emphasized that increasing the value of the Einstein frequency () effectively increases the electron-phonon coupling because of the factor which appears in the numerator of Eq. (6) and Eq. (7) although there are certain amount of cancelations from the denominator containing . The electron-phonon mass renormalization is =0.3 for =7.5 meV and =0.45 for =16.5 meV. This change in the electron-phonon coupling is largely responsible for the near closing of the gap noted above.
V Summary and conclusions
Coupling of Dirac fermions to a phonon bath changes their dynamical properties. For momentum near the Fermi momentum well defined quasiparticles exist in the conduction band with energies shifted from bare to dressed value controlled by the real part of this self energy. The imaginary part of the quasiparticle self energy gives them a finite lifetime. In addition there are phonon sidebands to which part of the spectral weight under the spectral density has been transferred. The onsets of these sidebands are determined by the singularities in the self energy. For an Einstein optical phonon with energy , these onsets are found to be at , - on either side of the chemical potential. As momentum is moved away from , the energy of the renormalized quasiparticle peak approaches more closely these onset energies and the spectral weight transfer to the sidebands increases. Eventually the quasiparticle picture itself breaks down entirely and the spectral density takes on the appearance of a broad incoherent background with no sharp quasiparticle peaks. Electron and phonon are no longer individually defined and a Green’s function formalism as we have used here is needed for a proper description. Near , which corresponds to states near the top of the valence band and bottom of the conduction band with a gap in between for massive Fermions, we find that the spectral function can remain largely coherent and quasiparticle-like, while in other instances it can be quite incoherent. In the first case the density of states (DOS) near the gap edge retains the general characteristic of bare bands, while in the second case, the shape of the band edge becomes much more complex reflecting the incoherence due to correlations and the absence of dominant quasiparticle peaks.
In addition to the familiar quasiparticle self energy, in the case of gapped Dirac fermions, the electron-phonon interaction also renormalizes directly the gap through a new self energy which is complex and energy dependent. This self energy shifts up the top of the valence band, and shifts down the bottom of the conduction band, thus reduces the effective gap. It does not however introduce additional damping of the spectral density. We found that it is this self energy that plays the major role in reshaping the gap edges in the DOS making it go from coherent to incoherent behavior. The effects described here can be measured in angular-resolved photoemission spectroscopy (ARPES) and in scanning tunneling microscopy (STM).
Acknowledgements.
This work was supported by the Natural Sciences and Engineering Research Council of Canada (NSERC) and the Canadian Institute for Advanced Research (CIFAR).References
References
- (1) K. S. Novoselov, A. K. Geim, S. V. Morozov, D. Jiang, Y. Zhang, S. V. Dubonos, I. V. Grigorieva and A. A. Firsov, Science 306, 666 (2004).
- (2) X. Zhang, Y.-W. Tan, H. L. Stormer and P. Kim, Nature 438, 201 (2005).
- (3) M. Z. Hasan and C. L. Kane, Rev. Mod. Phys. 82, 3045 (2010).
- (4) J. E. Moore, Nature 464, 194 (2010).
- (5) X.-L. Qi and S.-C. Zhang, Physics Today 63, 33 (2010).
- (6) B. A. Bernevig, T. L. Hughes and S.-C. Zhang, Science 314, 1757 (2006).
- (7) L. Fu, C. L. Kane and E. J. Mele, Phys. Rev. Lett. 98, 106803 (2007).
- (8) J. E. Moore, Nature Phys. 5, 378 (2009).
- (9) D. Hsieh et. al. Nature(London) 452, 970 (2008).
- (10) Y.-L. Chen et.al, Science 325, 178 (2009).
- (11) D. Hsieh et.al, Science 323, 919 (2009).
- (12) D. Hsieh et.al, Nature(London) 460, 1101 (2009).
- (13) K. S. Novoselov, D. Jiang, F. Schedin, T. J. Booth, V. V. Khotkevich, S. V. Morozov, and A. K. Geim, Proc. Natl. Acad. Sci. USA 102, 10451(2005).
- (14) D. Xiao, G. B. Liu, W. Feng, X. Xu and W. Yao, Phys. Rev. Lett. 108, 196802 (2012).
- (15) H. Zeng, J. Dai, W. Yao, D. Xiao and X. Cui, Nature Nano. 7, 490 (2012).
- (16) K. F. Mak, K. He, J. Shan and T. F. Heinz, Nature Nano. 7, 494 (2012).
- (17) T. Cao, G. Wang, W. Han, H. Ye, C. Zhu, J. Shi, Q. Niu, P. Tan, E. Wang, B. Liu and J. Feng, Nature Communications. 3, 887 (2012).
- (18) S. A. Wolf, D. D. Awschalom, R. A. Buhrman, J. M. Daughton, S. von Molnar, M. L. Roukes, A. Y. Chtchelkanova and D. M. Treger, Science 294, 1488, (2001).
- (19) J. Fabian, A. Matos-Abiague, C. Ertler, P. Stano and I. Zutic, Acta Physica Slovaca 57, No.4,5, 565-907, (2007).
- (20) N. D. Drummond, V. Zólyomi, and V. I. Fal’ko, Phys. Rev. B. 85, 075423 (2012).
- (21) B. Aufray, A. Kara, S. Vizzini, H. Oughaddou, C. Léandri, B. Ealet and G. Lay, Appl. Phys. Lett. 96, 183102(2010).
- (22) L. Stille, C. J. Tabert and E. J. Nicol, Phys. Rev. B. 86, 195405 (2012).
- (23) M. Ezawa, New J. Phys. 14, 033003 (2012).
- (24) M. Ezawa, Phys. Rev. B. 86, 161407(R) (2012).
- (25) E. J. Nicol and J. P. Carbotte, Phys. Rev. B 77, 155409 (2008).
- (26) C. J. Tabert and E. J. Nicol, Phys. Rev. B 86, 075439 (2012).
- (27) Y. L. Chen et.al, Science 329, 659 (2010).
- (28) H.-Z. Lu, W.-Y Shan, W. Yao, Q. Niu and S.-Q. Shen, Phys. Rev. B 81, 115407 (2010).
- (29) T. Ojanen and T. Kitagawa, Phys. Rev. B. 85, 161202 (2012).
- (30) T. Sato, K. Segawa, K. Kosaka, S. Souma, K. Nakayama, K. Eto, T. Minami, Y. Ando and T. Takahashi, Nature Phys. 7, 840 (2011).
- (31) Zhou Li and J. P. Carbotte, unpublished.
- (32) K. Jahanbani and R. Asgari, Eur. Phys. J. B 73, 247 (2010).
- (33) J. P. Carbotte, Rev. Mod. Phys. 62, 1027 (1990).
- (34) B. Mitrovic and J. P. Carbotte, Can. J. Phys. 61, 758 (1983).
- (35) B. Mitrovic and J. P. Carbotte, Can. J. Phys. 61, 784 (1983).
- (36) A. D. LaForge, A. Frenzel, B. C. Pursley, T. Lin, X. Liu, J. Shi, and D. N. Basov, Phys. Rev. B 81, 125120 (2010).
- (37) X. Zhu, L. Santos, R. Sankar, S. Chikara, C. Howard, F. C. Chou, C. Chamon, and M. El-Batanouny, Phys. Rev. Lett. 107, 186102 (2011).
- (38) R. C. Hatch, M. Bianchi, D. Guan, S. Bao, J. Mi, B. B. Iversen, L. Nilsson, L. Hornekær, and P. Hofmann, Phys. Rev. B 83, 241303 (2011).
- (39) X. Zhu, L. Santos, C. Howard, R. Sankar, F. C. Chou, C. Chamon, and M. El-Batanouny, Phys. Rev. Lett. 108, 185501 (2012).
- (40) A. Bostwick, F. Speck, T. Seyller, K. Horn, M. Polini, R. Asgari, A. H. MacDonald, and E. Rotenberg, Science 328, 999 (2010)
- (41) A.Bostwick, T. Ohta, T. Seyller, K. Horn and E. Rotenberg, Nature Phys. 3, 36 (2007).
- (42) A. L. Walter, A. Bostwick, K. J. Jeon, F. Speck, M. Ostler, T. Seyller, L. Moreschini, Y. J. Chang, M. Polini, R. Asgari, A. H. MacDonald, K. Horn, and E. Rotenberg, Phys. Rev. B. 84, 085410 (2011).
- (43) Z. Li and J. P. Carbotte, Phys. Rev. B. 86, 205425 (2012).
- (44) T. Cheiwchanchamnangij and W. R. L. Lambrecht, Phys. Rev. B 85, 205302 (2012).
- (45) Z. Y. Zhu, Y. C. Cheng and U. Schwingenschlögl, Phys. Rev. B 84, 153402 (2011).