Now at]TRIUMF, Vancouver, BC V6T 2A3, Canada
First Results from the CARIBU Facility: Mass Measurements on the -Process Path
Abstract
The Canadian Penning Trap mass spectrometer has made mass measurements of 33 neutron-rich nuclides provided by the new Californium Rare Isotope Breeder Upgrade (CARIBU) facility at Argonne National Laboratory. The studied region includes the 132Sn double shell closure and ranges in from In to Cs, with Sn isotopes measured out to , and the typical measurement precision is at the 100 ppb level or better. The region encompasses a possible major waiting point of the astrophysical process, and the impact of the masses on the process is shown through a series of simulations. These first-ever simulations with direct mass information on this waiting point show significant increases in waiting time at Sn and Sb in comparison with commonly used mass models, demonstrating the inadequacy of existing models for accurate -process calculations.
pacs:
26.30.Hj, 29.25.Rm, 21.10.Dr, 27.60.+jIntroduction.—Neutron-rich radioactive nuclides have remained stubbornly inaccessible to precision study for decades, because while fission of heavy elements abundantly produces these nuclides, their chemistry prohibitively impedes the release of all but the most volatile elements from traditional bulky fission sources Van Duppen and Riisager (2011). The problem of chemistry dependence in neutron-rich beam production has been abated by the development of gas cells which can stop and thermalize reaction products in gas Äystö (2001), with the most efficient being the new radiofrequency (RF) gas catchers Wada et al. (2003); Savard et al. (2003). These developments have allowed comprehensive surveys of the properties of fission products to begin.
A key motivation for the study of these nuclides is the astrophysical rapid neutron-capture process ( process), which is thought to have produced half of the heavy nuclei in the universe E. M. Burbidge, G. R. Burbidge, W. A. Fowler, and F. Hoyle (1957); Cowan et al. (1991); Qian (2003); Arnould et al. (2007). The site of the process which populates the universe is not known, but is possibly within core-collapse supernovae or events which eject material from the crusts of neutron stars such as binary mergers. During an -process event, the balance between neutron capture and photodissociation reactions determines the distribution of isotope populations within each element, while decay moves nuclei to higher proton numbers. A critical nuclear physics input to the rate is the neutron separation energy () of the participant nucleus, and is calculated from the atomic masses of parent and daughter isotopes. Direct mass measurements made with Penning traps L. S. Brown and G. Gabrielse (1986) are only now reaching nuclides on possible -process paths. The Canadian Penning Trap mass spectrometer (CPT) Fallis et al. (2011); Van Schelt (2012); Lascar (2012) and other Penning traps have made precision mass measurements of progressively more neutron-rich nuclides Kankainen et al. (2012); Savard et al. (2006); Van Schelt et al. (2012) as the state of the art of gas-catcher technology has advanced.
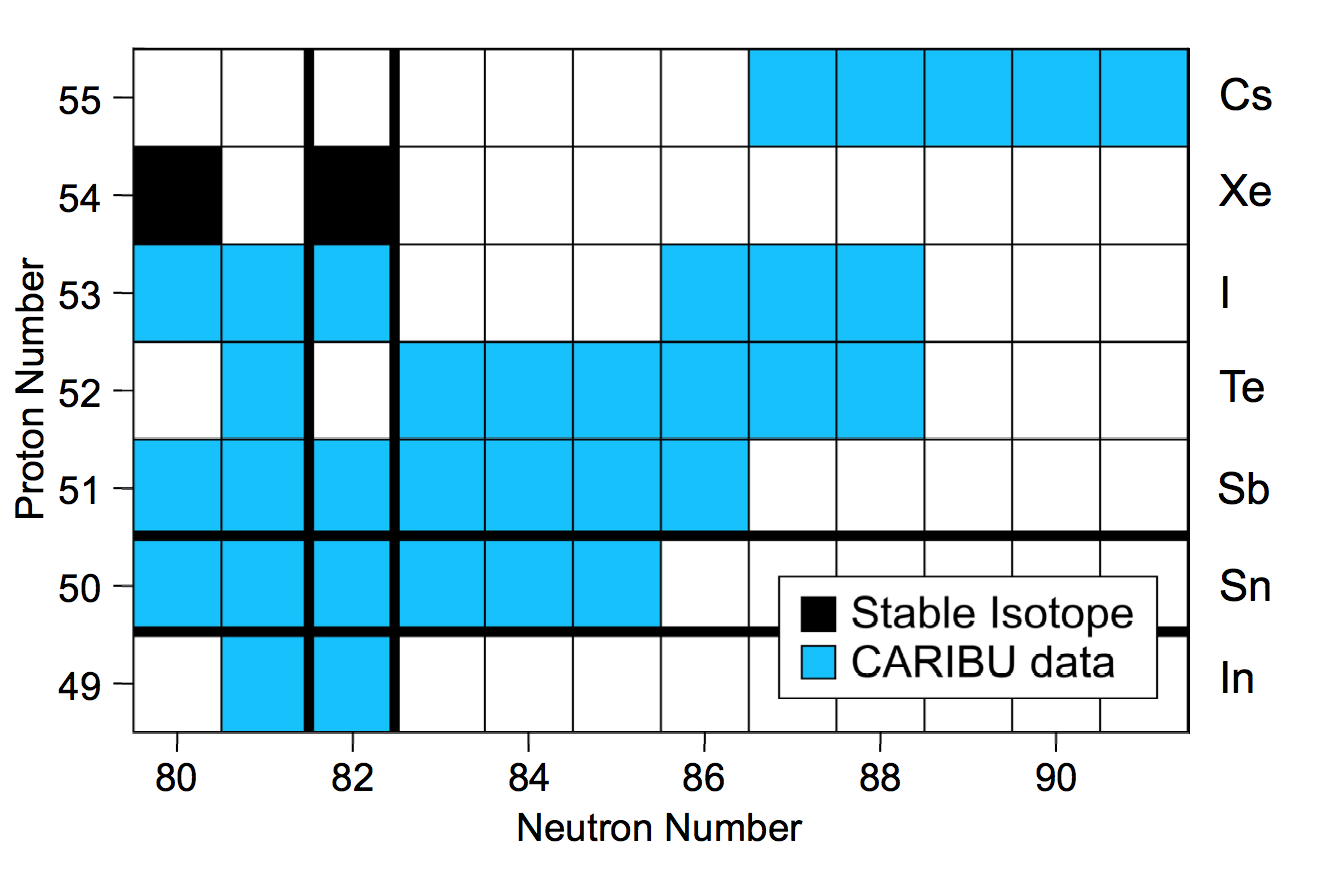
RF gas catchers are now sufficiently mature to justify new facilities dedicated to their beams. The new Californium Rare Isotope Breeder Upgrade (CARIBU) Savard et al. (2008) is the first such facility, now online. CARIBU uses a 252Cf spontaneous fission source in a large gas catcher to provide purified neutron-rich beams to either low-energy beam experiments or the Argonne Tandem-Linac Accelerator System (ATLAS) for reaccelerated beam experiments. This paper describes the first science results using beams from CARIBU: mass measurements made with the CPT of the 33 nuclides shown in Fig. 1, 12 of which improve the precision over earlier attempts.
The Measurements.—For the bulk of these measurements CARIBU used a 50 mCi fission source, providing beams to the CPT as intense as 4200 ions/s of 142Cs, cleaned by the isobar separator Davids and Peterson (2008) with a resolution of .
The CPT was moved to the CARIBU low-energy experimental area and recommissioned in 2011. Upgrades made during the move include the installation of a 133Cs+ ion source for calibration and tuning, and liquid nitrogen cooling of the preparation linear RFQ ion trap located just before the CPT. Ions are ejected from the CARIBU buncher every 100–200 ms, and are accumulated and cooled in the preparation trap until transfer to the CPT.
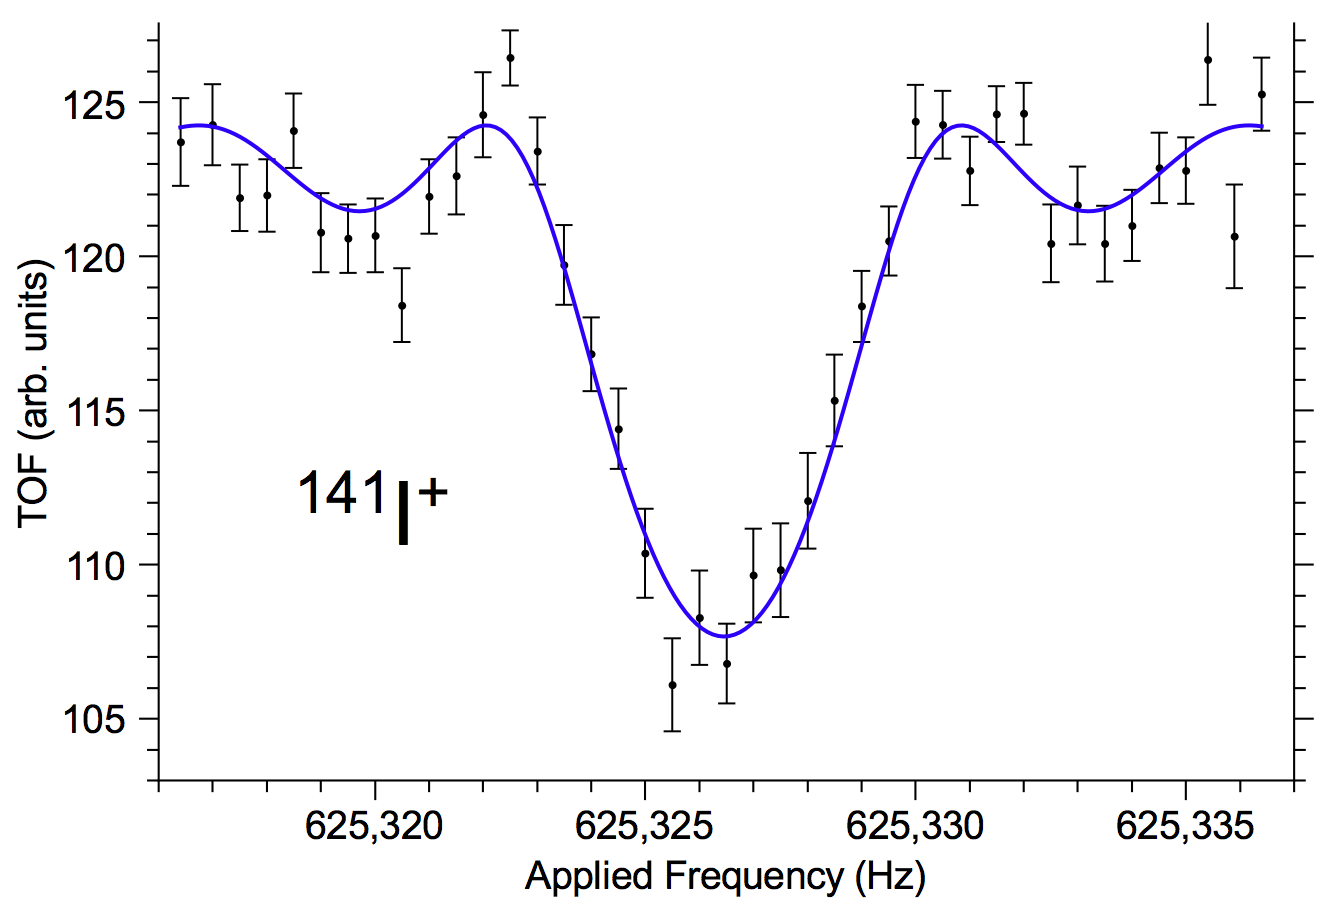
The CPT uses the time-of-flight ion cyclotron resonance method of Penning trap mass spectrometry for its measurements Gräff et al. (1980); Bollen et al. (1990); M. König, G. Bollen, H-J. Kluge, T. Otto, J. Szerypo (1995). The cyclotron frequency (where is charge, magnetic field strength, mass) is measured through successive attempts to resonantly convert ion bunches from slow to fast orbital motion. Ions are ejected out of the magnet to a detector, producing a time-of-flight versus applied frequency spectrum as shown in Fig. 2. The spectrum is fit with an approximation of the theoretical response in George et al. (2011), with the minimum time of flight occurring at the cyclotron frequency. The mass is then determined from the ratio of the measured cyclotron frequency of a well-known calibrant species to that of the species of interest.
A strength of Penning trap measurements is their small systematic errors Bollen et al. (1990), which were investigated again for the recommissioning of the CPT. The superconducting magnet’s field strength exhibited more scatter over time than before its move to CARIBU, such that the 11 ppb standard deviation among the calibrations was added as a systematic uncertainty to all measurements. Frequency shifts linear in mass difference are possible due to trap imperfections L. S. Brown and G. Gabrielse (1986), and a search found such a shift in the CPT, compensated for in the analysis by adjusting frequencies by ppb, where is the mass number of the unknown. Finally, the detected ion rate was targeted below 6 detected ions per bunch in the trap to prevent ion-ion interactions Bollen et al. (1992) from introducing significant systematic effects.
| Mass Excess of Neutral Atom (keV) | |||||||||||||
| Nuclide | CPT at CARIBU | CPT | ref. | ref. | ref. | ||||||||
| 130In | 0.977 576 25(16) | ||||||||||||
| 131In | 0.977 575 78(16) | Hakala et al. (2012) | |||||||||||
| 130Sn | 0.977 491 606(29) | Hakala et al. (2012) | Sikler et al. (2005) | ||||||||||
| 131Sn | 0.985 038 975(35) | Hakala et al. (2012) | Dworschak et al. (2008) | Sun et al. (2008) | |||||||||
| 132Sn | 0.992 568 893(22) | Hakala et al. (2012) | Dworschak et al. (2008) | ||||||||||
| 133Sn | 1.000 138 949(29) | Hakala et al. (2012) | Dworschak et al. (2008) | ||||||||||
| 134Sn | 1.007 698 87(13) | Hakala et al. (2012) | Dworschak et al. (2008) | ||||||||||
| 135Sn | 1.015 270 38(28) | Hakala et al. (2012) | |||||||||||
| 131Sb | 0.985 000 799(84) | Hakala et al. (2012) | |||||||||||
| 132Sb | 0.992 543 975(49) | Hakala et al. (2012) | Sun et al. (2008) | ||||||||||
| 133Sb | 1.000 073 87(10) | Hakala et al. (2012) | Chen et al. (2012) | ||||||||||
| 134Sb | 1.007 637 742(82) | Hakala et al. (2012) | |||||||||||
| 135Sb | 1.015 196 795(53) | Hakala et al. (2012) | Sun et al. (2008) | ||||||||||
| 136Sb | 1.022 763 00(12) | Hakala et al. (2012) | |||||||||||
| 137Sb | 1.030 322 96(42) | ||||||||||||
| 133Te | 1.000 041 770(52) | Hakala et al. (2012) | |||||||||||
| 135Te | 1.015 131 888(18) | Hakala et al. (2012) | Sun et al. (2008) | ||||||||||
| 136Te | 1.022 682 783(51) | Hakala et al. (2012) | Chen et al. (2012) | ||||||||||
| 137Te | 1.030 248 309(31) | Hakala et al. (2012) | Sun et al. (2008) | ||||||||||
| 138Te | 1.037 801 624(61) | Hakala et al. (2012) | Sun et al. (2008) | ||||||||||
| 139Te | 1.045 370 26(13) | Hakala et al. (2012) | |||||||||||
| 140Te | 1.052 923 64(50) | Hakala et al. (2012) | |||||||||||
| 133I | 1.000 017 873(52) | ||||||||||||
| 134I | 1.007 556 731(51) | ||||||||||||
| 135I | 1.015 083 028(17) | ||||||||||||
| 139I | 1.045 303 381(32) | Sun et al. (2008) | |||||||||||
| 140I | 1.052 866 85(10) | Sun et al. (2008) | |||||||||||
| 141I | 1.060 420 75(13) | Sun et al. (2008) | |||||||||||
| 142Cs | 1.067 859 61(17) | Ames et al. (1999) | |||||||||||
| 143Cs | 1.075 406 507(64) | ||||||||||||
| 144Cs | 1.082 966 39(25) | ||||||||||||
| 145Cs | 1.090 516 40(13) | Weber et al. (2008) | |||||||||||
| 146Cs | 1.098 078 820(69) | ||||||||||||
| An unknown mixture of the ground and isomer states | |||||||||||||
| Resolved from isomer, ground state mass shown | |||||||||||||
| Mass is the combined result for the CPT measurement in Van Schelt et al. (2012) and the new CARIBU data | |||||||||||||
| The value in Van Schelt et al. (2012) has been superseded by CARIBU data due to resolution of the two states present | |||||||||||||
| Distant isomer was not targeted; observed state is expected to be ground state | |||||||||||||
| Result has been adjusted by us due to a change in the calibration value after Ames et al. (1999). See Van Schelt et al. (2012) for details. | |||||||||||||
| Indicates an extrapolated mass value in the AME03 | |||||||||||||
Table 1 shows the masses measured by the CPT spectrometer. The known half-lives of these nuclides ranges down to 280 ms. For six of the nuclides—130,131Sn, 132,134Sb, 133Te, and 134I—isomeric states were also clearly observed in the trap, which will be discussed in a future publication. For two isotopes, 130,131In, isomeric states are expected to be present in the beam, but the CPT was unable either to resolve the states or to identify additional peaks, so no identification of the measured state or states has been made. Durations of the measurement excitations ranged from 0.1 s to 7 s, depending on the lifetime of the nuclide and the proximity of isomers in cyclotron frequency. Total mass uncertainty ranges from 2.1 to 62 keV/c2, with a median uncertainty of 8.6 keV/c2.
In comparison with the 2003 Atomic Mass Evaluation (AME03) values Wapstra et al. (2003); *AME03_2, the previously seen trend of direct mass measurement values being higher than the AME03 far from stability continues (see examples in Van Schelt et al. (2012); Fallis et al. (2011); Kankainen et al. (2012); Hager et al. (2006, 2007); Neidherr et al. (2009)). This is likely due to systematic flaws in the -endpoint measurements which previously dominated mass information in this region Hardy et al. (1977). Also listed in Table 1 are comparisons to other direct measurements. The agreement for the 7 nuclides measured by both the CPT and ISOLTRAP Ames et al. (1999); Weber et al. (2008); Sikler et al. (2005); Dworschak et al. (2008) is excellent. The 19 common ground-state measurements with JYFLTRAP Hakala et al. (2012) are mostly in agreement, but with 2 masses—of 133Te and 140Te—disagreeing by 5.6 and 3.2 , respectively. Measurements of these two isotopes were repeated in separate runs at the CPT, and gave consistent results. The known isomer in 133Te is well-resolved, and no known isomers are expected to interfere with the ground state measurements of either 133Te or 140Te. The cause of the disagreements remains unknown. Finally, the overlap with the 9 ground states measured in the FRS-ESR ring Sun et al. (2008); Chen et al. (2012) are in fair agreement, with two—136Te and 141I—disagreeing by 2.0 and 2.9 , respectively.
Astrophysics impact.—The bulk of the neutron captures in the process are thought to occur on timescales of order s in environments of temperature GK and neutron density cm-3 Qian (2003). In that time, seed material from the nickel region must, through neutron capture and decay, be processed up through the heavy elements to explain the observed elemental abundances. Because decay is the process that moves material to higher proton numbers, the -decay lifetimes of the nuclei involved determine how quickly the heaviest elements can be reached. The balance between neutron capture and photodissociation reactions determines the distribution of isotope populations within each element in a high-temperature -process. In hotter environments, increased rates push this distribution closer to stability, and thus to nuclides with longer -decay lifetimes. At higher neutron densities, higher rates have the opposite effect.
Due to the scarcity of direct mass measurements on the -process path, theoretical nuclear mass models are used to provide the inputs needed for rate calculations. Unfortunately, even the most accurate mass models have RMS mass errors near 500 keV/c2 for known nuclei Möller et al. (2012); Goriely et al. (2010); Lunney et al. (2003), which, as is shown below, is insufficient for accurate -process simulations. Some of the nuclides with masses measured here—particularly isotopes of Sn and Sb—are on the -process path for certain environmental conditions. For those paths the measured Sn isotopes are among the nuclides with the longest -decay lifetimes and are in a position to limit the progress of material to the heaviest elements. Never before has the waiting time at this critical point on the -process path been calculated from directly measured accurate masses for realistic conditions.
We performed therefore a series of focused -process simulations to determine the waiting times at Sn and Sb for a span of conditions, using both this new mass information and, for comparison, three commonly used mass models: the Finite Range Droplet Model of 1995 (FRDM95) Möller et al. (1995), the Extended Thomas-Fermi plus Strutinksy Integral with enhanced Quenching model (ETFSI-Q) Pearson et al. (1996), and the recent Hartree-Fock-Bogoliubov-21 model (HFB-21) Goriely et al. (2010). The code used is one modified from that used earlier by this group in a similar -process calculation Clark et al. (2007). Within a given simulation run, the temperature and neutron density of the -process environment are fixed. An initial population of nuclei is set on the low- side at , and then the , , and -decay processes are allowed to run over all appreciably populated isotopes of the simulated element. The and rates come from the mass-model-based calculations of Rauscher and Thielemann Rauscher and Thielemann (2000), which accept values as input parameters for the rates. Because isotopes beyond those measured by the CPT participate to some extent for all simulated environmental conditions, AME03 masses were used for lower- isotopes, and mass model values for higher-. To isolate the effect of the differences between each model and the experimental masses, simulations were run with each of the mass models appended to the CPT data. Separate simulations were run with each mass model used as inputs. -decay half-lives were taken from NuBase Audi et al. (2003b) where available, and model-based half-lives Möller et al. (2003) were used for 138Sn, 138Sb, and beyond, scaled to match smoothly onto the known values. The simulations were run until half of the material had -decayed, providing a measure of the waiting time via this “effective” half-life in each condition. Simulations were run at 1.5 GK as a representative case, and were repeated over a span of neutron densities until the new masses were no longer relevant.
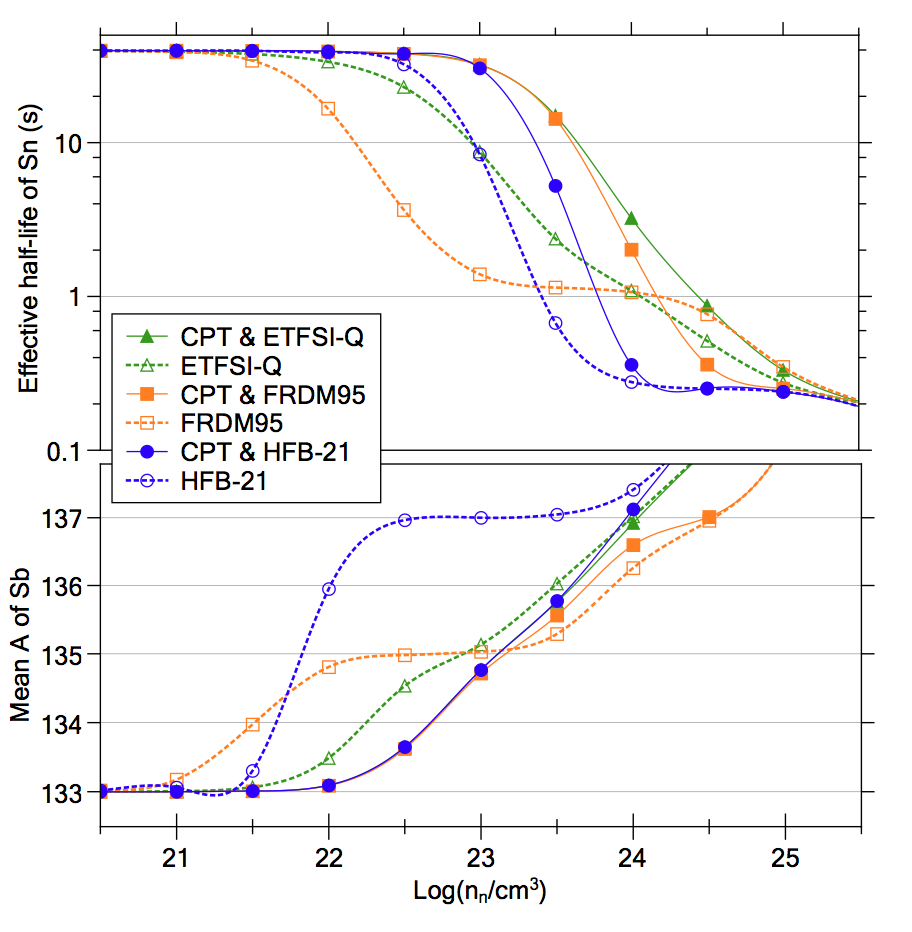
Each mass-model-based simulation shows overly favorable prospects for moving past Sn, approaching a 1 s effective half-life at lower densities than the CPT-based simulations, as shown in the top of Fig. 3. This is due to the neutron separation energies of certain nuclei being too large in the mass models, impeding the reactions that would push material to longer-lived nuclei. In the ETFSI-Q case, this is caused mainly by a 350-keV error in the of 133Sn. The effect is more drastic for the FRDM95, which overestimates of both 133,134Sn by 260 and 635 keV, respectively, followed by an underestimation for 135Sn by 340 keV. The combined effect of these is a prolonged span of densities for which 134Sn is the dominant isotope, with its -s half-life setting the timescale. The effect in HFB-21 starts at higher density than in the other models but is sharper. The delay is due to a small undershot in the of 133Sn, and the rapid drop is started by a 604-keV error in 134Sn. The mass models disagree with each other at 136Sn over a span of 839 keV, which induces the differences among the CPT-based simulations apparent in the plot. Simulations at other temperatures showed the same effects but at higher density for higher temperatures, as expected.
Similar effects emerged from the simulations of Sb, but the effective half-life is nearly always shorter at Sn than Sb over the relevant conditions. Therefore plotted in the bottom of Fig. 3 is the mean mass number of the Sb populations at the end of each simulation, to illustrate the impact on -process abundances. There is a drastic effect in the HFB-21 simulations caused by an apparent lack of pairing around the neutron shell closure and consecutive 812 and 628 keV errors in the of 136,137Sb, which almost instantly drives all material from the 133Sb to 137Sb, an error of nearly 4 masses. Because this change is at low neutron densities the primary effect will be during freezeout, the time during which final -process abundances (the only available -process observable) are being determined.
These simulations provide a demonstration of the insufficiency of existing mass models for accurate -process simulations. Progress in the development of mass models is slow, with the FRDM accuracy improving by over the last 17 years Möller et al. (2012) and the HFB models over 9 years Samyn et al. (2002); Goriely et al. (2010), for example. Therefore without considerable improvements in nuclear theory, direct mass measurements may be the only sufficiently accurate source of inputs to -process simulations for the foreseeable future.
In an actual -process event, the temperature and density will both be evolving rapidly as the material expands and reactions take place. These new results then provide a threshold of density which, for any given temperature, must be crossed in order to achieve a waiting time of s or less at Sn and move significant quantities of material to before the -process event ends. Isotopes two neutrons farther from stability may be studied at CARIBU after installation of a 1 Ci fission source. This would extend Sn measurements as far as 137Sn, which—with its 273-ms half life—will set even stronger constraints on the -process environment.
Acknowledgments.—The authors acknowledge J. W. Truran and C. Ugalde for their helpful discussions regarding the simulations. This work was performed under the auspices of NSERC, Canada, application number 216974, and the U.S. DOE, Office of Nuclear Physics, under Contract No. DE-AC02-06CH11357.
References
- Van Duppen and Riisager (2011) P. Van Duppen and K. Riisager, J. Phys. G: Nucl. Part. Phys. 38, 024005 (2011).
- Äystö (2001) J. Äystö, Nucl. Phys. A 693, 477 (2001).
- Wada et al. (2003) M. Wada et al., Nucl. Instrum. Methods B 204, 570 (2003).
- Savard et al. (2003) G. Savard et al., Nucl. Instrum. Methods B 204, 582 (2003).
- E. M. Burbidge, G. R. Burbidge, W. A. Fowler, and F. Hoyle (1957) E. M. Burbidge, G. R. Burbidge, W. A. Fowler, and F. Hoyle, Rev. Mod. Phys. 29, 547 (1957).
- Cowan et al. (1991) J. J. Cowan, F.-K. Thielemann and J. W. Truran, Phys. Rep. 208, 267 (1991).
- Qian (2003) Y.-Z. Qian, Prog. Part. Nucl. Phys. 50, 153 (2003).
- Arnould et al. (2007) M. Arnould, S. Goriely and K. Takahashi, Phys. Rep. 450, 97 (2007).
- L. S. Brown and G. Gabrielse (1986) L. S. Brown and G. Gabrielse, Rev. Mod. Phys. 58, 233 (1986).
- Fallis et al. (2011) J. Fallis et al., Phys. Rev. C 84, 045807 (2011).
- Van Schelt (2012) J. Van Schelt, Precision Mass Measurements of Neutron-Rich Nuclei, and Limitations on the r-Process Environment, Ph.D. thesis, The University of Chicago (2012), ProQuest/UMI 3526988.
- Lascar (2012) D. Lascar, Precision Mass Measurements of Short Lived, Neutron Rich, R-Process Nuclei About the N=82 Waiting Point, Ph.D. thesis, Northwestern University (2012), ProQuest/UMI 3547913.
- Kankainen et al. (2012) A. Kankainen, J. Äystö and A. Jokinen, J. Phys. G: Nucl. Part. Phys. 39, 093101 (2012).
- Savard et al. (2006) G. Savard et al., Int. J. Mass Spectrom. 251, 252 (2006).
- Van Schelt et al. (2012) J. Van Schelt et al., Phys. Rev. C 85, 045805 (2012).
- Savard et al. (2008) G. Savard et al., Nucl. Instrum. Methods B 266, 4086 (2008).
- Davids and Peterson (2008) C. N. Davids and D. Peterson, Nucl. Instrum. Methods B 266, 4449 (2008).
- Gräff et al. (1980) G. Gräff, H. Kalinowsky and J. Traut, Z. Phys. A 297, 35 (1980).
- Bollen et al. (1990) G. Bollen et al., J. Appl. Phys. 68, 4355 (1990).
- M. König, G. Bollen, H-J. Kluge, T. Otto, J. Szerypo (1995) M. König, G. Bollen, H-J. Kluge, T. Otto, J. Szerypo, Int. J. Mass Spectrom. Ion Processes 142, 95 (1995).
- George et al. (2011) S. George et al., Int. J. Mass Spectrom. 299, 102 (2011).
- Bollen et al. (1992) G. Bollen et al., Phys. Rev. C 46, R2140 (1992).
- Wapstra et al. (2003) A. H. Wapstra, G. Audi and C. Thibault, Nucl. Phys. A 729, 129 (2003).
- Audi et al. (2003a) G. Audi, A. H. Wapstra and C. Thibault, Nucl. Phys. A 729, 337 (2003a).
- Hakala et al. (2012) J. Hakala et al., Phys. Rev. Lett. 109, 032501 (2012).
- Ames et al. (1999) F. Ames et al., Nucl. Phys. A 651, 3 (1999).
- Weber et al. (2008) C. Weber et al., Nucl. Phys. A 803, 1 (2008).
- Sikler et al. (2005) G. Sikler et al., Nucl. Phys. A 763, 45 (2005).
- Dworschak et al. (2008) M. Dworschak et al., Phys. Rev. Lett. 100, 072501 (2008).
- Sun et al. (2008) B. Sun et al., Nucl. Phys. A 812, 1 (2008).
- Chen et al. (2012) L. Chen et al., Nucl. Phys. A 882, 71 (2012).
- Audi et al. (2012) G. Audi et al., Chin. Phys. C36, 1287 (2012).
- Wang et al. (2012) M. Wang et al., Chin. Phys. C36, 1603 (2012).
- Hager et al. (2006) U. Hager et al., Phys. Rev. Lett. 96, 042504 (2006).
- Hager et al. (2007) U. Hager et al., Phys. Rev. C 75, 064302 (2007).
- Neidherr et al. (2009) D. Neidherr et al., Phys. Rev. C 80, 044323 (2009).
- Hardy et al. (1977) J. C. Hardy et al., Phys. Lett. B 71, 307 (1977).
- Möller et al. (2012) P. Möller et al., Phys. Rev. Lett. 108, 052501 (2012).
- Goriely et al. (2010) S. Goriely, N. Chamel and J. M. Pearson, Phys. Rev. C 82, 035804 (2010).
- Lunney et al. (2003) D. Lunney, J. M. Pearson and C. Thibault, Rev. Mod. Phys. 75, 1021 (2003).
- Möller et al. (1995) P. Möller et al., At. Data Nucl. Data Tables 59, 185 (1995).
- Pearson et al. (1996) J. M. Pearson, R. C. Nayak and S. Goriely, Phys. Lett. B 387, 455 (1996).
- Clark et al. (2007) J. A. Clark et al., Phys. Rev. C 75, 032801 (2007).
- Rauscher and Thielemann (2000) T. Rauscher and F.-K. Thielemann, At. Data Nucl. Data Tables 75, 1 (2000).
- Audi et al. (2003b) G. Audi et al., Nucl. Phys. A 729, 3 (2003b).
- Möller et al. (2003) P. Möller, B. Pfeiffer and K.-L. Kratz, Phys. Rev. C 67, 055802 (2003), values retrieved from http://t16web.lanl.gov/Moller/publications/tpnff.dat.
- Samyn et al. (2002) M. Samyn et al., Nucl. Phys. A 700, 142 (2002).