A method for assigning satellite lines to crystallographic sites in rare earth crystals
Abstract
We describe an experimental technique for associating the satellite lines in a rare earth optical spectrum caused by a defect with the rare earth ions in crystal sites around that defect. This method involves measuring the hyperfine splitting caused by a magnetic dipole-dipole interaction between host ions and a magnetic defect. The method was applied to Ce3+:EuCl6H2O to assign 13 of the outermost 22 satellite lines to sites. The assignments show that the optical shift of a satellite line is loosely dependent on the distance to the dopant. The interaction between host and dopant ions is purely dipole-dipole at distances greater than 7 Å, with an additional contribution, likely superexchange, at distances less than 7 Å.
pacs:
42.50.Ex, 76.30.Kg, 61.72.S-I Introduction
The optical spectra of rare earth ions in crystals commonly display satellite lines: multiple weak lines arrayed on either side of the optical main line and separated from it by up to terahertz. These satellite lines arise from rare earth ions in sites neighboring to point defects such as chemical impurities. Frequently, the defects causing satellite line structure in a rare earth crystal are other rare earth impurities, and in the case where the optically active rare earth ion itself is a dopant, satellite lines arise from neighboring pairs of dopant ions.
Satellite lines provide an opportunity to probe the direct neighborhood of a defect, and are often used to identify, and characterize, defects in crystals cone93 ; jaaniso94 ; yamaguchi99 . In rare earth doped crystals, ion-pair satellite lines allow energy-transfer and resonant electronic interactions between closely separated ions to be studied vial79 . Because each pair site is due to ions with a fixed separation, the distance dependence of interactions can be determined from measurements on many different satellite lines. In Pr3+:LaF3, for example, energy transfer between Pr3+ ions separated by more than 4.2Å is predominantly due to an electric dipole dipole interaction vial82 ; hegarty82 , but at shorter distances, there is a substantial additional contribution from another mechanism, attributed to superexchange vial82 ; morgan85 . A better understanding of these nearest-neighbor interactions is useful for practical applications, such as lasers, because even if the proportion of rare earth ions in pair sites is small, they can be the dominant source of up-conversion and fluorescence quenching processes birgeneau69 .
Satellite lines have also been suggested as a way of making a frequency-addressed, ensemble-based quantum computing system that can be scaled to moderate numbers of qubits sellars04 . This quantum computing scheme requires a crystal stoichiometric in the rare earth ion of interest, such as Eu3+, and doped lightly with another rare earth. Satellite lines in such a material arise from Eu3+ ions surrounding dopant ions, with each satellite line due to an ensemble of Eu3+ ions in a unique position relative to the dopant ions. Using these satellite lines as qubits has the twin advantages of a high density of ions in each ensemble qubit and very strong, homogeneous interactions between qubits, which arise because the separation of ions in one qubit from their partners in another qubit are of the order of angstroms. Additionally, rare earth ions in solids can have very long optical and nuclear coherence times, and have long been considered a good platform for quantum computing pryde00 ; lukin00 ; ichimura01 ; shahriar02 ; ohlsson02 .
A common difficulty when studying interactions between rare earth ions in satellite lines, which also hampers experimental demonstrations of quantum computing in stoichiometric materials where these interactions are used to enact multi-qubit gates, is the difficulty in determining the crystallographic site around a dopant to which a particular satellite line is due. Site assignments have only been achieved in a small number of high symmetry materials, in which it is possible to exploit the symmetry to assign sites jaaniso94 ; wietfeldt85 ; jouart85 . In this paper, we describe a method for assigning satellite lines caused by a magnetic defect to crystallographic sites that is applicable to all symmetries: satellite lines are assigned by measuring the effect of the magnetic dipole-dipole interaction between defect and rare earth ions on the ground state hyperfine structure of the rare earth ion.
To demonstrate the method, site assignments were performed for satellite lines caused by Ce3+ in EuCl6H2O. As the satellite line structure of rare earth doped EuCl6H2O changes only by a scaling factor for different dopants, these assignments apply to all rare earth doped EuCl6H2O crystals. EuCl6H2O was chosen because it is a good candidate for the stoichiometric quantum computing scheme described above, as it can have long coherence times when fully deuterated and has the narrowest optical inhomogeneous linewidth of any stoichiometric solid, allowing a high density of ions in each prepared ensemble qubit. The site assignments presented here will allow the interactions between different satellite lines to be measured and characterized, and the performance of multi-qubit gates enacted using these interactions to be estimated.
II Theoretical background
EuCl6H2O is a monoclinic crystal with crystal symmetry and C2 symmetry at the Eu3+ site bel`skii65 ; kepert83 . The two Eu3+ isotopes, 151Eu and 153Eu, have nuclear spin and the singlet optical ground (7F0) and excited (5D0) states are split into three doubly degenerate hyperfine levels in zero magnetic field, with splittings of the order of 50 MHz ahlefeldt13a . The hyperfine structure of a single optical transition can be described by a spin Hamiltonian of the form macfarlane87 :
| (1) |
with B the magnetic field, the nuclear spin operator,
| (5) | ||||
| the enhanced nuclear Zeeman tensor, and | ||||
| (9) | ||||
the effective quadrupole tensor. In Equations (5) and (9), is a rotation matrix in three Euler angles, of the form given in Ref. longdell06, . The C2 symmetry of the Eu3+ site constrains one of the three principal axes of both M and Q to lie along the crystal C2 axis. The orientation of the C2 axis relative to the axis of the coordinate system used is given by the Euler angles and . The spin Hamiltonian of the optical ground and excited states of Eu3+ in EuCl6H2O has been characterized previously.
To assign satellite lines to crystallographic sites in EuCl6H2O, the crystal was doped with Ce3+, a Kramers dopant. The presence of a Kramers dopant has been shown to lead to superhyperfine splitting of the ground state hyperfine levels that differs for different satellite lines, with the size of the splitting commensurate with a magnetic dipole-dipole interaction between the electronic moment of the Kramers dopant ion and the nuclear moment of the Eu3+ ions ahlefeldt10 . Assuming a magnetic dipole-dipole interaction, the spin Hamiltonian of the coupled Ce3+–Eu3+ system is the spin Hamiltonian in Equation (1) with two additional terms, the Zeeman Hamiltonian of the dopant and the dipole dipole interaction:
| (10) |
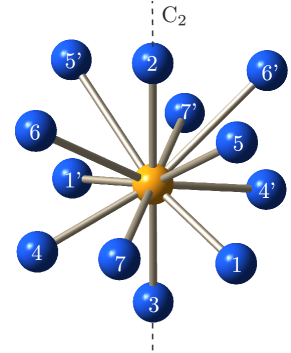
In this equation and are the electron spin operator and Zeeman tensor of Ce3+ respectively and is the magnetic dipole-dipole interaction. The dipole-dipole interaction is dependent on the position of the Eu3+ ion relative to the dopant, given by the site index , meaning that different satellite lines, which are due to different crystallographic sites, will have different hyperfine splittings. The Eu3+ ion positions around a dopant ion in EuCl6H2O are shown in Figure 1. The sites are labeled according to their distance from the dopant ion.
The dipole-dipole interaction can be written
| (11) |
where is the position vector joining the Eu3+ and Ce3+ sites, which can be determined for each site from the crystal structure kepert83 . The Zeeman tensor of Ce3+, which has the same form as Equation (5), has been measured in YCl6H2Oschulz67 . The Zeeman tensor components were measured to be GHz/T, GHz/T, and GHz/T, with one principal axis () lying along the crystal C2 axis, while the others lie in the (010) plane with the axis corresponding to 21∘ clockwise from [100]. As YCl6H2O is isostructural with EuCl6H2O and the two rare earth ions are fairly similar in radius, the electronic magnetic moment of Ce3+ in EuCl6H2O will be very similar to that of Ce3+ in YCl6H2O.
III Experimental method
Satellite lines were assigned to crystallographic sites in 0.1% Ce3+:EuCl6H2O by recording the hyperfine splitting of each satellite line as an external magnetic field was rotated about the sample and fitting this rotation pattern to the spin Hamiltonian of Equation (10) to determine the site index .
The experimental method used was similar to that reported previouslyahlefeldt13a . The 0.1%Ce3+:EuCl6H2O crystal used was grown from a water solution using 99.999% CeCl7H2O and EuCl6H2O starting materials. The crystal was mounted in a set of three-axis superconducting coils with the [100] axis approximately parallel to the axis of the superconducting coils and the laser direction, and the [010] direction approximately aligned with the axis of the coils. The laser was polarized along the crystal C2 axis, [010].
The sample was cooled to approximately 2 K in a helium bath cryostat, and the external magnetic field was rotated in a spiral in 200 steps about the sample given by
| (12) |
for ranging from to . The hyperfine structure was recorded with Raman heterodyne double resonance spectroscopy mlynek83 . A Coherent 699-29 dye laser tuned to the 7FD0 transition at 517148.5 GHz was used to supply the optical field needed for Raman heterodyne spectroscopy, while a small 8-turn coil mounted around the crystal inside and coaxial with the axis of the superconducting coils was used to supply an rf field. An rf signal of approximately 0.1 mT was generated with an HP Spectrum Analyzer connected to a 40 W rf amplifier. The combination of optical and rf fields results in coherent emission at the sum and difference frequencies of the two fields, which was detected as a beat on the transmitted laser light by the same spectrum analyzer that was used to generate the rf field.
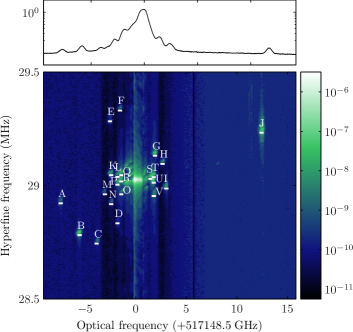
A two-dimensional Raman heterodyne double resonance spectrum of 0.1% Ce3+:EuCl6H2O is shown in Figure 2. The satellite lines for which rotation patterns were recorded are labeled in this figure. Initially, rotation patterns for the 27 and 29 MHz hyperfine ground state transitions of 151Eu3+ were recorded with mT in the center of the optical line at 517148.5 GHz, where the signal is due to Eu3+ ions unperturbed by Ce3+. This allowed the orientation of the magnet coordinate frame relative to that of the previous spin Hamiltonian characterization ahlefeldt13a to be determined. Following this, rotation patterns were recorded for only the 29 MHz hyperfine ground state transition for the 22 labeled satellite lines in Figure 2 with mT. A smaller applied magnetic field was used for the satellite lines because it results in larger differences between the rotation patterns of different satellite lines.
IV Results
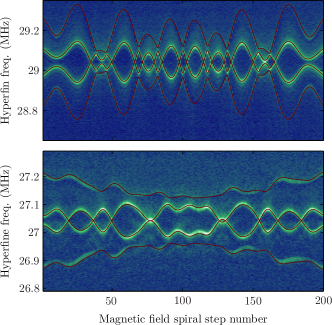
Raman-heterodyne-detected rotation patterns about the 27 and 29 MHz ground state transitions of 151Eu3+ in 0.1% Ce3+:EuCl6H2O are shown in Figure 3. These rotation patterns are described by Equation (1) and the spin Hamiltonian parameters given in Ref. ahlefeldt13a, . The red lines in this figure are a fit to the data using this spin Hamiltonian. The parameters in the fit are three Euler angles , , and that describe a rotation matrix that rotates the magnetic field into a coordinate frame fixed with respect to the crystal axes: ([100],, ). The fit shown in Figure 3 gave , and , which is reasonable given that aligning the crystal with the magnetic field coils by eye is only accurate to . While this fit gives the alignment of the magnetic field relative to the crystal axes, there is still an uncertainty of in the orientation of the and tensors in the (010) plane. This cannot be determined in measurements of the spin Hamiltonian of the main line, but does effect rotation patterns of satellite lines. The theoretical fits shown in the remainder of this paper use , as this gives the best fit to most satellite lines.
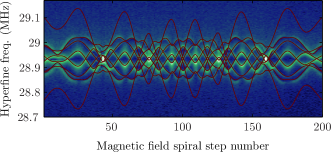
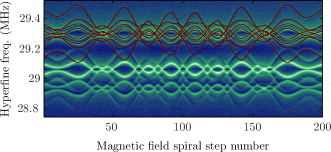
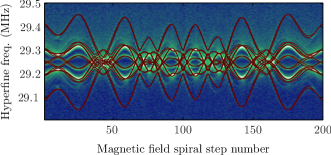
Three example satellite line rotation patterns are shown in Figures 4–5 The experimental patterns differ substantially from that of the main line, Figure 3, with the 4 lines in that pattern split into either 8 or 16 lines by the dipole-dipole interaction. Eight lines arise because the interaction is sensitive to the orientation of the Ce3+ magnetic moment, while some sites show 16 lines because the interaction differs slightly for the two C2 symmetric positions contributing to that satellite line.
Also shown in Figures 4–5 are the theoretical pattern for the crystallographic site that gives the best match to the experimental rotation pattern. As the theoretical pattern has only one unknown parameter, the site index , the fits were determined by comparing the theoretical and experimental patterns by eye. Satellite line A is due to one of the two sites on the C2 axis, sites 2 and 3. Although these two sites are crystallographically distinct, they have the same rotation pattern. Satellite line E is due to site 7, while line J is due to site 1. Two other satellite lines, lines N and K, are visible in Figure 5, but these have patterns very similar to the main line and cannot be assigned to a crystallographic site. This does not necessarily imply that these lines are due to sites a long way away from the dopant: the dipole-dipole interaction is strongly dependent on the orientation of the site and there are a number of sites at distances of less than 15 Å that show almost no dipole-dipole splitting in the rotation pattern. Even some satellite lines that do show a dipole-dipole splitting can be difficult to assign to a site as many of the outer sites (separated by more that 10 Å) have very similar patterns to each other. The site assignments that were made are summarized in Table 1.
| Line | Site | Distance from dopant (Å) |
|---|---|---|
| A | 2 or 3 | 6.52 |
| B | 9 or 10 | 10.27 |
| C | 2 or 3 | 6.52 |
| D | 4 | 6.74 |
| E | 7 | 7.94 |
| F | 9 or 10 | 10.27 |
| G | 15 | 12.10 |
| H | 8 | 9.66 |
| I | 11 | 10.43 |
| J | 1 | 6.36 |
| L | 19 or 22 | 12.89 (19), 13.27 (22) |
| M | 16 20 or 21 | 12.63 (16), 13.06 (20, 21) |
| V | 5 | 7.57 |
V Discussion
In the model used to fit the hyperfine structure of satellite lines, the magnetic interaction between host and dopant ions was assumed to be dipole-dipole. For the outer satellite lines (sites 7 and above), such as line E (Figure 5), the dipole-dipole interaction fit the data well, justifying this assumption. However, for lines J (Figure 6) and line D, the fit to the data was poor, although sufficient to definitively assign these lines to sites 1 and 4, respectively. Lines A (Figure 4) and C, which were assigned to the two sites 2 and 3 on the dopant’s C2 axis, also do not fit as well as most other lines. The four anomalous satellite lines A,C, D and J arise from the four innermost sites, with separations to the dopant of between 6.36 and 6.74 Å. The next closest sites (which give rise to lines V and E) are Å away from the dopant, and show no anomalous behavior. This suggests that a short range interaction is contributing to the nearest sites. There are two possible sources of this interaction: crystal strain and exchange with the dopant. These are described below.
The strain caused by the Ce3+ dopant can affect the rotation pattern in two different ways. Firstly, it could modify the quadrupole and Zeeman tensors of nearby Eu3+ ions. The quadrupole tensor is certainly modified to some extent, because the satellite lines have different zero field hyperfine frequencies to the main line, but the difference is fairly small, . Any substantial modification of the Zeeman tensor can be ruled out by looking at the rotation pattern of Pr3+:EuCl6H2O. Pr3+ has a similar radius to Ce3+, but no electronic magnetic moment in the ground state because the orbital angular momentum is quenched, so if the dopant was modifying the quadrupole and Zeeman tensors, it would be expected that the rotation patterns on the innermost ion sites in Pr3+:EuCl6H2O would be different from the main line pattern. We have measured rotation patterns for lines A and J in Pr3+:EuCl6H2O; both these lines have patterns identical to the main line.
The second way the dopant-induced strain can affect the rotation pattern is by shifting the positions of the surrounding Eu3+ ions from their unperturbed positions, thus altering the magnetic dipole-dipole interaction between the dopant and the Eu3+ ion. The shift of nearest neighbor ions can be estimated by looking at the rare earth separations in the isomorphic RECl3.6H2O (RE = Nd, Gd, Lu) habenschuss80 ; habenschuss80a ; habenschuss80b . The rare earth separations in these materials differ by less than 1% from that in EuCl6H2O, suggesting that a Ce3+ dopant is unlikely to shift the position of neighboring Eu3+ ions by more than 1%. This is much smaller than the 10% shifts required to explain the discrepancy between experimental and theoretical rotation patterns.
The final option is an exchange interaction between the Ce3+ ion and the nearby Eu3+ ions, most likely superexchange, which has been seen between rare earth ions with separations as large as 10 Åbirgeneau68 . The sharp cutoff in the interaction at Å does provide some evidence that the interaction is superexchange, as this is a feature of this interaction.
The site assignments presented here for EuCl6H2O show how the optical and hyperfine frequencies of a satellite line are related to the spatial position of the ions in that line. In general, the satellite lines in EuCl6H2O that are shifted the most in optical or hyperfine frequency are the closest sites to the dopant, but some satellite lines break this trend: line B has the third largest optical shift, but is due to a site more than 10 Å away from the dopant, while the fact that the line corresponding to site 6 (one of the first shell sites) is missing suggests that its optical shift is very small. This demonstrates that, while the interaction between dopant and host ions that results in optical and hyperfine shifts is distance-dependent, the distance dependence is not strong. More concrete conclusions about the interaction and the distortion field of the dopant could be made by modelling the optical and hyperfine satellite structure using the site assignments.
While the site assignment method has been demonstrated for a stoichiometric Eu3+ crystal doped with another rare earth, it is more generally applicable. It can be used to assign satellite lines caused by any defect with a large magnetic moment. The method is useful for both low and high symmetry materials, and can assign most of the satellite lines in any material to a single crystallographic site. In all materials with non-centrosymmetric rare earth sites, there will be a small number of lines that can only be assigned to one of two sites related by inversion symmetry, as the spin Hamiltonian itself has inversion symmetry. This is shown here for EuCl6H2O: lines A and C are due to sites 2 and 3, but because the two sites are related by inversion symmetry and so have identical rotation patterns, it cannot be determined which line corresponds to which site. In centrosymmetric crystals, sites related by inversion no longer have distinct optical transition frequencies, and all sites can be assigned.
In the rare earth doped crystals more commonly studied in rare earth spectroscopy site assignments could be achieved by co-doping the crystal with a Kramers dopant with a similar radius. For instance, a Pr3+ doped crystal could be co-doped with Ce3+. This would lead to an additional set of satellite lines due to Ce3+–Pr3+ pairs, which can be correlated with the Pr3+–Pr3+ lines because the optical shift of a satellite line is dependent on ion radius fricke79 . The rotation pattern technique could be performed on the additional satellite lines to assign them to sites.
The criterion that allows a satellite line to be used as a frequency addressed qubit is that it is optically well resolved from other qubit satellite lines. Where two lines occur at the same optical frequency, one can be used. Of the 13 satellite lines whose spatial positions were determined in this paper, at least 11 could readily be used as qubits. As these satellite lines are due to the inner shells of ions around the Ce3+ dopant, the distances between the 11 qubit lines are small, ranging from 6.4 to 26.3 Å, and interactions between the qubits can be expected to be strong. The next step in this work is to measure these interaction strengths between different satellite lines.
VI Conclusion
Assigning satellite lines caused by a magnetic defect in a rare earth crystal to the specific rare earth ion positions around that defect is possible by utilizing the magnetic dipole-dipole interaction between the Eu3+ nuclear spin and the defect electronic spin. In EuCl6H2O, this method was used to assign 13 of the 22 outermost satellite lines to crystallographic sites. These assignments showed that most of the outer satellite lines are due to the innermost site positions around the dopant. While the interaction between dopant and host ions separated by more than 7 Å is wholly magnetic dipole-dipole, at distances of less than 7Å, there is a small contribution to the interaction from another mechanism, likely superexchange.
Acknowledgements.
This research was conducted by the Australian Research Council Centre of Excellence for Quantum Computation and Communication Technology (Project number CE110001027).References
- (1) R. L. Cone, P. C. Hansen, M. J. M. Leask, and B. Wanklyn, J. Phys.: Condens. Matter 5, 573 (1993)
- (2) R. Jaaniso, H. Hagemann, and H. Bill, J. Chem. Phys. 101, 10323 (1994)
- (3) M. Yamaguchi, K. Koyama, T. Suemoto, and M. Mitsunaga, Phys. Rev. B 59, 9126 (1999)
- (4) J. Vial, R. Buisson, F. Madeore, and M. Poirier, J. Phys. -Paris 40, 913 (1979)
- (5) J. Vial and R. Buisson, J. Phys. Lett. -Paris 43, 745 (1982)
- (6) J. Hegarty, D. L. Huber, and W. M. Yen, Phys. Rev. B 25, 5638 (1982)
- (7) G. P. Morgan, D. L. Huber, and W. M. Yen, J. Phys. Colloq. -Paris 46, 25 (1985)
- (8) R. J. Birgeneau, M. T. Hutchings, J. M. Baker, and J. D. Riley, J. Appl. Phys. 40, 1070 (1969)
- (9) M. J. Sellars, E. Fraval, and J. J. Longdell, J. Lumin. 107, 150 (2004)
- (10) G. J. Pryde, M. J. Sellars, and N. B. Manson, Phys. Rev. Lett. 84, 1152 (2000)
- (11) M. D. Lukin and P. R. Hemmer, Phys. Rev. Lett. 84, 2818 (2000)
- (12) K. Ichimura, Opt. Commun. 196, 119 (2001)
- (13) M. S. Shahriar, P. R. Hemmer, S. Lloyd, P. S. Bhatia, and A. E. Craig, Phys. Rev. A 66, 032301 (2002)
- (14) N. Ohlsson, R. Krishna Mohan, and S. Kröll, Opt. Commun. 201, 71 (2002)
- (15) J. R. Wietfeldt and J. C. Wright, J. Chem. Phys. 83, 4210 (1985)
- (16) J. P. Jouart, C. Bissieux, G. Mary, and M. Egee, J. Phys. C: Solid State 18, 1539 (1985)
- (17) N. K. Bel‘skii and Y. T. Struchkov, Sov. Phys. Crystallogr., Pages: 15(1965)
- (18) D. Kepert, J. Patrick, and A. White, Aust. J. Chem. 36, 477 (1983)
- (19) R. Ahlefeldt, M. Zhong, J. Bartholomew, and M. Sellars, J. Lumin. 143, 193 (2013)
- (20) R. M. Macfarlane and R. M. Shelby, in Spectroscopy of Solids Containing Rare Earth Ions, edited by A. A. Kaplyanskii and R. M. Macfarlane (North-Holland, 1987)
- (21) J. J. Longdell, A. L. Alexander, and M. J. Sellars, Phys. Rev. B 74, 195101 (2006)
- (22) R. Ahlefeldt, W. Hutchison, and M. Sellars, J. Lumin. 130, 1594 (2010)
- (23) M. B. Schulz and C. D. Jeffries, Phys. Rev. 159, 277 (1967)
- (24) J. Mlynek, N. C. Wong, R. G. DeVoe, E. S. Kintzer, and R. G. Brewer, Phys. Rev. Lett. 50, 993 (1983)
- (25) A. Habenschuss and F. H. Spedding 9, 213 (1980)
- (26) A. Habenschuss and F. H. Spedding, Cryst. Struct. Commun. 9, 157 (1980)
- (27) A. Habenschuss and F. H. Spedding, Cryst. Struct. Commun. 9, 71 (1980)
- (28) R. J. Birgeneau, Appl. Phys. Lett. 13, 193 (1968)
- (29) W. Fricke, Z. Phys. B-Con. Mat. 33, 255 (1979)