table
Validation of Geant4 simulation of electron energy deposition
Abstract
Geant4-based simulations of the energy deposited by electrons in various materials are quantitatively compared to high precision calorimetric measurements taken at Sandia Laboratories. The experimental data concern electron beams of energy between a few tens of keV and 1 MeV at various incidence angles. Two experimental scenarios are evaluated: the longitudinal energy deposition pattern in a finely segmented detector, and the total energy deposited in a larger size calorimeter. The simulations are produced with Geant4 versions from 9.1 to 9.6; they involve models of electron-photon interactions in the standard and low energy electromagnetic packages, and various implementations of electron multiple scattering. Significant differences in compatibility with experimental data are observed in the longitudinal energy deposition patterns produced by the examined Geant4 versions, while the total deposited energy exhibits smaller variations across the various Geant4 versions, with the exception Geant4 9.4. The validation analysis, based on statistical methods, shows that the best compatibility between simulation and experimental energy deposition profiles is achieved using electromagnetic models based on the EEDL and EPDL evaluated data libraries with Geant4 9.1. The results document the accuracy achievable in the simulation of the energy deposited by low energy electrons with Geant4; they provide guidance for application in similar experimental scenarios and for improving Geant4.
Index Terms:
Monte Carlo, simulation, Geant4, electrons, dosimetryI Introduction
The simulation of the interactions with matter of electrons and of their secondary particles is one of the main tasks of any Monte Carlo codes for particle transport. The resulting energy deposition is relevant to a wide variety of experimental applications, where electrons contribute to determine experimental observables either as primary or secondary particles.
High precision experimental measurements [1, 2, 3, 4, 5] were performed at the Sandia National Laboratories specifically for the validation of the ITS (Integrated Tiger Series) [6] simulation code: they concern electrons with energies ranging from a few tens of keV to 1 MeV, and involve various target materials and electron incidence angles. These experimental data are still regarded as the most comprehensive reference for benchmarking the simulation of energy deposition by low energy electrons: they have been exploited in the validation [7, 8, 9, 11, 12, 13, 14, 10, 15] of numerous general purpose Monte Carlo codes other than the ITS system, for which the measurements were originally intended, such as EGS [16], EGSnrc [17], Geant4 [18, 19], MCNP [20], MCNPX [21] and Penelope [22].
The validation of simulated electron energy deposition in [15] concerns two versions of Geant4, 8.1p02 and 9.1: the latter was the latest version available at the time when the article was written. Some differences in compatibility with experiment were observed between the two Geant4 versions, which were ascribed to evolutions in Geant4 multiple scattering implementation.
Statements of improvements to Geant4 simulation of electromagnetic interactions have been reported in the literature [23, 24, 25, 26] since the publication of [15], and a multiple scattering model specifically addressing the transport of electrons [27] has been introduced in the Geant4 toolkit. This paper documents quantitatively how these evolutions in Geant4 electromagnetic physics domain affect the accuracy of the simulation of the energy deposited by low energy electrons: it reports comparisons between experimental data in [1, 3, 2, 4] and simulations based on Geant4 versions from 9.1 to 9.6, which span five years’ Geant4 development.
In this respect, it is worthwhile to note that several versions of Geant4 are actively used in the experimental community at any given time, not limited to the latest release: in fact, despite the fast release rate of Geant4 of one or two new versions per year, often complemented by correction patches, experimental projects usually require a stable simulation production environment for large portions of their life-cycle and retain a Geant4 version in their simulation productions for an extended period, even though new versions may become available in the meantime.
Besides the effects due to the evolution of Geant4 electromagnetic physics, this paper evaluates quantitatively another issue of experimental relevance: the sensitivity to physics modeling features in relation to the geometrical granularity of the detector.
The results of this validation analysis provide guidance to experimental users in optimizing the configuration of Geant4-based applications in scenarios concerned by the simulation of the energy deposited by low energy electrons. This investigation may be relevant also to high energy experiments, since low energy electrons contribute to the determination of the characteristics of electromagnetic showers initiated by high energy particles, or the signal produced in detectors in general. The validation tests reported here contribute to improve Geant4 by objectively identifying areas where its capability of reproducing experimental measurements could profit from more refined physics modeling or software engineering methods.
II Strategy of this study
This validation study covers two experimental scenarios: the longitudinal pattern of the energy deposited by electrons in a segmented calorimeter, and the total energy deposited in a bulk calorimeter. Test cases, characterized by electron energy, beam incidence angle and target material, are reproduced in the simulation for both scenarios according to the respective experimental references [1, 3]. The test cases involving uranium as target material are not considered in the validation process, since concerns were expressed about the presence of systematic errors in the calorimeter data for this material [3].
The physics configuration activated in the simulation (selection of Geant4 processes, models and secondary production thresholds) is the same in both scenarios; only the geometrical configuration and the scored observable differ, as they reflect the respective experimental set-up. This application design feature allows the evaluation of the sensitivity of different observables to the physics modeling options available in Geant4 and to the evolution of Geant4 kernel.
In both scenarios three sets of electron-photon interaction models are evaluated:
- •
-
•
the models reengineered from the Penelope [22] Monte Carlo code, also belonging to the ‘’low energy” package,
-
•
the models included in Geant4 “standard” electromagnetic package [33].
In addition, the effects of different multiple scattering models on the energy deposition patterns corresponding to the two scenarios are estimated.
Simulations are produced with six Geant4 versions released between late 2007 and late 2012; correction patches to these versions released by the end of February 2013 are applied on top of the original versions. For convenience, the Geant4 versions evaluated in this study are identified through their original version number; the corresponding patched versions used to produce the results reported in this paper are listed in Table I.
| Version Identifier | Patched Geant4 Version |
| 9.1 | 9.1p03 |
| 9.2 | 9.2p04 |
| 9.3 | 9.3p02 |
| 9.4 | 9.4p04 |
| 9.5 | 9.5p01 |
| 9.6 | 9.6p01 |
The compatibility between simulated and experimental data is assessed by means of statistical methods. The statistical analysis is articulated over two levels: first the compatibility between simulated and experimental data is evaluated for each test case on the basis of goodness-of-fit tests, independently for each Geant4 physics configuration and version; next differences in compatibility with experiment are evaluated for different categories of data. The categories subject to analysis are different electromagnetic physics settings within a given Geant4 version, and different Geant4 versions with the same physics settings in the simulation application. The analysis of categorical data exploits contingency tables based on the outcome of goodness-of-fit tests over different categories.
III Reference experimental data
The reference data exploited in the validation process derive from high precision measurements of longitudinal energy deposition and total deposited energy reported in [1, 3] respectively. The transverse energy deposition was not measured. The two sets of measurements use the same experimental technique, although they concern two distinct observables. The experimental apparatus and measurement techniques are described in detail in [1, 2, 3, 4]; only a brief overview is provided here to facilitate the comprehension of the results reported in this paper.
The experimental set-up involved an electron beam impinging on a target equipped with a calorimeter. The energy and incidence angle of the beam varied in the range from 25 keV to 1.033 MeV, and from 0∘ to 83.5∘ respectively. The target was configured as a semi-infinite geometry; its thickness was larger than the range of the most energetic electrons, and its diameter was adequate to contain the resulting electromagnetic shower even for non-orthogonal beam incidence (apart from possible leakage of Bremsstrahlung photons). The experimental configuration for the measurement of the longitudinal energy deposition consisted of a front slab of passive material, a calorimeter and a so-called “infinite” plate, all of the same material; the thickness of the front slab was varied to measure the deposited energy as a function of depth. The measurement depth was determined by the sum of the thickness of the front slab and one-half the calorimeter thickness. The calorimeter coincided with the whole target for the measurements of the total deposited energy. For the reader’s convenience, the thicknesses of the calorimeters utilized in the two experimental set-ups are summarized in Table II.
| Target | Longitudinal profile | Total deposited energy |
|---|---|---|
| Reference [1] | Reference [3] | |
| (mm) | (mm) | |
| Be | 0.024 | 3.81 |
| C | 0.092 | 4.78 |
| Al | 0.019 | 2.64 |
| Ti | 1.63 | |
| Fe | 0.025 | |
| Cu | 0.024 | |
| Mo | 0.005 | 0.91 |
| Ta | 0.010 | 0.53 |
| U | 0.008 | 0.50 |
| Target | Z | Energy (keV) | Angle (degrees) |
|---|---|---|---|
| Be | 4 | 58 | 0 |
| 109 | 0 | ||
| 314 | 0 | ||
| 521 | 0 | ||
| 1033 | 0 | ||
| C | 6 | 1000 | 0 |
| Al | 13 | 314 | 0 |
| 521 | 0 | ||
| 1033 | 0 | ||
| 314 | 60 | ||
| 521 | 60 | ||
| 1033 | 60 | ||
| Fe | 26 | 300 | 0 |
| 500 | 0 | ||
| 1000 | 0 | ||
| Cu | 29 | 300 | 0 |
| 500 | 0 | ||
| Mo | 42 | 100 | 0 |
| 300 | 0 | ||
| 500 | 0 | ||
| 1000 | 0 | ||
| 300 | 60 | ||
| 500 | 60 | ||
| 1000 | 60 | ||
| Ta | 73 | 300 | 0 |
| 500 | 0 | ||
| 1000 | 0 | ||
| 500 | 30 | ||
| 500 | 60 | ||
| 1000 | 60 | ||
| U | 92 | 300 | 0 |
| 500 | 0 | ||
| 1000 | 0 | ||
| 1000 | 60 |
| Target | E (keV) | Angle (degrees) | |||||||
| Element | Z | 0 | 16 | 31 | 46 | 61 | 76 | 83.5 | |
| Be | 4 | 1033 | x | x | x | x | x | x | x |
| 521 | x | x | x | x | x | x | x | ||
| 314 | x | x | x | x | x | x | |||
| 109 | x | x | |||||||
| Angle (degrees) | |||||||||
| 0 | 15 | 30 | 45 | 60 | 75 | 82.5 | |||
| C | 6 | 1000 | x | x | x | x | x | x | x |
| 500 | x | x | x | x | x | x | x | ||
| 300 | x | x | x | x | x | x | x | ||
| 100 | x | x | x | x | x | x | |||
| 75 | x | x | x | x | x | x | |||
| 50 | x | x | x | x | x | x | |||
| 25 | x | x | x | x | x | x | |||
| Al | 13 | 1033 | x | x | x | x | x | x | |
| 521 | x | x | x | x | x | x | |||
| 314 | x | x | x | x | x | x | |||
| 109 | x | x | x | x | x | x | |||
| 84 | x | x | x | x | x | x | |||
| 58 | x | x | x | x | x | x | |||
| 32 | x | x | x | x | x | x | |||
| Ti | 22 | 1033 | x | x | x | x | x | x | |
| 521 | x | x | x | x | x | x | |||
| 314 | x | x | x | x | x | x | |||
| 109 | x | x | x | x | x | x | |||
| Mo | 42 | 1033 | x | x | x | x | x | x | |
| 521 | x | x | x | x | x | x | |||
| 314 | x | x | x | x | x | x | |||
| 109 | x | x | x | x | x | ||||
| Ta | 73 | 1033 | x | x | |||||
| 521 | x | x | x | ||||||
| 314 | x | ||||||||
| U | 92 | 1033 | x | x | x | x | x | x | |
| 521 | x | x | x | x | x | x | |||
| 314 | x | x | x | x | x | x | |||
| 109 | x | x | x | x | x | x | |||
| 84 | x | x | x | x | x | x | |||
| 58 | x | x | x | x | x | ||||
| 32 | x | x | x | x | x | ||||
The depth at which the deposited energy was measured was expressed as a fraction of the continuous slowing-down approximation (CSDA) [34] range. Some values of the CSDA range of electrons reported in [1] differ from those reported by the ESTAR database [35] of NIST (National Institute of Standards and Technology), which is considered an authoritative reference; nevertheless, since the CSDA range is only used as a scaling factor in the expression of the measurement depth, it does not play any physical role in the features of the data, therefore any discrepancies with respect to other references, or to its true value, do not affect the results of goodness-of-fit tests.
The experimental configurations of the test cases for longitudinal energy deposition are summarized in Table III, and those for total energy deposition in Table IV, where available combinations of beam energy and incident angle in the experiment are identified by a ”x”.
The uncertainty in the measurements of the deposited energy is reported in the experimental references as varying between 1.2% and 2.2% in the different configurations. An extensive discussion of the analysis of experimental uncertainties and their dependence on penetration depth is reported in section V of [15]; they are handled in this study accordingly. The correction of nominal experimental uncertainties as a function of penetration depth is applied to the data as discussed in [15]; nevertheless for the present study it profited from a larger simulated data sample than the one used in [15], which allowed a more precise estimate of the error behaviour as a function of depth. Nevertheless, although the numerical values of the test statistic slightly differ when using the original scaling corrections of [15] or the refined ones, the outcome of the goodness-of-fit tests is the same as reported in [15] in terms of rejection of the null hypothesis (i.e. of compatibility of experimental and simulated distributions).
IV Simulation configuration
The Geant4-based application used for the validation tests reported in this paper is the same as for the tests reported in [15], apart from the changes needed to instantiate Geant4 kernel objects whose class interfaces were modified in the evolution from version 9.1 to 9.6. A brief overview is provided here; more extensive details can be found in [15].
The energy spectrum of the primary electrons is modeled according to a gaussian distribution, with width defined by the uncertainty on the beam energy reported in the experimental references [1, 3]. The beam direction is set in the simulations according to the incident angle corresponding to each test case.
The geometry configuration reproducing the experimental set-up for the determination of the longitudinal energy deposition is the same as described in [15]. For the simulation of the total deposited energy, the geometry configuration consists of a single sensitive volume, corresponding to the calorimeter in the experimental set-up. The two configurations are sketched in Fig. 1 and 2 respectively.


The physics interactions that can be configured in the simulation are: ionization, Bremsstrahlung and multiple scattering for electrons, Rayleigh and Compton scattering, photoionization and conversion for photons. With the exception of multiple scattering, the physics configuration of the simulation is identified in the following as “electron-photon settings”.
The simulations are configured with three alternative electron-photon settings: those based on the EEDL and EPDL evaluated data libraries (also known as the “Livermore” library), those reengineered from the Penelope Monte Carlo code and those implemented in the Geant4 “standard” electromagnetic package. conversion is not relevant at the energies considered in this study. Functionality for the simulation of Rayleigh scattering is available in Geant4, based on EPDL and reengineered from Penelope, for all versions considered in this paper, and is activated in the simulations produced for this paper. Functionality for the simulation of Rayleigh scattering, implemented in the G4XrayRayleighModel class, was first introduced in Geant4 “standard” electromagnetic package in the 9.5 version; nevertheless, due to its questionable physical behavior observed in [43], it is not included in the simulation configurations examined in this paper. Atomic deexcitation [44] following the creation of a vacancy in atomic shell occupation is activated in the physics processes and models to which it is pertinent. Since it was verified that the compatibility of the simulated energy deposition with experimental data is insensitive to the generation of Auger electrons in all the test cases of [1, 3], this time-consuming atomic deexcitation component was not enabled to reduce the computational resources required for the production of simulated data.
The Penelope-like models reengineered in Geant4 versions from 9.1 to 9.4 reproduce those implemented in Penelope 2001 version [41], while in Geant4 9.5 they have been updated to those implemented in Penelope 2008 [42]: the results reported in section VI as “Penelope” correspond accordingly to the reengineered version of the original code. Models based on both Penelope 2008 and 2001 are available in Geant4 9.5: the validation results reported in section VI as “Penelope” correspond to the activation of models reengineered from Penelope 2008, while results based on reengineered Penelope 2001 models are explicitly indicated as “Penelope 2001”.
Unless otherwise specified, the simulation results reported in this paper are produced with the default multiple scattering configuration corresponding to each Geant4 version. The Urban multiple scattering model [36, 37, 38], based on Lewis’ theory [39], is instantiated by default in the electron multiple scattering process; several variants of this model have been implemented in Geant4. The main features of the default multiple scattering configuration associated with the Geant4 versions examined in this paper are summarized in Table V. Information about the parameters listed in Table V is available in [40].
Validation results are also reported with an implementation of the Goudsmit-Saunderson multiple scattering algorithm [27], which was first released in Geant4 version 9.3.
| Geant4 | Multiple Scattering | Range | Geom | |
|---|---|---|---|---|
| Version | Model Class | Factor | skin | Factor |
| 9.1 | G4UrbanMscModel | 0.02 | 0 | 2.5 |
| 9.2 | G4UrbanMscModel2 | 0.02 | 3 | 2.5 |
| 9.3 | G4UrbanMscModel92 | 0.04 | 3 | 2.5 |
| 9.4 | G4UrbanMscModel93 | 0.04 | 1 | 2.5 |
| 9.5 | G4UrbanMscModel95 | 0.04 | 1 | 2.5 |
| 9.6 | G4UrbanMscModel95 | 0.04 | 1 | 2.5 |
Production thresholds are defined for each target material to enable the production of secondary particles with energy above 250 eV in simulations involving models based on the EEDL and EPDL data libraries and originating from Penelope, and above 1 keV in simulations activating models in Geant4 standard electromagnetic package.
The maximum step limit is set to 1 m based on the optimization described in [14]. This setting has been further verified in the context of the validation process.
The energy deposited by primary and secondary particles is scored in the sensitive volume corresponding to the calorimeter in the experimental set-up.
The size of the simulated event samples is subject to the requirement that the statistical uncertainties of the simulated data are negligible with respect to the experimental uncertainties. Unless differently specified, the simulated data sample is based on one million primary electrons generated in each test configuration. The statistical uncertainties of the simulated data are taken into account in the calculation of the test statistic of goodness of fit tests.
V Data analysis methods
The data analysis addresses various issues related to the validation of Geant4-based simulation of the energy deposited by electrons: the evaluation of the capability of Geant4 to produce results consistent with measurements in the various experimental configurations, the comparison of the simulation accuracy achievable with different Geant4 physics configurations in the user application, and the evolution of compatibility with experiment when the same test case is simulated with the same nominal physics configuration, but with different Geant4 versions.
The statistical analysis takes into account the relationship between the samples of simulated data that are subject to comparison, as determined by the simulation configuration. Simulations using different sets of electron-photon models produce unrelated samples, as the three electromagnetic options available in Geant4 implement distinct conceptual alternatives in the treatment of particle interactions with matter, while samples deriving from simulations that differ only for a secondary option (e.g. a feature in the calculation of multiple scattering), or that share identical physics configurations, are to some extent related.
The approach adopted in the statistical analysis takes into account the physics configuration that characterizes how the data samples were produced; appropriate statistical methods are applied to each analysis scenario to quantify the compatibility of simulation with experimental data.
The significance level for the rejection of the null hypothesis is set at 0.01 for all tests, unless otherwise specified.
The statistical data analysis reported in the following sections exploits the Statistical Toolkit [45, 46] and R [47].
Categorical statistical tests determine whether the differences in compatibility with experiment observed across the various categories can be explained only by chance, or should be interpreted as deriving from intrinsic behavioral characteristics. The approach adopted in the categorical analysis is related to the physics configuration that characterizes how the data samples were produced: statistical tests pertinent to independent or to related data samples are applied as appropriate.
V-A Evaluation of individual test cases
| Model A | Model B | |
|---|---|---|
| Pass | NpassA | NpassB |
| Fail | NfailA | NfailB |
| Version A Pass | Version A Fail | |
|---|---|---|
| Version B Pass | N | N |
| Version B Fail | N | N |
The evaluation of the simulation accuracy in each experimental configuration is based on the test [48]. This goodness-of-fit test takes experimental uncertainties into account explicitly in the calculation of the test statistic. The null hypothesis for this test is defined as the equivalence of the simulated and experimental distributions. The outcome of this test is classified as “fail”, if the null hypothesis is rejected, as “pass” otherwise.
This stage of the validation analysis closely follows the procedure described in [15] and reuses previous assessments, such as the treatment of outliers in the experimental data and of the tails of the longitudinal energy deposition distribution in the calculation of the test statistic.
V-B Evaluation of unrelated data samples
This component of the analysis evaluates the difference in compatibility with experiment across independent samples. This is the case, for instance, with simulations based on entirely different modeling approaches to describe the interactions of electrons and photons with matter (e.g. based on the interpolation of data libraries or implementing analytical models).
The differences in the behavior of the two categories are quantified by means of contingency tables derived from the results of the test described in section V-A. Contingency tables for this evaluation are built by counting the number of test cases where the null hypothesis is rejected or not rejected by the test at the defined significance level for each category of data. An example of their configuration is shown in Table VI.
In the analysis of contingency tables the null hypothesis is that there is no relationship between the two categories; in physical terms it means that the two categories under examination (e.g. two sets of Geant4 electron-photon models) are equivalent regarding the compatibility with experiment of their respective simulation outcome.
A variety of tests is applied to determine the statistical significance of the difference between the two categories of data subject to evaluation: Pearson’s test [49] (when the number of entries in each cell of the table is greater than 5), Fisher’s exact test [50], Barnard’s test [51], Boschloo’s test [52] and Suissa and Schuster’s [53] calculation of a Z-pooled statistic. The use of several tests mitigates the risk of introducing systematic effects in the validation results due to peculiarities in the mathematical formulation of the test statistic.
Fisher’s test is widely used in the analysis of contingency tables. It is based on a model in which both the row and column sums are fixed in advance, which seldom occurs in experimental practice; it remains valid for the cases in which the row or column totals, or both, are not fixed, but in these cases it tends to be conservative, yielding a larger p-value than the true significance of the test [56]. Barnard’s test is deemed more powerful than Fisher’s exact test in some configurations of 22 contingency tables [54, 55], although it is computationally more intensive. Boschloo’s test and the Z-pooled statistic are also considered more powerful than Fisher’s exact test [52, 53].
V-C Evaluation of related data samples
This analysis evaluates the difference in compatibility with experiment of dependent data samples across data categories. In this type of analysis each subject (e.g. a physics configuration in the user application) serves in both situations being evaluated (e.g. two Geant4 versions): if the result of the test is significant (i.e. the null hypothesis is rejected), one can conclude that there is a high likelihood that the two situations represent populations with different behaviors. This type of analysis also applies when one examines two closely related subjects: for instance, when one wants to estimate the effect of a secondary feature (e.g. a multiple scattering parameter), while the main electron-photon physics settings that characterize the simulation are common to both configurations being evaluated.
Appropriate 22 contingency tables are built for this purpose, based on the results of the test of section V-A: they report on one diagonal the number of test cases where both categories (e.g. Geant4 simulation configurations) subject to evaluation “pass” or “fail” the test of section V-A, and on the other diagonal the number of test cases where one category “passes” the test, while the other one“fails”. An example of their configuration is shown in Table VII.
McNemar’s test [57] is applied to the analysis of related data samples. This test focuses on the significance of the discordant results, i.e. the number of test cases where one category “passes” the test and the other one “fails”. The null hypothesis for McNemar’s test is that the proportions of discordant results is the same in the two cells corresponding to “pass-fail” or “fail-pass” associated with the two categories subject to test.
The calculation of McNemar’s test is performed using either the asymptotic distribution or the binomial distribution [58]: the former calculation method is usually identified simply as “McNemar test”, while the latter is known as “McNemar exact test”. Yates’ [59] continuity correction may be applied to the calculation of the statistic to account for cells with a small number of entries. According to [60], McNemar test uncorrected for continuity is more powerful than the exact test, and performs well even when the number of discordant pairs is as low as 6, while both the exact test and the corrected McNemar test are conservative.
| Target | Z | E | angle | Geant4 version | |||||
| (kev) | (degrees) | 9.1 | 9.2 | 9.3 | 9.4 | 9.5 | 9.6 | ||
| Be | 4 | 58 | 0 | 0.071 | 0.014 | 0.124 | 0.311 | 0.149 | 0.156 |
| Be | 4 | 109 | 0 | 0.021 | 0.015 | 0.013 | |||
| Be | 4 | 314 | 0 | 0.015 | 0.764 | 0.013 | 0.014 | ||
| Be | 4 | 521 | 0 | 0.092 | 0.967 | 0.832 | 0.793 | ||
| Be | 4 | 1033 | 0 | ||||||
| C | 6 | 1000 | 0 | 0.917 | 0.994 | 0.290 | 0.346 | ||
| Al | 13 | 314 | 0 | 0.182 | 0.004 | 0.007 | |||
| Al | 13 | 521 | 0 | 0.574 | 0.091 | 0.089 | |||
| Al | 13 | 1033 | 0 | 0.484 | 0.123 | ||||
| Al | 13 | 314 | 60 | 0.396 | 0.596 | 0.001 | 0.002 | ||
| Al | 13 | 521 | 60 | 0.137 | 0.011 | 0.001 | 0.056 | 0.086 | |
| Al | 13 | 1033 | 60 | ||||||
| Fe | 26 | 300 | 0 | 0.832 | 0.351 | 0.741 | 0.787 | 0.742 | |
| Fe | 26 | 500 | 0 | 0.055 | 0.314 | 0.003 | 0.814 | 0.808 | |
| Fe | 26 | 1000 | 0 | 0.169 | 0.003 | ||||
| Cu | 29 | 300 | 0 | ||||||
| Cu | 29 | 500 | 0 | ||||||
| Mo | 42 | 100 | 0 | ||||||
| Mo | 42 | 300 | 0 | 0.062 | 0.001 | 0.008 | 0.002 | ||
| Mo | 42 | 500 | 0 | 0.020 | 0.001 | 0.128 | 0.115 | ||
| Mo | 42 | 1000 | 0 | ||||||
| Mo | 42 | 300 | 60 | 0.023 | 0.002 | 0.049 | 0.043 | 0.029 | 0.022 |
| Mo | 42 | 500 | 60 | 0.022 | 0.011 | 0.006 | 0.003 | 0.007 | |
| Mo | 42 | 1000 | 60 | 0.037 | 0.010 | 0.028 | 0.001 | 0.002 | |
| Ta | 73 | 300 | 0 | 0.043 | 0.511 | 0.242 | 0.272 | 0.364 | 0.294 |
| Ta | 73 | 500 | 0 | 0.025 | 0.003 | 0.012 | 0.019 | ||
| Ta | 73 | 1000 | 0 | 0.030 | 0.002 | 0.001 | |||
| Ta | 73 | 500 | 60 | 0.011 | 0.003 | 0.040 | 0.042 | 0.010 | 0.007 |
| Ta | 73 | 1000 | 60 | ||||||
| Ta | 73 | 500 | 30 | 0.034 | 0.005 | 0.004 | 0.006 | 0.020 | 0.017 |
| Target | Z | E | angle | Geant4 version | |||||
| (kev) | (degrees) | 9.1 | 9.2 | 9.3 | 9.4 | 9.5 | 9.6 | ||
| Be | 4 | 58 | 0 | 0.018 | 0.002 | 0.245 | 0.123 | 0.060 | 0.069 |
| Be | 4 | 109 | 0 | ||||||
| Be | 4 | 314 | 0 | ||||||
| Be | 4 | 521 | 0 | 0.270 | 0.002 | 0.002 | 0.003 | ||
| Be | 4 | 1033 | 0 | 0.885 | 0.192 | 0.195 | 0.206 | ||
| C | 6 | 1000 | 0 | 0.997 | 0.448 | 0.346 | 0.407 | ||
| Al | 13 | 314 | 0 | 0.145 | 0.001 | 0.001 | |||
| Al | 13 | 521 | 0 | 0.350 | 0.004 | 0.001 | |||
| Al | 13 | 1033 | 0 | 0.174 | |||||
| Al | 13 | 314 | 60 | 0.275 | 0.702 | 0.005 | 0.007 | ||
| Al | 13 | 521 | 60 | 0.006 | 0.001 | 0.001 | 0.003 | ||
| Al | 13 | 1033 | 60 | ||||||
| Fe | 26 | 300 | 0 | ||||||
| Fe | 26 | 500 | 0 | ||||||
| Fe | 26 | 1000 | 0 | ||||||
| Cu | 29 | 300 | 0 | 0.001 | |||||
| Cu | 29 | 500 | 0 | ||||||
| Mo | 42 | 100 | 0 | ||||||
| Mo | 42 | 300 | 0 | ||||||
| Mo | 42 | 500 | 0 | ||||||
| Mo | 42 | 1000 | 0 | 0.001 | 0.769 | 0.044 | |||
| Mo | 42 | 300 | 60 | ||||||
| Mo | 42 | 500 | 60 | ||||||
| Mo | 42 | 1000 | 60 | ||||||
| Ta | 73 | 300 | 0 | ||||||
| Ta | 73 | 500 | 0 | ||||||
| Ta | 73 | 1000 | 0 | 0.001 | 0.119 | 0.137 | |||
| Ta | 73 | 500 | 60 | ||||||
| Ta | 73 | 1000 | 60 | 0.327 | 0.489 | 0.176 | 0.177 | 0.136 | 0.257 |
| Ta | 73 | 500 | 30 | 0.001 | |||||
| Target | Z | E | angle | Geant4 version | |||||
| (kev) | (degrees) | 9.1 | 9.2 | 9.3 | 9.4 | 9.5 | 9.6 | ||
| Be | 4 | 58 | 0 | 0.009 | 0.374 | 0.031 | 0.009 | 0.009 | |
| Be | 4 | 109 | 0 | ||||||
| Be | 4 | 314 | 0 | ||||||
| Be | 4 | 521 | 0 | 0.464 | 0.001 | ||||
| Be | 4 | 1033 | 0 | 0.805 | 0.180 | 0.080 | 0.090 | ||
| C | 6 | 1000 | 0 | 0.014 | 0.850 | 0.869 | 0.859 | ||
| Al | 13 | 314 | 0 | 0.176 | 0.007 | 0.007 | |||
| Al | 13 | 521 | 0 | 0.124 | 0.062 | 0.030 | |||
| Al | 13 | 1033 | 0 | 0.087 | |||||
| Al | 13 | 314 | 60 | 0.286 | 0.921 | 0.015 | 0.016 | ||
| Al | 13 | 521 | 60 | 0.001 | 0.003 | ||||
| Al | 13 | 1033 | 60 | ||||||
| Fe | 26 | 300 | 0 | ||||||
| Fe | 26 | 500 | 0 | ||||||
| Fe | 26 | 1000 | 0 | ||||||
| Cu | 29 | 300 | 0 | 0.010 | |||||
| Cu | 29 | 500 | 0 | ||||||
| Mo | 42 | 100 | 0 | ||||||
| Mo | 42 | 300 | 0 | ||||||
| Mo | 42 | 500 | 0 | ||||||
| Mo | 42 | 1000 | 0 | 0.181 | |||||
| Mo | 42 | 300 | 60 | ||||||
| Mo | 42 | 500 | 60 | ||||||
| Mo | 42 | 1000 | 60 | ||||||
| Ta | 73 | 300 | 0 | ||||||
| Ta | 73 | 500 | 0 | ||||||
| Ta | 73 | 1000 | 0 | 0.006 | |||||
| Ta | 73 | 500 | 60 | ||||||
| Ta | 73 | 1000 | 60 | 0.001 | 0.016 | 0.007 | 0.151 | 0.139 | |
| Ta | 73 | 500 | 30 | ||||||
VI Results: energy deposition profile
This part of the validation process concerns the comparisons of Geant4-based simulations with the measurements of deposited energy as a function of penetration depth reported in [1]. Various issues are investigated:
-
•
the effect of different Geant4 electron-photon models on simulation accuracy,
- •
-
•
the effect of different modeling options and empirical parameters in the implementation of multiple scattering on simulation accuracy.
VI-A General features
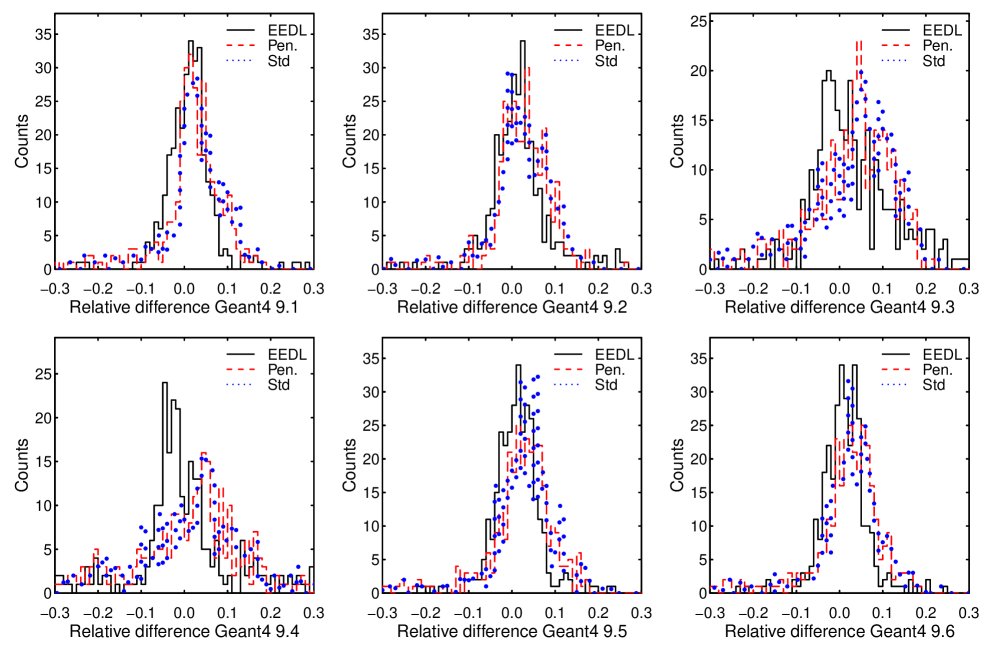
The relative difference between simulated and experimental data of [1] for each electron-photon model and Geant4 version is shown in Fig. 3. The relative difference at a given depth is defined as , where is the deposited energy at the considered depth. These distributions encompass all experimental test cases except those involving uranium targets.
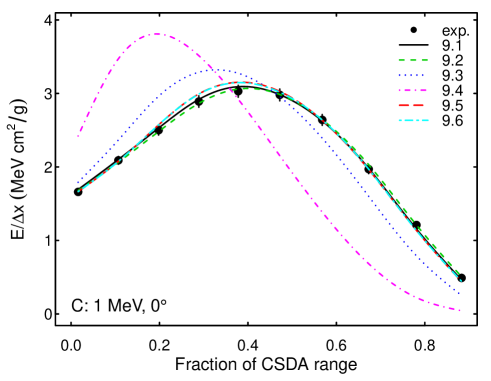
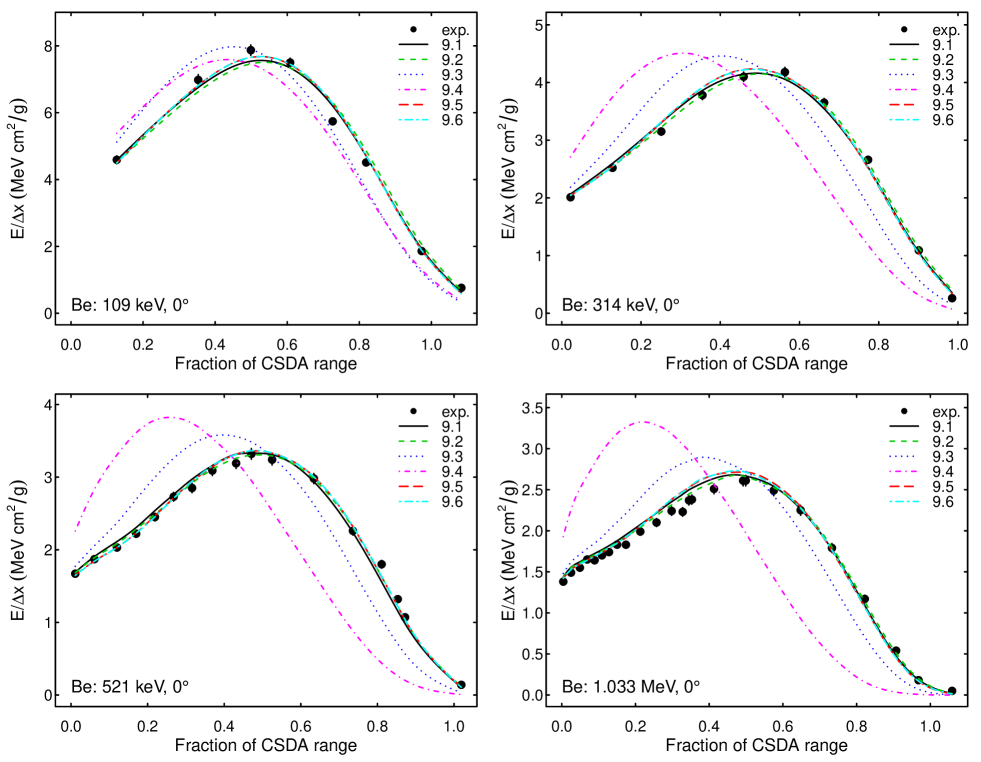
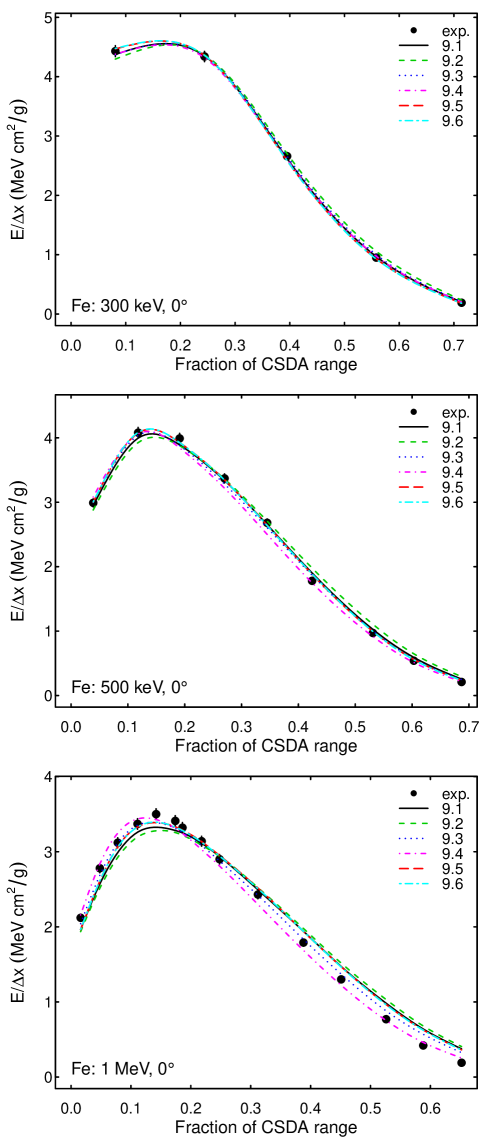
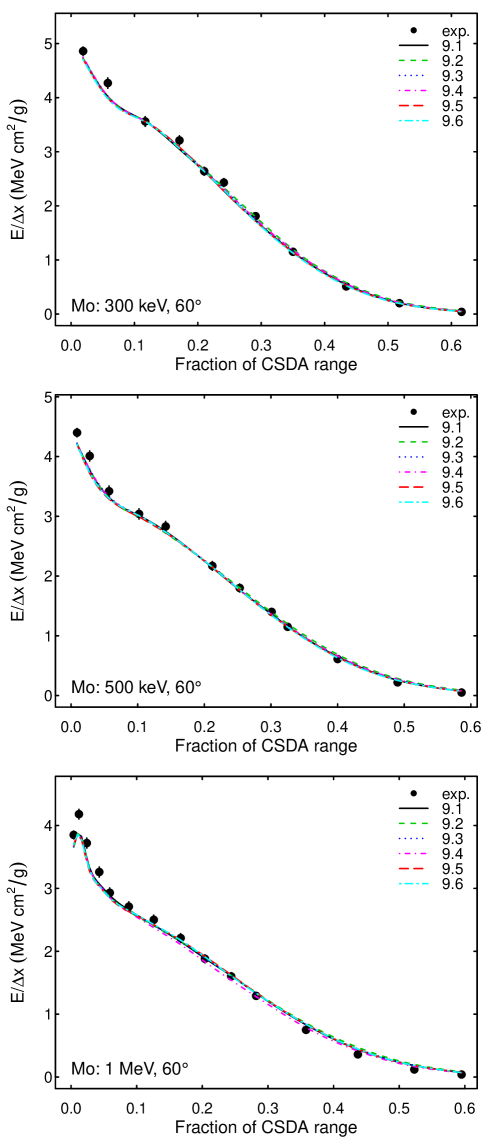
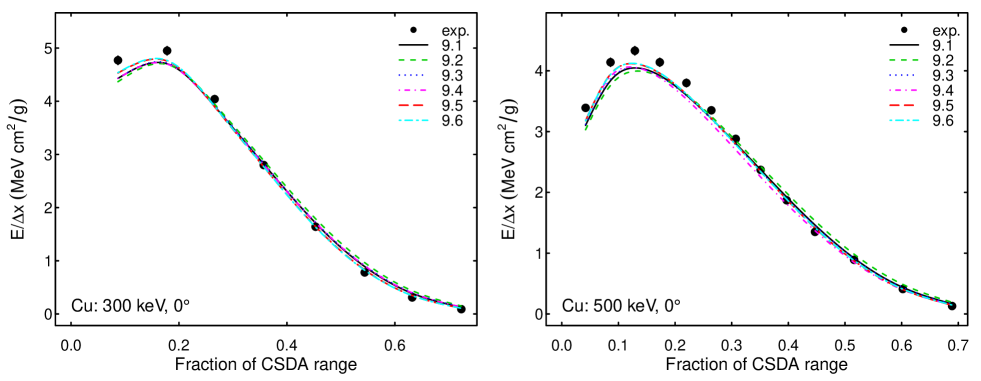
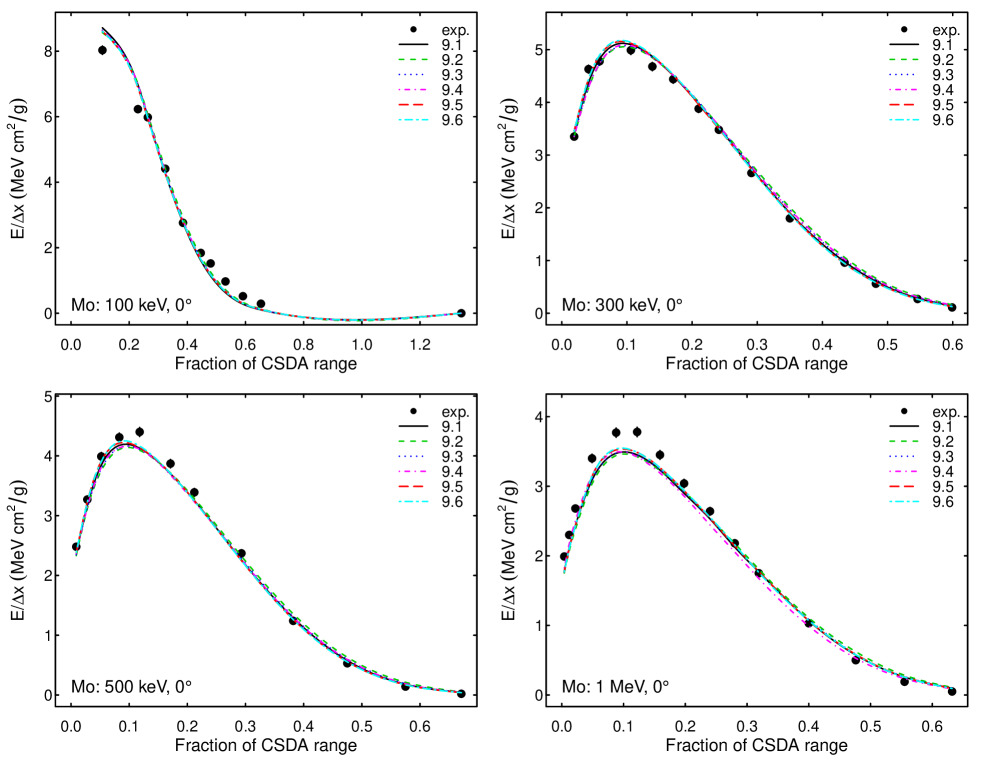
The longitudinal energy profiles produced by simulations with the electron-photon models based on EEDL-EPDL evaluated data libraries and default multiple scattering settings are shown for all test cases and Geant4 versions in Fig. 4-12. The plots also report the experimental data of [1]. The quantity reported in the plots is the energy deposited in the calorimeter divided by the thickness of the calorimeter. The associated depth is determined by the sum of the thickness of the front slab and one-half the calorimeter thickness, and is expressed as a fraction of the CSDA range.
The p-values resulting from the test over all experimental configurations are listed in Tables VIII, IX and X, for Geant4 electron-photon interaction models based on EEDL-EPDL, originating from Penelope and implemented in the “standard” electromagnetic package respectively.
The p-values obtained for Geant4 9.1 are numerically different from those listed in [15]. The simulations were produced with two different releases of Geant4 code: the original 9.1 version for [15] and patch p03 on top of the original version for the data examined in this paper. Moreover, the simulation productions were executed with different seeds of the random number generators, and the experimental error scale factors were slightly different in the two analyses, as explained in section III. Nevertheless, the outcome of the test in terms of rejection of the null hypothesis with 0.01 significance is the same for the data evaluated in this paper and in [15].
The number of test cases that pass the test, i.e. having p-value greater than the defined 0.01 significance level, is reported in Table XI: the largest number of successes of the test is observed with Geant4 9.1, using electron-photon models based on the EEDL-EPDL evaluated data libraries.
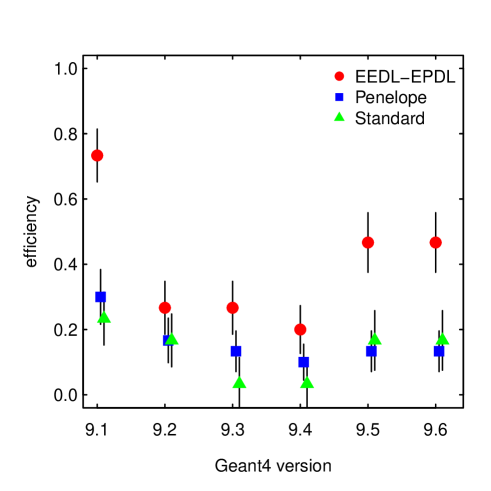
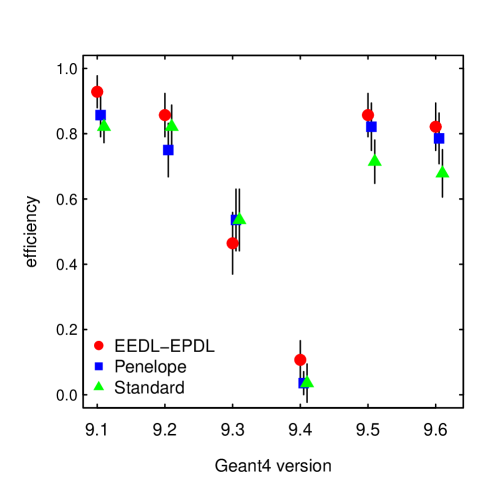
For convenience, the “efficiency” of a Geant4 simulation configuration is defined as the fraction of test cases in which the test does not reject the null hypothesis at 0.01 level of significance: this quantifies the capability of that simulation configuration to produce results statistically consistent with experiment over the whole set of experimental conditions. The test cases with uranium targets are not considered in the calculation of the efficiencies, as discussed in section II.
The efficiency of Geant4 configurations is plotted in Fig. 13 as a function of Geant4 version for the three sets of electron-photon models examined in this paper. In all experimental configurations the best efficiency is obtained with Geant4 electron-photon models based on the EEDL and EPDL evaluated data libraries. According to Table XI and Fig. 13, the best compatibility with experimental data is achieved with Geant4 version 9.1.

VI-B Evaluation of electron-photon modeling alternatives
This analysis compares the relative capability of Geant4 electron-photon models of producing simulations consistent with experimental data.
Electron-photon interactions determine the main characteristics of the simulated energy deposition. It is worthwhile to note that electron-photon models are not solely responsible for the overall compatibility with experimental data: other Geant4 physics components, such as the simulation of multiple scattering and of energy loss fluctuations, contribute to the shape of the energy deposition as well. Therefore, the appraisal of the relative merits of different electron-photon models is performed within the context of a given Geant4 version, where other factors which may affect the simulation can be considered constant and common to all test cases.
The input to the comparison of the accuracy of the three modeling alternatives consists of the outcome of the test for compatibility with experimental data. Table XI summarizes the number of test cases where the test rejects or does not reject the hypothesis of equivalence between simulated and experimental energy deposition profiles. Contingency tables are built based on these results, as described in Table VI, and the modeling alternatives they encompass are compared by means of the tests discussed in section V-B. The p-values resulting from the tests on these contingency tables are reported in Tables XII, XIII and XIV.
| Geant4 version | |||||||
|---|---|---|---|---|---|---|---|
| Geant4 models | 9.1 | 9.2 | 9.3 | 9.4 | 9.5 | 9.6 | |
| Pass | EEDL-EPDL | 22 | 8 | 8 | 6 | 14 | 14 |
| Penelope | 9 | 5 | 4 | 3 | 4 | 4 | |
| Standard | 7 | 5 | 1 | 1 | 5 | 5 | |
| Fail | EEDL-EPDL | 8 | 22 | 22 | 24 | 16 | 16 |
| Penelope | 21 | 25 | 26 | 27 | 26 | 26 | |
| Standard | 23 | 25 | 29 | 29 | 25 | 25 | |
| Geant4 version | ||||||
|---|---|---|---|---|---|---|
| Test | 9.1 | 9.2 | 9.3 | 9.4 | 9.5 | 9.6 |
| Fisher | 0.002 | 0.532 | 0.333 | 0.472 | 0.010 | 0.010 |
| Pearson | 0.001 | 0.347 | - | - | - | - |
| Barnard | 0.001 | 0.527 | 0.245 | 0.308 | 0.006 | 0.005 |
| Z-pooled | 0.001 | 0.527 | 0.245 | 0.308 | 0.006 | 0.006 |
| Boschloo | 0.001 | 0.378 | 0.245 | 0.366 | 0.006 | 0.006 |
| Geant4 version | ||||||
|---|---|---|---|---|---|---|
| Test | 9.1 | 9.2 | 9.3 | 9.4 | 9.5 | 9.6 |
| Fisher | 0.532 | 0.026 | 0.103 | 0.025 | 0.025 | |
| Pearson | 0.347 | - | - | 0.012 | 0.012 | |
| Barnard | 0.527 | 0.014 | 0.055 | 0.014 | 0.014 | |
| Z-pooled | 0.527 | 0.014 | 0.055 | 0.014 | 0.014 | |
| Boschloo | 0.378 | 0.014 | 0.056 | 0.014 | 0.014 | |
| Geant4 version | ||||||
|---|---|---|---|---|---|---|
| Test | 9.1 | 9.2 | 9.3 | 9.4 | 9.5 | 9.6 |
| Fisher | 0.771 | 1.000 | 0.353 | 0.612 | 1 | 1 |
| Pearson | 0.559 | 1.000 | 0.161 | 0.301 | 0.718 | 0.718 |
| Barnard | 0.680 | 1.000 | 0.236 | 0.362 | 0.815 | 0.815 |
| Z-pooled | 0.680 | 1.000 | 0.236 | 0.362 | 0.815 | 0.815 |
| Boschloo | 0.617 | 1.000 | 0.245 | 0.519 | 1 | 1 |
Table XII shows that Geant4 electron-photon models based on EEDL-EPDL and the Penelope-like models result in significantly different accuracies of the longitudinal energy deposition pattern of electrons simulated by Geant4 versions 9.1, 9.5 and 9.6. The significance level of these tests is 0.01. Regarding the marginal compatibility between the two categories in Geant4 versions 9.5 and 9.6 according to Fisher’s exact test, one should take into account that this test is conservative, when applied to experimental designs that do not constrain both row and column totals in the associated contingency tables. The two sets of models produce statistically equivalent results in Geant4 versions 9.2, 9.3 and 9.4. It is worthwhile to note that the “efficiency”, reported in Fig. 13, is quite low for all electron-photon models in these versions, not exceeding 0.3 for any model: this observation suggests that the analysis of contingency tables for these Geant4 versions would have scarce discriminating power to appreciate differences in accuracy associated with any model.
According to Table XIII, the hypothesis of equivalent compatibility with experiment for the electron-photon models based on EEDL-EPDL and the models in the “standard” package is rejected in Geant4 version 9.1, while it is not rejected in the later versions. The efficiency of both sets of models is lower in Geant4 versions later than 9.1, therefore the result of the statistical tests cannot be explained by an improvement of the accuracy of the models in Geant4 standard electromagnetic package. This result could be due to a worse degradation of the accuracy of the models based on EEDL-EPDL than of the standard ones in versions later than 9.1, or could be explained by the loss of discriminating power of the tests over contingency tables, when only a small number of test cases “pass” the test of compatibility between simulation and experiment.
Based on the results in Tables XII and XIII, one can conclude that the three sets of electron-photon models contribute to significantly different simulation accuracy when using Geant4 9.1, while, along with a general degradation of simulation accuracy in later Geant4 versions, the selection of electron-photon models is less critical when using other, more recent versions.
The simulations based on Penelope-like and standard electron-photon models exhibit statistically equivalent compatibility with experimental data: the null hypothesis of equivalence of the two categories is never rejected in any of the test cases summarized in Table XIV.


VI-C Evolution of Penelope-like electron-photon modeling
The general trend of the results reported in section VI-B does not suggest any major variations in the compatibility of the Penelope-like models with experimental data, where differences could have arisen due to the update from Penelope 2001 to Penelope 2008. Since classes reengineered from both Penelope versions cohexist in Geant4 9.5, it is possible to compare their accuracy directly in that context.
Longitudinal energy deposition profiles were produced with Geant4 9.5 using both implementations of Penelope-like electron-photon models, keeping all other simulation features unchanged, and were subject to the same analysis procedure. The results of the test appear similar for the two implementations: the number of test cases that “pass” the test is 4 and 5, using code reengineered from Penelope 2008 and 2001 respectively, while the hypothesis of compatibility with experimental measurements is rejected in 26 and 25 test cases respectively.
The analysis of the resulting 22 table does not reject the hypothesis of equivalent compatibility with experiment using Penelope 2008 or 2001: the p-value of McNemar’s test is 0.317, while it is 1 for McNemar’s exact test. These results suggest that the reengineered Penelope 2008 models do not represent a significant improvement with respect to the 2001 ones in the experimental scenario subject to evaluation.
VI-D Evolution over Geant4 versions
One can observe in Fig. 13 a similar trend associated with all Geant4 electron-photon models: for each modeling option the highest efficiency is achieved with Geant4 9.1, the lowest with Geant4 9.4, while some improvement with respect to the results of Geant4 9.4 is visible with Geant4 9.5 and 9.6, although the efficiency associated with these versions remains lower than with Geant4 9.1. This trend suggests that the accuracy of the simulation is also influenced by other Geant4 features, which appear independent from the electron-photon settings selected in the user application. This issue was already discussed in [15], although in that case the observation was limited to two Geant4 versions, while a larger simulation data sample is analyzed here.
The equivalence in compatibility with experiment of different Geant4 versions is estimated by means of an analysis of matched pairs, to which McNemar’s [57] test is applied. Matched pairs consist of simulations with identical physics settings in the user application, whose compatibility with experimental data is evaluated before and after a Geant4 kernel evolution, i.e. based on a given Geant4 version and on a later one.
The test is applied to 22 tables built as specified in Table VII; matched pairs consist of test cases involving Geant4 9.1 and a later version. The p-values for matched pairs concerning Geant4 versions 9.2 to 9.6 are reported in Table XV for a calculation based on the asymptotic distribution and for the ”exact” test. The null hypothesis of equivalent compatibility with experimental data with Geant4 9.1 and with any later versions is rejected with 0.01 significance.
| Geant4 version compared to 9.1 | |||||
| McNemar test | 9.2 | 9.3 | 9.4 | 9.5 | 9.6 |
| 0.005 | 0.005 | ||||
| Exact | 0.001 | 0.008 | 0.008 | ||
A thorough investigation of the causes of the deterioration of the compatibility between simulated and experimental energy deposition profiles is outside the scope of this paper; presumably, changes to multiple scattering code and possibly to other electromagnetic physics features contribute to the results of Table VII. A limited assessment is documented in the following section.
VI-E Multiple scattering settings
The behavior of Geant4 multiple scattering process can be configured by selecting a model to be instantiated and setting the values of some empirical parameters embedded in the software implementation. While a thorough assessment of the optimization of all such options is outside the scope of this paper, some limited investigation was performed to assess to which extent the evolution of default multiple scattering settings, summarized in Table V, could contribute to the accuracy of the simulation.
The accuracy of energy deposition profiles was estimated by performing simulations with a given Geant4 version in different conditions: the default configuration of electron multiple scattering and modified configurations, where the current default settings associated with that version were replaced by settings implemented as default values in previous Geant4 versions. These simulations were performed with Geant4 version 9.5p01, which at the time these studies were made was the latest released version; since all the validation tests reported in this paper show largely similar, or even identical results with Geant4 9.5 and 9.6, this investigation was not repeated with Geant4 9.6.
The skin parameter was modified from the default value of 1 in Geant4 9.5 to 3, which is the default value in Geant4 9.2 and 9.3; the range factor parameter, which is set to 0.04 by default in Geant4 9.5, was changed to 0.02, which is the default value in Geant4 9.1 and 9.2. The default multiple scattering model was modified from G4UrbanMscModel95 to G4UrbanMscModel93, which is the default model in Geant4 9.4. Only one default setting was modified in each simulation production to best appraise its effect. The electron-photon models based on EEDL-EPDL were used in all these simulations; all the other settings of the simulations were identical.
The number of test cases that pass, or fail the test of compatibility with the experimental energy deposition profiles is listed in Table XVI for the various configurations subject to evaluation, along with the resulting “efficiency”.
| Default | Model | skin | Range Factor | |
|---|---|---|---|---|
| configuration | Urban93 | 3 | 0.02 | |
| Pass | 14 | 7 | 14 | 15 |
| Fail | 16 | 23 | 16 | 15 |
| Efficiency | 0.470.09 | 0.230.08 | 0.470.09 | 0.500.09 |
The effect of the changes to the skin and range factor parameters on the compatibility with experimental data is negligible. Regarding the test cases that “pass” the test of compatibility with experimental data, the result with modified skin is identical to that with the default multiple scattering configuration (apart some numerical differences of the individual p-values, which anyway do not alter the outcome of the test at the defined level of significance). A small improvement in compatibility with experiment is obtained with the modified range factor; nevertheless, this increase in “efficiency” is statistically insignificant.
More significant effects are observed by changing the multiple scattering model. The compatibility with the experimental data from [1] appears to be severely affected by the selection of the multiple scattering modeling option. Table XVI shows that the “efficiency” of the simulation drops from 0.470.09 with the default configuration to 0.230.08 with G4UrbanMscModel93. The efficiency obtained with Geant4 9.5 and G4UrbanMscModel93 is comparable to that obtained with Geant4 9.4, where the same model is instantiated in the default multiple scattering configuration. This result hints that G4UrbanMscModel93 could be responsible for the lower compatibility with experimental data of simulations produced with Geant4 9.4 generally observed in the validation tests documented in this paper. Scarce documentation about the physics features, software implementation and evolution of Urban multiple scattering calculation is available in the literature and in Geant4 software manuals; therefore the identification of the features in the two examined variants of the Urban model that are responsible for significantly different behavior is not practically feasible within the scope of this paper.
VI-F Multiple scattering with Goudsmit-Saunderson and Urban models
| Target | E | Angle | Geant4 version | ||||
| Z | (kev) | (degrees) | 9.3 | 9.4 | 9.5 | 9.6 | |
| Be | 4 | 58 | 0 | 0.124 | 0.352 | 0.435 | 0.446 |
| Be | 4 | 109 | 0 | 0.264 | 0.089 | 0.084 | |
| Be | 4 | 314 | 0 | ||||
| Be | 4 | 521 | 0 | ||||
| Be | 4 | 1033 | 0 | ||||
| C | 6 | 1000 | 0 | ||||
| Al | 13 | 314 | 0 | ||||
| Al | 13 | 521 | 0 | ||||
| Al | 13 | 1033 | 0 | ||||
| Al | 13 | 314 | 60 | 0.003 | 0.005 | 0.003 | |
| Al | 13 | 521 | 60 | 0.214 | |||
| Al | 13 | 1033 | 60 | ||||
| Fe | 26 | 300 | 0 | 0.024 | 0.320 | 0.468 | 0.400 |
| Fe | 26 | 500 | 0 | ||||
| Fe | 26 | 1000 | 0 | ||||
| Cu | 29 | 300 | 0 | ||||
| Cu | 29 | 500 | 0 | ||||
| Mo | 42 | 100 | 0 | ||||
| Mo | 42 | 300 | 0 | ||||
| Mo | 42 | 500 | 0 | 0.014 | 0.005 | 0.011 | |
| Mo | 42 | 1000 | 0 | ||||
| Mo | 42 | 300 | 60 | ||||
| Mo | 42 | 500 | 60 | ||||
| Mo | 42 | 1000 | 60 | ||||
| Ta | 73 | 300 | 0 | 0.076 | 0.010 | 0.010 | 0.009 |
| Ta | 73 | 500 | 0 | 0.042 | 0.020 | 0.019 | 0.032 |
| Ta | 73 | 1000 | 0 | 0.003 | 0.002 | 0.007 | |
| Ta | 73 | 500 | 60 | ||||
| Ta | 73 | 1000 | 60 | ||||
| Ta | 73 | 500 | 30 | 0.006 | 0.004 | 0.003 | 0.004 |
An implementation based on Goudsmit-Saunderson calculations [61, 62], specialized for the transport of electrons, has been available in Geant4 for the simulation of multiple scattering since version 9.3 [27]. An example of energy deposition profiles obtained activating this multiple scattering model in the simulation application is illustrated in Fig. 14, where profiles produced with the default variant of the Urban model are also shown.

The contribution of the Goudsmit-Saunderson multiple scattering implementation to simulation accuracy has been estimated by evaluating the longitudinal energy deposition patterns produced in a physics configuration, where this model is activated in place of the default “Urban” algorithm. These simulations were produced with the electron-photon models based on EEDL-EPDL data libraries: thanks to the higher “efficiency” associated with this set of electron-photon models with respect to the two other modeling options, statistically significant variations of the simulation accuracy are more easily visible in the distributions produced with different multiple scattering options along with EEDL-EPDL electron-photon models.
The p-values resulting from the tests in the experimental configurations of [1] are listed in Table XVII. The number of test cases that pass or fail the test with 0.01 significance is reported in Table XVIII. The efficiency, defined as in sectionVI-A, is listed in Table XIX. The results produced with the Goudsmit-Saunderson multiple scattering model appear similar in all Geant4 versions.
The Goudsmit-Saunderson multiple scattering model produces similar results to the Urban92 model of Geant4 9.3 and the Urban93 model of Geant4 9.4, while one can observe qualitatively that in Geant4 9.5 and 9.6 the simulations produced with the Urban95 multiple scattering model are compatible with experimental data in a larger fraction of test cases than those produced with the Goudsmit-Saunderson model. This qualitative observation is confirmed by the statistical comparison of the compatibility with experimental data associated with either of the two multiple scattering models.
The relative contribution of the two multiple scattering models to the compatibility of simulation with experimental data is analyzed by means of McNemar’s test; the resulting p-values are listed in Table XX, both for the plain McNemar test and for the “exact” test.
The results in Table XX reject the hypothesis of equivalent compatibility with experimental data using Urban95 or Goudsmit-Saunderson multiple scattering models. The null hypothesis is not rejected for the Urban92 and Urban93 models; nevertheless, one should take into account the generally low compatibility with experimental data achieved with Geant4 9.3 and 9.4.
The outcome of this quantitative analysis suggests that, regarding the accuracy of the resulting energy deposition, the Goudsmit-Saunderson multiple scattering model is not preferable to the Urban model in the simulation of the longitudinal profile of the energy deposited by low energy electrons.
| Geant4 version | |||||
|---|---|---|---|---|---|
| Model | test | 9.3 | 9.4 | 9.5 | 9.6 |
| Goudsmit | Pass | 5 | 6 | 5 | 5 |
| Saunderson | Fail | 25 | 24 | 25 | 25 |
| Urban | Pass | 8 | 6 | 14 | 14 |
| Fail | 22 | 24 | 16 | 16 | |
| Geant4 version | ||||
|---|---|---|---|---|
| Model | 9.3 | 9.4 | 9.5 | 9.6 |
| Goudsmit | 0.17 0.07 | 0.20 0.07 | 0.17 0.07 | 0.17 0.07 |
| Saunderson | ||||
| Urban | 0.27 0.08 | 0.20 0.07 | 0.47 0.09 | 0.47 0.09 |
| Geant4 version compared to 9.1 | ||||
| Test | 9.3 | 9.4 | 9.5 | 9.6 |
| McNemar exact | 0.453 | 1.000 | 0.004 | 0.004 |
| McNemar | 0.257 | 1.000 | 0.003 | 0.003 |

VII Results: total energy deposition
This part of the validation process concerns the comparison of simulations with measurements of total deposited energy reported in [3].
The validation analysis reported in the following is limited to the test cases concerning beryllium, carbon, aluminium, titanium and tantalum targets: as discussed in section II, the uranium data appear to be affected by systematic effects [3], while the measurements with molybdenum targets performed with two experimental techniques reported in [3] exhibit in some cases differences exceeding three standard deviations (up to 8 standard deviations), which also hint to the presence of some systematic effects in the total energy measurements concerning this target material. It should be noted that in other cases for which measurements with two experimental techniques are reported in [3] the two sets of experimental values differ in average by 1.2 standard deviation. The apparent systematic effects in the measurements with molybdenum are indeed prone to bias the validation results: depending on which set of experimental data is taken as a reference for the validation of the simulation, one would draw different conclusions regarding the compatibility of simulations involving molybdenum targets resulting from different Geant4 electron-photon models. Since the experimental references do not provide sufficient information to discriminate the reliability of the two sets of experimental data, neither experimental references for molybdenum were included in the validation process.
Two further measurements were not considered in the validation analysis: they concern the energy deposition in carbon resulting from 25 keV electrons, irrespective of the angle of incidence of the beam, and from 75 keV electrons incident at 75 degrees. These test cases appear to generate largely inconsistent results with respect to all the others; due to insufficient details in the experimental references, it is impossible to ascertain whether these measurements are affected by systematic effects, or the simulation models are inadequate to reproduce them correctly. Since other test cases at similar energy and incidence angle appear to be reproduced adequately by all simulation models, one may suspect indeed the presence of systematic effects.
The relative difference between simulated and experimentally measured total energy deposition is shown in Fig. 15 for the electron-photon models and Geant4 versions evaluated in this paper. The relative difference is defined as , where is the total energy deposited in the calorimeter. The horizontal scale in these plots spans the same range as in Fig. 3, which concerns relative difference between simulated and experimental longitudinal energy deposition profiles: it is qualitatively evident that the distributions in Fig. 15 are in general narrower than those in Fig. 3.
The total deposited energy produced by simulations with the electron-photon models based on EEDL-EPDL evaluated data libraries and default multiple scattering settings are shown in Fig. 16-22 for all test cases and Geant4 versions. The plots also report the experimental data of [3].


The p-values resulting from the test over all experimental configurations are listed in Tables XXI, XXII and XXIII for Geant4 electron-photon interaction models based on EEDL-EPDL, originating from Penelope and implemented in the “standard” electromagnetic package respectively. The number of test cases for which the hypothesis of equivalent simulated and experimental total energy deposition is rejected or not rejected by the test are summarized in Table XXIV.
The efficiency of different Geant4 configurations is plotted in Fig. 23 as a function of Geant4 version for the three electron-photon model option examined in this paper.
| Target | Angle | Geant4 version | ||||||
|---|---|---|---|---|---|---|---|---|
| Z | (degrees) | 9.1 | 9.2 | 9.3 | 9.4 | 9.5 | 9.6 | |
| Be | 4 | 1 | 0.479 | 0.436 | 0.603 | 0.001 | 0.386 | 0.388 |
| Be | 4 | 16 | 0.991 | 0.982 | 0.988 | 0.001 | 0.944 | 0.944 |
| Be | 4 | 31 | 0.876 | 0.911 | 0.438 | 0.001 | 0.905 | 0.903 |
| Be | 4 | 46 | 0.776 | 0.893 | 0.012 | 0.001 | 0.884 | 0.873 |
| Be | 4 | 61 | 0.791 | 0.961 | 0.001 | 0.001 | 0.765 | 0.764 |
| Be | 4 | 76 | 0.008 | 0.040 | 0.001 | 0.001 | 0.001 | 0.001 |
| Be | 4 | 83.5 | 0.001 | 0.001 | 0.001 | 0.001 | 0.001 | 0.001 |
| C | 6 | 0 | 0.207 | 0.088 | 0.160 | 0.001 | 0.086 | 0.078 |
| C | 6 | 15 | 0.188 | 0.073 | 0.171 | 0.001 | 0.081 | 0.070 |
| C | 6 | 30 | 0.062 | 0.009 | 0.073 | 0.001 | 0.020 | 0.015 |
| C | 6 | 45 | 0.078 | 0.004 | 0.167 | 0.001 | 0.043 | 0.026 |
| C | 6 | 60 | 0.026 | 0.001 | 0.065 | 0.001 | 0.037 | 0.006 |
| C | 6 | 75 | 0.948 | 0.149 | 0.003 | 0.001 | 0.951 | 0.925 |
| C | 6 | 82.5 | 0.671 | 0.858 | 0.001 | 0.001 | 0.027 | 0.017 |
| Al | 13 | 0 | 0.670 | 0.849 | 0.010 | 0.001 | 0.831 | 0.759 |
| Al | 13 | 15 | 0.458 | 0.730 | 0.001 | 0.001 | 0.588 | 0.478 |
| Al | 13 | 30 | 0.455 | 0.829 | 0.001 | 0.001 | 0.519 | 0.480 |
| Al | 13 | 45 | 0.578 | 0.941 | 0.001 | 0.001 | 0.338 | 0.272 |
| Al | 13 | 60 | 0.725 | 0.781 | 0.001 | 0.001 | 0.138 | 0.024 |
| Al | 13 | 75 | 0.111 | 0.519 | 0.001 | 0.001 | 0.001 | 0.001 |
| Ti | 22 | 0 | 0.301 | 0.033 | 0.023 | 0.001 | 0.356 | 0.341 |
| Ti | 22 | 15 | 0.696 | 0.051 | 0.076 | 0.001 | 0.762 | 0.749 |
| Ti | 22 | 30 | 0.246 | 0.227 | 0.001 | 0.001 | 0.185 | 0.177 |
| Ti | 22 | 45 | 0.159 | 0.206 | 0.001 | 0.001 | 0.045 | 0.050 |
| Ti | 22 | 60 | 0.214 | 0.223 | 0.001 | 0.001 | 0.021 | 0.019 |
| Ti | 22 | 75 | 0.345 | 0.330 | 0.001 | 0.001 | 0.002 | 0.002 |
| Ta | 73 | 0 | 0.066 | 0.176 | 0.055 | 0.039 | 0.129 | 0.111 |
| Ta | 73 | 30 | 0.092 | 0.164 | 0.080 | 0.092 | 0.116 | 0.131 |
| Ta | 73 | 60 | 0.093 | 0.182 | 0.189 | 0.226 | 0.163 | 0.158 |
| Target | Angle | Geant4 version | ||||||
|---|---|---|---|---|---|---|---|---|
| Z | (degrees) | 9.1 | 9.2 | 9.3 | 9.4 | 9.5 | 9.6 | |
| Be | 4 | 1 | 0.482 | 0.448 | 0.590 | 0.001 | 0.393 | 0.398 |
| Be | 4 | 16 | 0.993 | 0.986 | 0.981 | 0.001 | 0.949 | 0.948 |
| Be | 4 | 31 | 0.883 | 0.919 | 0.426 | 0.001 | 0.913 | 0.910 |
| Be | 4 | 46 | 0.797 | 0.893 | 0.010 | 0.001 | 0.895 | 0.883 |
| Be | 4 | 61 | 0.762 | 0.932 | 0.001 | 0.001 | 0.744 | 0.736 |
| Be | 4 | 76 | 0.005 | 0.036 | 0.001 | 0.001 | 0.001 | 0.001 |
| Be | 4 | 83.5 | 0.001 | 0.001 | 0.001 | 0.001 | 0.001 | 0.001 |
| C | 6 | 0 | 0.206 | 0.104 | 0.190 | 0.001 | 0.082 | 0.074 |
| C | 6 | 15 | 0.189 | 0.093 | 0.204 | 0.001 | 0.074 | 0.070 |
| C | 6 | 30 | 0.053 | 0.013 | 0.104 | 0.001 | 0.018 | 0.014 |
| C | 6 | 45 | 0.067 | 0.008 | 0.226 | 0.001 | 0.036 | 0.022 |
| C | 6 | 60 | 0.018 | 0.001 | 0.060 | 0.001 | 0.026 | 0.005 |
| C | 6 | 75 | 0.892 | 0.214 | 0.001 | 0.001 | 0.977 | 0.975 |
| C | 6 | 82.5 | 0.845 | 0.929 | 0.001 | 0.001 | 0.062 | 0.048 |
| Al | 13 | 0 | 0.795 | 0.868 | 0.024 | 0.001 | 0.890 | 0.828 |
| Al | 13 | 15 | 0.612 | 0.739 | 0.003 | 0.001 | 0.725 | 0.626 |
| Al | 13 | 30 | 0.669 | 0.851 | 0.001 | 0.001 | 0.736 | 0.686 |
| Al | 13 | 45 | 0.827 | 0.971 | 0.001 | 0.001 | 0.586 | 0.610 |
| Al | 13 | 60 | 0.797 | 0.613 | 0.001 | 0.001 | 0.317 | 0.115 |
| Al | 13 | 75 | 0.499 | 0.834 | 0.001 | 0.001 | 0.001 | 0.001 |
| Ti | 22 | 0 | 0.074 | 0.008 | 0.069 | 0.001 | 0.100 | 0.087 |
| Ti | 22 | 15 | 0.113 | 0.009 | 0.146 | 0.001 | 0.184 | 0.149 |
| Ti | 22 | 30 | 0.334 | 0.094 | 0.059 | 0.001 | 0.534 | 0.465 |
| Ti | 22 | 45 | 0.334 | 0.077 | 0.025 | 0.001 | 0.493 | 0.484 |
| Ti | 22 | 60 | 0.440 | 0.048 | 0.032 | 0.001 | 0.720 | 0.651 |
| Ti | 22 | 75 | 0.451 | 0.096 | 0.111 | 0.001 | 0.704 | 0.712 |
| Ta | 73 | 0 | 0.874 | 0.487 | 0.861 | 0.842 | 0.805 | 0.824 |
| Ta | 73 | 30 | 0.924 | 0.679 | 0.813 | 0.890 | 0.751 | 0.728 |
| Ta | 73 | 60 | 0.851 | 0.681 | 0.601 | 0.623 | 0.706 | 0.755 |
| Target | Angle | Geant4 version | ||||||
|---|---|---|---|---|---|---|---|---|
| Z | (degrees) | 9.1 | 9.2 | 9.3 | 9.4 | 9.5 | 9.6 | |
| Be | 4 | 1 | 0.466 | 0.438 | 0.580 | 0.001 | 0.390 | 0.390 |
| Be | 4 | 16 | 0.992 | 0.985 | 0.986 | 0.001 | 0.941 | 0.941 |
| Be | 4 | 31 | 0.909 | 0.923 | 0.505 | 0.001 | 0.910 | 0.913 |
| Be | 4 | 46 | 0.891 | 0.931 | 0.021 | 0.001 | 0.938 | 0.930 |
| Be | 4 | 61 | 0.954 | 0.996 | 0.001 | 0.001 | 0.898 | 0.903 |
| Be | 4 | 76 | 0.090 | 0.213 | 0.001 | 0.001 | 0.002 | 0.001 |
| Be | 4 | 83.5 | 0.001 | 0.001 | 0.001 | 0.001 | 0.001 | 0.001 |
| C | 6 | 0 | 0.165 | 0.115 | 0.180 | 0.001 | 0.062 | 0.059 |
| C | 6 | 15 | 0.149 | 0.096 | 0.191 | 0.001 | 0.054 | 0.052 |
| C | 6 | 30 | 0.032 | 0.016 | 0.092 | 0.001 | 0.009 | 0.007 |
| C | 6 | 45 | 0.031 | 0.011 | 0.210 | 0.001 | 0.013 | 0.008 |
| C | 6 | 60 | 0.003 | 0.001 | 0.072 | 0.001 | 0.005 | 0.001 |
| C | 6 | 75 | 0.582 | 0.167 | 0.005 | 0.001 | 0.955 | 0.946 |
| C | 6 | 82.5 | 0.950 | 0.808 | 0.001 | 0.001 | 0.206 | 0.224 |
| Al | 13 | 0 | 0.818 | 0.828 | 0.023 | 0.001 | 0.840 | 0.731 |
| Al | 13 | 15 | 0.718 | 0.793 | 0.004 | 0.001 | 0.653 | 0.500 |
| Al | 13 | 30 | 0.801 | 0.901 | 0.002 | 0.001 | 0.822 | 0.753 |
| Al | 13 | 45 | 0.925 | 0.979 | 0.001 | 0.001 | 0.745 | 0.756 |
| Al | 13 | 60 | 0.790 | 0.596 | 0.001 | 0.001 | 0.463 | 0.046 |
| Al | 13 | 75 | 0.702 | 0.899 | 0.001 | 0.001 | 0.003 | 0.001 |
| Ti | 22 | 0 | 0.046 | 0.017 | 0.054 | 0.001 | 0.070 | 0.060 |
| Ti | 22 | 15 | 0.064 | 0.016 | 0.120 | 0.001 | 0.122 | 0.117 |
| Ti | 22 | 30 | 0.284 | 0.143 | 0.055 | 0.001 | 0.446 | 0.444 |
| Ti | 22 | 45 | 0.232 | 0.141 | 0.042 | 0.001 | 0.502 | 0.488 |
| Ti | 22 | 60 | 0.240 | 0.097 | 0.056 | 0.001 | 0.729 | 0.655 |
| Ti | 22 | 75 | 0.316 | 0.068 | 0.253 | 0.001 | 0.805 | 0.799 |
| Ta | 73 | 0 | 0.686 | 0.411 | 0.685 | 0.760 | 0.654 | 0.676 |
| Ta | 73 | 30 | 0.589 | 0.514 | 0.586 | 0.723 | 0.574 | 0.654 |
| Ta | 73 | 60 | 0.525 | 0.310 | 0.247 | 0.344 | 0.612 | 0.580 |
| Geant4 version | |||||||
|---|---|---|---|---|---|---|---|
| Geant4 models | 9.1 | 9.2 | 9.3 | 9.4 | 9.5 | 9.6 | |
| Pass | EEDL-EPDL | 27 | 25 | 14 | 3 | 25 | 24 |
| Penelope | 27 | 24 | 18 | 3 | 26 | 25 | |
| Standard | 27 | 27 | 19 | 3 | 24 | 23 | |
| Fail | EEDL-EPDL | 2 | 4 | 15 | 26 | 4 | 5 |
| Penelope | 2 | 5 | 11 | 26 | 3 | 4 | |
| Standard | 2 | 2 | 10 | 26 | 5 | 6 | |
According to the results summarized in Fig. 23, the three options of Geant4 electron-photon models exhibit a similar behaviour in all Geant4 versions regarding the total energy deposited in the calorimeter. This results is confirmed by the statistical analysis comparing the outcome of the test with the same method as applied in sectionVI-B: all statistical tests applied to contingency tables comparing the three Geant4 electron-photon options produce p-values greater than the significance level of 0.01.
The efficiency appears equivalent in all versions with the exception of Geant4 9.4, for which it is significantly lower, and Geant4 9.3, which produces an intermediate result between the low efficiency of the 9.4 version and the higher values of the other versions subject to test. The results of the statistical analysis related to the evolution of the compatibility with experimental data over Geant4 versions are listed in Table XXV for the physics configuration with EEDL-EPDL electron-photon settings. Table XXV reports the comparison of the outcome of the test with Geant4 9.1 with the outcome of subsequent versions; the data samples are compared by means of McNemar’s exact test only, since the use of the asymptotic distribution for McNemar’s test calculation would not be justified due to the low number of entries in some cells of the 2x2 tables involved in this evaluation.
| Geant4 version compared to 9.1 | |||||
| McNemar test | 9.2 | 9.3 | 9.4 | 9.5 | 9.6 |
| Exact | 0.625 | 0.001 | 0.001 | 0.500 | 0.500 |
These results suggest that differences due to the intrinsic capabilities of the physics models and empirical algorithms implemented in Geant4 are mitigated by the characteristics of the geometrical configuration where the deposited energy is scored: in the two validation scenarios evaluated in this paper, statistically significant differences in compatibility with experimental data associated with Geant4 electron-photon models and versions are observed in the simulations corresponding to the experimental set-up of [1], which involves thin calorimeter layers, while they are less visible in the coarser detector set-up of [3].
The replacement of the default “Urban” multiple scattering model with the Goudsmit-Saunderson model leads to different conclusions with respect to what is observed in the thin layer scenario discussed in section VI-F. The p-values resulting from the test comparing the simulation results with Goudsmit-Saunderson multiple scattering model to the experimental total deposited energy of [3] are listed in Table XXVI, and the associated “efficiency” is reported in Table XXVII. One can observe that the compatibility with experimental data is approximately constant over the examined Geant4 versions, when the Goudsmit-Saunderson multiple scattering algorithm is used in the simulation, while large discrepancies are observed with the variants of the Urban model corresponding to different Geant4 versions. According to Table XXVII, better compatibility with experimental data is achieved with the Urban95 model used by default in Geant4 9.5 and 9.6, while the Goudsmit-Saunderson multiple scattering model provides more accurate total deposited energy simulations with Geant4 9.3 and 9.4. An example of the total deposited energy produced with the Goudsmit-Saunderson and variants of the Urban model is illustrated in Fig. 24.
The statistical significance of these qualitative observations is summarized in Table XXVIII for simulations using the EEDL-EPDL electron-photon settings: the two models contribute to a different compatibility with total deposited energy measurements in the Geant4 9.4 environment at a 0.01 significance level, while in the other environments the associated compatibility with experimental data is statistically equivalent.

| Target | angle | Geant4 version | ||||
|---|---|---|---|---|---|---|
| Z | (degrees) | 9.3 | 9.4 | 9.5 | 9.6 | |
| Be | 4 | 1 | 0.001 | 0.001 | 0.001 | 0.001 |
| Be | 4 | 16 | 0.864 | 0.904 | 0.848 | 0.846 |
| Be | 4 | 31 | 0.302 | 0.583 | 0.323 | 0.324 |
| Be | 4 | 46 | 0.078 | 0.592 | 0.046 | 0.046 |
| Be | 4 | 61 | 0.012 | 0.908 | 0.001 | 0.001 |
| Be | 4 | 76 | 0.034 | 0.006 | 0.001 | 0.001 |
| Be | 4 | 83.5 | 0.699 | 0.001 | 0.005 | 0.005 |
| C | 6 | 0 | 0.026 | 0.017 | 0.010 | 0.010 |
| C | 6 | 15 | 0.038 | 0.028 | 0.011 | 0.011 |
| C | 6 | 30 | 0.006 | 0.008 | 0.001 | 0.001 |
| C | 6 | 45 | 0.001 | 0.005 | 0.001 | 0.001 |
| C | 6 | 60 | 0.001 | 0.006 | 0.001 | 0.001 |
| C | 6 | 75 | 0.001 | 0.314 | 0.001 | 0.001 |
| C | 6 | 82.5 | 0.001 | 0.006 | 0.001 | 0.001 |
| Al | 13 | 0 | 0.033 | 0.449 | 0.060 | 0.060 |
| Al | 13 | 15 | 0.096 | 0.550 | 0.170 | 0.170 |
| Al | 13 | 30 | 0.007 | 0.251 | 0.017 | 0.013 |
| Al | 13 | 45 | 0.001 | 0.013 | 0.001 | 0.001 |
| Al | 13 | 60 | 0.001 | 0.001 | 0.001 | 0.001 |
| Al | 13 | 75 | 0.001 | 0.001 | 0.001 | 0.001 |
| Ti | 22 | 0 | 0.868 | 0.783 | 0.547 | 0.570 |
| Ti | 22 | 15 | 0.916 | 0.956 | 0.589 | 0.600 |
| Ti | 22 | 30 | 0.998 | 0.722 | 0.842 | 0.830 |
| Ti | 22 | 45 | 0.931 | 0.486 | 0.607 | 0.621 |
| Ti | 22 | 60 | 0.807 | 0.245 | 0.231 | 0.261 |
| Ti | 22 | 75 | 0.054 | 0.027 | 0.010 | 0.010 |
| Ta | 73 | 0 | 0.022 | 0.547 | 0.461 | 0.461 |
| Ta | 73 | 30 | 0.053 | 0.005 | 0.005 | 0.005 |
| Ta | 73 | 60 | 0.214 | 0.729 | 0.744 | 0.729 |
| Geant4 version | ||||
|---|---|---|---|---|
| Model | 9.3 | 9.4 | 9.5 | 9.6 |
| Goudsmit | 0.66 0.09 | 0.66 0.09 | 0.52 0.09 | 0.52 0.09 |
| Saunderson | ||||
| Urban | 0.48 0.09 | 0.10 0.06 | 0.86 0.06 | 0.83 0.07 |
| Geant4 version | ||||
| McNemar test | 9.3 | 9.4 | 9.5 | 9.6 |
| Exact | 0.049 | 0.001 | 0.057 | 0.092 |
VIII Conclusion
The extensive investigation of the capability of Geant4 to simulate the energy deposited by electrons summarized in this paper updates the results published in [15] to reflect the improvements to Geant4 electromagnetic physics mentioned in [23, 24, 25, 26]. Simulations involving different Geant4 physics modeling options and Geant4 versions have been compared with high precision experimental measurements, concerning electrons of energy up to approximately 1 MeV, various beam angles and materials. The validation of Geant4 simulation capabilities is quantified by means of the statistical analysis of simulated and experimental distributions.
The investigation was concerned with two experimental observables: the longitudinal energy deposition profile in thin layers (of approximately 5 to 90 m thickness) as a function of penetration depth, and the total energy deposited in larger volumes (of approximately 0.5-5 mm thickness).
Largely different conclusions can be drawn regarding the compatibility of the simulation with experimental measurements in the two scenarios. Simulations involving a coarser geometry exhibit limited sensitivity to different physics modeling options and the evolution of Geant4 electromagnetic physics, while the capability of simulating the energy deposited in layers of a few tens of micrometers thickness appears to deteriorate in later versions with respect to the results achieved by Geant4 9.1. Regarding energy deposition profiles in thin layers, equivalent or better accuracy of simulations based on later Geant4 versions with respect to 9.1 is excluded with 0.01 significance.
The implementation of electron multiple scattering in Geant4 significantly affects the accuracy of energy deposition. The Urban93 model appears responsible for degraded accuracy of the energy deposition simulation with respect to simulations using other variants of the Urban model. The Goudsmit-Saunderson model, specialized for the simulation of electron multiple scattering, is responsible for degraded accuracy with respect to the Urban95 model in both experimental scenarios; with respect to the Urban92 and Urban93 models applied by default in Geant4 9.3 and 9.4, it contributes to comparable inaccuracy in the thin layer scenario, but to less inaccurate results in the coarse grained one.
Statistically superior accuracy is achieved with Geant4 9.1 by using electron-photon models based on EEDL-EPDL, rather than other modeling alternatives, in the simulation of energy deposition profiles in thin layers. In the same scenario, electron-photon models in Geant4 standard electromagnetic package and models reengineered from Penelope exhibit statistically equivalent behavior. All electron-photon modeling alternatives produce equivalent results in simulations of coarse-grained detectors. No significant difference is associated with implementations reengineered from Penelope 2001 and 2008.
It is worthwhile to stress that these conclusions pertain to the experimental scenarios studied in this paper and should not be taken as general reflections of the performance of different Geant4 versions and physics models for all experimental scenarios.
From the perspective of using Geant4 in experimental applications dealing with the energy deposition by electrons in similar scenarios to those considered here, the simulation requirements of coarse-grained detectors can be satisfied by most of the Geant4 models and versions evaluated in this paper. Experiments concerned with accurate simulation of the energy deposition patterns produced by low energy electrons may prefer Geant4 9.1, using EEDL-EPDL based electron-photon models, with respect to later versions and other physics options.
The risk of negative improvements as a result of evolutions in Geant4 electromagnetic physics could be mitigated by the adoption of sound software engineering methods in support of physics modeling in Geant4 development process. Best practices in change management and software testing are embedded in established software process frameworks such as the Unified Model [63], CMMI (Capability Maturity Model Integration) [64] and ISO 15504 [65], or documented in specialized standards such as [66]. The adoption of a more agile software design of Geant4 electromagnetic physics [67], characterized by classes with focused responsibilities and minimal dependencies, facilitates both the validation of Geant4 physics functionality and the transparency of the related change management process. Regular use of statistical methods is recommended to quantify the compatibility with experimental measurements in the course of Geant4 evolution.
Acknowledgment
The Geant4-based simulation application used for this paper encompasses code implemented by Anton Lechner and Manju Sudhakar for the study published in [15].
The authors thank Nicholas Styles for proofreading the manuscript and valuable comments, Robert Andritschke and Stefanie Granato for helpful discussions.
The CERN Library, in particular Tullio Basaglia, has provided helpful assistance and essential reference material for this study.
References
- [1] G. Lockwood et al., “Calorimetric Measurement of Electron Energy Deposition in Extended Media - Theory vs Experiment”, SAND79-0414 Report, Sandia National Laboratories, Albuquerque, 1980.
- [2] G. J. Lockwood, G. H. Miller and J. A. Halbleib, “Absolute Measurement of Low Energy Electron Deposition Profiles in Semi-Infinite Geometries” IEEE Trans. Nucl. Sci., vol. 20, no. 6, pp. 326-330, 1973.
- [3] G. J. Lockwood et al., “Electron Energy and Charge Albedos - Calorimetric Measurement vs Monte Carlo Theory”, SAND80-1968 Report, Sandia National Laboratories, Albuquerque, 1981.
- [4] G. J. Lockwood, G. H. Miller and J. A. Halbleib, “Simultaneous Integral Measurement of Electron Energy and Charge Albedos ” IEEE Trans. Nucl. Sci., vol. 22, no. 6, pp. 2537-2542, 1975.
- [5] G. J. Lockwood, G. H. Miller and J. A. Halbleib, “Electron Energy Deposition in Multilayer Geometries”, IEEE Trans. Nucl. Sci., vol. 23, no. 6, pp. 1862-1866 , 1976.
- [6] J. A. Halbleib and T. A. Mehlhorn, “ITS : The Integrated TIGER Series of Coupled Electron/Photon Monte Carlo Transport Codes”, Sandia National Laboratories Report No. SAND84-0573, Albuquerque, November 1984.
- [7] I. Kawrakow and D. W. O. Rogers, “The EGSnrc System, a Status Report” in Proc. of the Monte Carlo 2000 Conf., Springer, Berlin, 2001.
- [8] O. Chibani and X. A. Li, “Monte Carlo dose calculations in homogeneous media and at interfaces: A comparison between GEPTS, EGSnrc, MCNP, and measurements”, Med. Phys., vol. 29, no. 5, pp. 835-847, 2002.
- [9] J. Sempau, J. M. Fernandez-Varea, E. Acosta and F. Salvat, “Experimental benchmarks of the Monte Carlo code Penelope”, Nucl. Instrum. Methods B, vol. 207, pp. 107-123, 2003.
- [10] S. Jun, “Benchmark Study for Energy Deposition by Energetic Electrons in Thick Elemental Slabs: Monte Carlo Results and Experiments”, IEEE Trans. Nucl. Sci., vol. 50, pp. 1732-1739, 2003.
- [11] J. F. Carrier, L. Archambault and L. Beaulieu, “Validation of GEANT4, an object-oriented Monte Carlo toolkit, for simulations in medical physics”, Med. Phys., vol. 31, no. 3, pp. 484-492, 2004.
- [12] V. N. Ivanchenko, “Geant4: physics potential for instrumentation in space and medicine”, Nucl. Instrum. Meth. A, vol. 525, pp 402-405, 2004.
- [13] H. K. Kim and O. Kum, “Development of a Parallel Electron and Photon Transport (PMCEPT) Code II: Absorbed Dose Computation in Homogeneous and Heterogeneous Media”, J. Korean Phys. Society, vol. 49, no. 4, pp. 1640-1651, 2006.
- [14] O. Kadri et al., “Geant4 simulation of electron energy deposition in extended media”, Nucl. Instrum. Meth. B, vol. 258, no. 2, pp. 381-387, 2007.
- [15] A. Lechner, M. G. Pia, and M. Sudhakar “Validation of Geant4 low energy electromagnetic processes against precision measurements of electron energy deposit”, IEEE Trans. Nucl. Sci., vol. 56, no. 2, pp. 398-416, 2009.
- [16] W. R. Nelson, H. Hirayama, and D. W. O. Rogers, “The EGS4 Code System”, SLAC-265 Report, Stanford, CA, 1985.
- [17] I. Kawrakow, E. Mainegra-Hing, D. W. O. Rogers, F. Tessier and B. R. B. Walters, “The EGSnrc Code System: Monte Carlo Simulation of Electron and Photon Transport NRCC PIRS-701, 5th printing, 2010.
- [18] S. Agostinelli et al., “Geant4 - a simulation toolkit” Nucl. Instrum. Meth. A, vol. 506, no. 3, pp. 250-303, 2003.
- [19] J. Allison et al., “Geant4 Developments and Applications” IEEE Trans. Nucl. Sci., vol. 53, no. 1, pp. 270-278, 2006.
- [20] X-5 Monte Carlo Team, “MCNP – A General Monte Carlo N-Particle Transport Code”, Los Alamos National Laboratory Report LA-UR-03-1987, 2003.
- [21] L. Waters et al., “The MCNPX Monte Carlo Radiation Transport Code”, in AIP Conf. Proc., vol. 896, pp. 81-90, 2006.
- [22] J. Baro, J. Sempau, J. M. Fernandez-Varea, and F. Salvat, “PENELOPE, an algorithm for Monte Carlo simulation of the penetration and energy loss of electrons and positrons in matter”, Nucl. Instrum. Meth. B, vol. 100, no. 1, pp. 31-46, 1995.
- [23] V. N. Ivanchenko et al., “Recent Improvements in Geant4 Electromagnetic Physics Models and Interfaces”, Progr. in Nucl. Sci Technol., vol. 2, pp.898-903, 2011.
- [24] A. Schälicke et al., “Geant4 electromagnetic physics for the LHC and other HEP applications”, J. Phys.: Conf. Ser. vol. 331, pp. 032029, 2011.
- [25] J. Allison et al., “New Geant4 model and interface developments for improved space electron transport simulations: First results”, in Proc. 12th Eur. Conf. Radiation and Its Effects on Components and Systems (RADECS) pp. 115-118, 2011.
- [26] J. Allison et al., “Geant4 electromagnetic physics for high statistic simulation of LHC experiments”, J. Phys.: Conf. Ser., vol. 396, pp. 022013, 2012.
- [27] O. Kadri, V. Ivanchenkob, F. Gharbi, and A. Trabelsi, “Incorporation of the Goudsmit-Saunderson electron transport theory in the Geant4 Monte Carlo code”, Nucl. Instrum. Meth. B, vol. 267, no. 23-24, pp. 3624-3632, 2009.
- [28] S. T. Perkins, D. E. Cullen, and S. M. Seltzer, “Tables and Graphs of Electron-Interaction Cross Sections from 10 eV to 100 GeV Derived from the LLNL Evaluated Electron Data Library (EEDL)”, UCRL-50400 Vol. 31, 1997.
- [29] D. Cullen et al., “EPDL97, the Evaluated Photon Data Library”, Lawrence Livermore National Laboratory Report UCRL-50400, Vol. 6, Rev. 5, 1997.
- [30] J. Apostolakis, S. Giani, M. Maire, P. Nieminen, M.G. Pia, L. Urban, “Geant4 low energy electromagnetic models for electrons and photons” INFN/AE-99/18, Frascati, 1999.
- [31] S. Chauvie, G. Depaola, V. Ivanchenko, F. Longo, P. Nieminen and M. G. Pia, “Geant4 Low Energy Electromagnetic Physics”, in Proc. Computing in High Energy and Nuclear Physics, Beijing, China, pp. 337-340, 2001.
- [32] S. Chauvie et al., “Geant4 Low Energy Electromagnetic Physics”, in 2004 IEEE Nucl. Sci. Symp. Conf. Rec., pp. 1881-1885, 2004.
- [33] V. N. Ivanchenko, M. Maire, and L. Urban, “Geant4 Standard electromagnetic package for HEP applications”, Conf. Rec. 2004 IEEE Nuclear Science Symposium, N33-179.
- [34] M. J. Berger, J. S. Coursey, M. A. Zucker and J. Chang, “Significance of Calculated Quantities”, [Online]. Available: http://physics.nist.gov/PhysRefData/Star/Text/appendix.html.
- [35] M. J. Berger, J. S. Coursey, M. A. Zucker and J. Chang, “ESTAR Stopping-Power and Range Tables for Electrons”, [Online]. Available: http://physics.nist.gov/PhysRefData/Star/Text/ESTAR.html.
- [36] L. Urban, “Multiple scattering model in Geant4”, CERN-OPEN-2002-070, Geneva, Switzerland, 2002.
- [37] L. Urban, “A Model for multiple scattering in Geant4”, in Proc. of The Monte Carlo Method: Versatility Unbounded in a Dynamic Computing World, on CD-ROM, American Nuclear Society, La Grange Park, IL, 2005.
- [38] L. Urban, “A model of multiple scattering in Geant4”, CERN-OPEN-2006-077, Geneva, Switzerland, 2006.
- [39] H. W. Lewis, “Multiple Scattering in an Infinite Medium”, Phys. Rev., vol. 78, pp. 526-529, 1950.
- [40] S. Elles, V. N. Ivanchenko, M. Maire and L. Urban, “Geant4 and Fano cavity: where are we?”, J. Phys.: Conf. Series, vol. 102, pp. 1-8, 2009.
- [41] F. Salvat, J. M. Fernandez-Varea, E. Acosta, and J. Sempau, “Penelope - A code system for Monte Carlo simulation of electron and photon transport”, Proc. NEA Workshop 19, 2001.
- [42] F. Salvat, J. M. Fernandez-Varea, and J. Sempau, “Penelope - A code system for Monte Carlo simulation of electron and photon transport”, Proc. NEA Workshop 6416, 2008.
- [43] M. Batic, G. Hoff, M. G. Pia, and P. Saracco, “Photon elastic scattering simulation: validation and improvements to Geant4”, IEEE Trans. Nucl. Sci., vol. 59, no. 4, pp. 1636-1664, 2012.
- [44] S. Guatelli, A. Mantero, B. Mascialino, P. Nieminen, and M. G. Pia, “Geant4 Atomic Relaxation”, IEEE Trans. Nucl. Sci., vol. 54, no. 3, pp. 585-593, 2007.
- [45] G. A. P. Cirrone et al., “A Goodness-of-Fit Statistical Toolkit”, IEEE Trans. Nucl. Sci., vol. 51, no. 5, pp. 2056-2063, 2004.
- [46] B. Mascialino, A. Pfeiffer, M. G. Pia, A. Ribon, and P. Viarengo, “New developments of the Goodness-of-Fit Statistical Toolkit”, IEEE Trans. Nucl. Sci., vol. 53, no. 6, pp. 3834-3841, 2006.
- [47] R Core Team, “R: A language and environment for statistical computing” R Foundation for Statistical Computing, Vienna, Austria, ISBN 3-900051-07-0, 2012. [Online]. Available: http://www.R-project.org/.
- [48] R. K. Bock and W. Krischer, “The Data Analysis BriefBook ”, Ed. Springer, Berlin, 1998.
- [49] K. Pearson, “On the test of Goodness of Fit”, Biometrika, vol. 14, no. 1-2, pp. 186-191, 1922.
- [50] R. A. Fisher, “On the interpretation of from contingency tables, and the calculation of P”, J. Royal Stat. Soc., vol. 85, no. 1, pp. 87-94, 1922.
- [51] G. A. Barnard, “ Significance tests for 2 × 2 tables”, Biometrika, vol. 34, pp. 123-138, 1947.
- [52] R. D. Boschloo, “Raised Conditional Level of Significance for the 22-table when Testing the Equality of Two Probabilities”, Stat. Neerlandica, vol. 24, pp. 1-35, 1970.
- [53] S. Suissa, and J. J. Shuster, “Exact Unconditional Sample Sizes for the 22 Binomial Trial”, J. Royal Stati. Soc., Ser. A, vol. 148, pp. 317-327, 1985.
- [54] A. Martin Andres and A. Silva Mato, “Choosing the optimal unconditioned test for comparing two independent proportions”, Comp. Stat. Data Anal., vol. 17, pp. 555-574, 1994.
- [55] A. Martin Andres, A. Silva Mato, J. M . Tapia Garcia, and M. J. Sanchez Quevedo, “Comparing the asymptotic power of exact tests in 2 × 2 tables”, Comp. Stat. Data Anal., vol. 47, pp. 745-756, 2004.
- [56] A. Agresti, “A Survey of Exact Inference for Contingency Tables”, Stat. Sci., vol. 7, pp. 131-153, 1992.
- [57] Q. McNemar, “ Note on the sampling error of the difference between correlated proportions or percentages”, Psychometrika, vol. 12, pp. 153-157, 1947.
- [58] B. M. Bennett and R. E. Underwood, “Note: On McNemar’s Test for the 2 2 Table and Its Power Function”, Biometrics, vol. 26, no. 2, pp. 339-343, 1970.
- [59] F. Yates, “Contingency table involving small numbers and the test”, J. Royal Stat. Soc. Suppl., vol. 1, pp. 217-235, 1934.
- [60] K. J. Lui, “Notes on Testing Equality in Dichotomous Data with Matched Pairs”, Biometr. J., vol. 43, no. 3, pp. 313–321, 2001.
- [61] S. Goudsmit and J. L. Saunderson, “Multiple Scattering of Electrons”, Phys. Rev., vol. 58, pp. 24-29, 1940.
- [62] S. Goudsmit and J. L. Saunderson, “Multiple Scattering of Electrons. II”, Phys. Rev., vol. 58, pp. 36-42, 1940.
- [63] I. Jacobson, J. Booch, and J. Rumbaugh, “The Unified Software Development Process”, 1st ed., Ed.: Addison-Wesley, 1999.
- [64] M. B. Chrissis, M. Konrad and S. Shrum, “CMMI® for Development”, Ed.: Addison-Wesley, 2011.
- [65] ISO/IEC Joint Technical Committee 1, “ISO/IEC DTR 15504 Part 5: An Assessment Model and Indicator Guidance”, Ed: J. M. Simon, 1999.
- [66] IEEE Computer Society, “IEEE Standard for Software Verification and Validation”, IEEE Std 1012-2004, 2005.
- [67] M. Batic et al., “Refactoring, reengineering and evolution: paths to Geant4 uncertainty quantification and performance improvement”, J. Phys.: Conf. Ser., vol. 396, pp. 022038, 2012.