Ch. Helling, ch@leap2010.eu
The impact of M-dwarf atmosphere modelling
on planet detection
Abstract
Being able to accurately estimate stellar parameters based on spectral observations is important not only for understanding the stars themselves but it is also vital for the determination of exoplanet parameters. M dwarfs are discussed as targets for planet detection as these stars are less massive, less luminous and have smaller radii making it possible to detect smaller and lighter planets. Therefore M-dwarfs could prove to be a valuable source for examining the lower mass end of planet distribution, but in order to do that, one must first take care to understand the characteristics of the host stars well enough.
Up to date, there are several families of stellar model atmospheres. We focus on the ATLAS9, MARCS and Drift-Phoenix families in the M-dwarf parameter space. We examine the differences in the (Tgas, pgas) structures, synthetic photometric fluxes and related colour indices. We find discrepancies in the hotter regions of the stellar atmosphere between the ATLAS and MARCS models. The MARCS and Drift-Phoenix models appear to agree to a better extend with variances of less than 300K. We have compiled the broad-band synthetic photometric fluxes of all models for the Johnson UBVRI and 2MASS JHKs. The fluxes of MARCS differ from both ATLAS and Drift-Phoenix models in the optical range.
keywords:
Stars: atmosphere models – Stars: synthetic photometry– Stars: colour indices1 Introduction
The hunt for exoplanets has been on for about 20 years since the discovery of the very first exoplanets (Wolszczan & Frail 1992, Mayor & Queloz 1995, Charbonneau D. et al. 2000). Up to date, there are 872 confirmed planets discovered in 683 planetary systems (exoplanet.eu). With various surveys, involving high-precision instruments, such as HARPS (Mayor et al. 2003), COROT (Auvergne et al. 2009) or KEPLER (Batalha et al. 2013) it is no surprise that, in the last two years, astronomers have detected more and more planets within the so-called Super-Earth group. However, our knowledge of a given planetary system dependents on the knowledge of its host star. This study is dedicated to the modeling of M-dwarf atmospheres and the implications these models could pose in relation to exoplanets.
2 Models used
The choice of models for this work consists of the ATLAS9 models (Kurucz 1970, Castelli & Kurucz 2004), the MARCS models (Gustafsson et al. 2008) and the Drift-Phoenix models (Dehn 2007, Helling et al. 2008b, Witte et al. 2009). All of these models obey LTE, hydrostatic and chemical equilibrium and energy flux conservation; they are homogeneous, 1D codes that assume plane-parallel symmetry.
The ATLAS models used here span the range for log(g) = 3.05.0, [Fe/H] = and effective temperature Teff = 3500 K4000 K. All these models are calculated with the convection option switched on but with the overshooting option switched off. A mixing length height with l/Hp= 1.25 and vturb = 2.0 km/s is adopted for all models.
The MARCS models used span log(g) = 3.05.0, [Fe/H] = , and Teff=3500K and 4000K in order to allow a comparison with the ATLAS models. Other MARCS models used are Teff = 2500K3000K, log(g) = 3.05.5, and [Fe/H]=0.0 for comparison with the Drift-Phoenix models. For all models, vturb= 2 km/s and solar element abundances (Grevesse et al. 2007) were chosen.
The Drift-Phoenix models are aimed specifically at late-type stars (M-dwarfs, brown dwarfs) and giant planet atmospheres as they include a model of dust cloud formation. The subset of models used is for the solar metalicity models with 2500K T 3000K and 3.0 log(g) 5.5 .
The different model families have a different coverage of the M-dwarf regime. We therefore have analysed pairs of models, in particular the ATLASMARCS models for Teff = 3500K and Teff = 4000K and varying log(g) and [Fe/H] values, as well as the MARCS+Phoenix models for solar metalicity and varying Teff and log(g) values. A total of 105 models were considered.
3 Atmospheric structure comparison
A comparison of the atmospheric structures of the different models includes the (Tgas, pgas) structures of model atmospheres with matching Teff, log(g) and [Fe/H] values, and the differences in the opacity structures.
We look at the residuals in local temperature versus local pressure between the ATLAS and MARCS models for Teff = 3500K and Teff = 4000K. It is interesting to note that while the 3500K models seem to match better in the metalicity range -1.5 [Fe/H] -2.5, the 4000K models display better agreement for [Fe/H]=+0.5 and [Fe/H]=0.0. For both Teff, the biggest discrepancies lie within the [Fe/H]=-1.0 models, with differences reaching over 1500K in the Teff=3500K and over 1200K for the Teff=4000K. We create residual plots for each pair of matching models by subtracting local temperature values at matching local pressure values by interpolating models where neccessary. In all cases, the models appear to diverge as the pressure increases, i.e. as going deeper into the atmosphere, regardless of particular values for Teff, log(g) or [Fe/H]. These trends are also reflected in the Rosseland mean opacities, where higher divergence in opacity residuals is observed for the same model parameter values described in this paragraph.
The MARCS and Drift-Phoenix grids have common models for only one metalicity ([Fe/H]=0.0) but for various effective temperatures (2500-3000K). We observe better agreement between MACRS and PHOENIX than there is between the MACRS and ATLAS models with respect to residual values. Overall, this set of models do not appear to vary by more than 300K (with the exception of the case for Teff=3000K and log(g)=3.0 and 3.5 ). That is again confirmed by the Rosseland mean opacity residuals.
In summary, we find that for the higher effective temperature values (3500K, 4000K) the ATLAS and MARCS temperature-pressure structures diverge from each other with an average of 600K in local temperature and extreme cases well over 1000K. In contrast, the MARCS and Drift-Phoenix only differ by 300K for for 2500K Teff 3000K. A direct comparison between ATLAS and Drift-Phoenix is currently not possible as these models do not share any common Teff values.
4 Synthetic photometry
The (Tgas, pgas) structure determines the emergent spectral energy distribution for stars. In order to compare the SEDs of the different models, we perform synthetic photometry of all models considered. We convolve the model SEDs to the Johnson UBVRI and 2MASS JHKs filter systems, using HST spectrum of Vega (Bohlin & Gilliland 2004) for zero-point calibration.
We compare the ratios between the synthetic broad-band fluxes for all pairs of corresponding models in each filter. A value of 1.0 corresponds to perfect match. The broad-band fluxes of ATLAS and MARCS in the optical (Johnson UBVR filters) differ significantly more than those in the IR range. The flux ratios for Teff = 3500K are deviating from 1.0 significantly more (as high as 1.8) than those for Teff=4000K (less than 1.3). There is also a discrepancy between the Drift-Phoenix and MARCS models at the optical wavelengths. What is more, the spread in ratios appears to be even bigger, with the highest values almost reaching a factor of 2.0 . Unfortunately, the ATLAS and Drift-Phoenix families do not have any models in common to allow for a direct comparison.
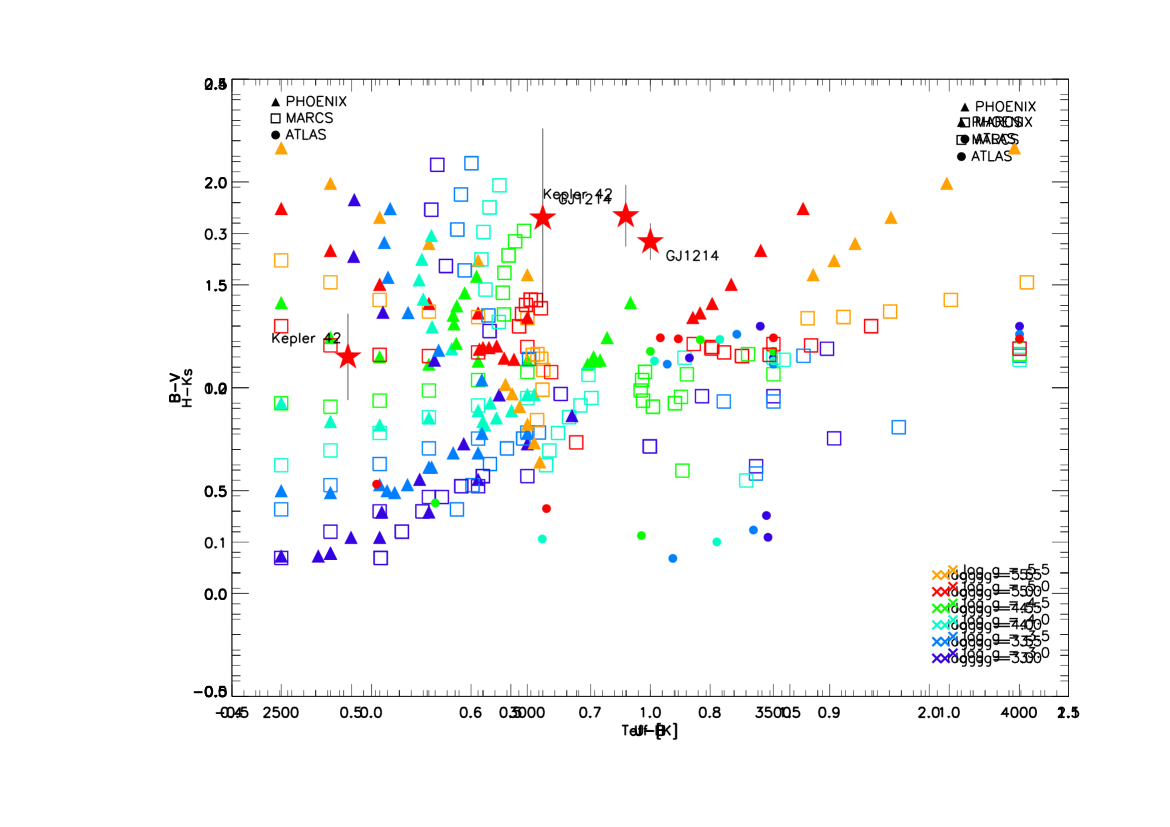
Finally we compile a list of the synthetic colour indices for each model, using the calculated visual magnitudes (Fig.1). The B-V magnitudes differ by up to half a magnitude between the Drift-Phoenix and MARCS models in the low temperature half of the plot and a trend is difficult to place on the data as the curves appear to be very different for these two models. The difference seems to diminish, however, when the models move to higher Teff as the MARCS and ATLAS models appear to diverge much less, especially at Teff=4000K. The two available data points from actual observations, Kepler 42 (Muirhead et al. 2012) and GJ1214 (Anglada-Escude et al. 2013) do not appear to lie on any of the theoretical curves we have compiled, which calls for an extension of the study presented here.
5 Conclusion
As the field of exoplanetary detection drifts towards Earth-sized planets, the observational community will benefit from targeting M-dwarfs as host stars. This study has compared the temperature-pressure and opacity structures of three model atmosphere families. The ATLAS and MARCS models have shown increasing discrepancies in both local temperature and opacity as one goes deeper into the stellar atmosphere. The MARCS and Drift-Phoenix models have shown better agreement with local temperature differences of no more than 300K. The MARCS models display considerable deviations from both ATLAS and Drift-Phoenix in the optical regime in terms of sythetic photometric fluxes, which is further confirmed in the B-V plots. Even so, there are big gaps in the availability of models, which need to be filled in order to present a more comprehensive study.
References
- Anglada-Escudé et al. (2013) Anglada-Escude G. et al. 2013, A&A, 551, A48
- Auvergne et al. (2009) Auvergne, M., et al. 2009, A&A 506: 411–424
- Baron et al. (2003) Baron, E., Hauschildt, P. H., Allard, F., et al. 2003, IAU Symp., 210, 19
- Batalha et al. (2013) Batalha N. et al. 2013, ApJ, 204, 24
- Bohlin & Gilliland (2004) Bohlin R., Gilliland R., 2004, ApJ, 127, 3508
- Castelli & Kurucz (2004) Castelli F., Kurucz R., IAU Symposium, 2004
- Charbonneau D. et al. (2000) Charbonneau D., Brown T., Latham D., Mayor M, 2000, ApJ, 529, L45
- Dehn (2007) Dehn, M. 2007, Ph.D. thesis, Universität Hamburg
- Grevesse et al. (2007) Grevesse, N., Asplund, M., Sauval, A. J. 2007, Space Sci. Rev., 130, 105
- Gustafsson et al. (2008) Gustafsson B. et al., 2008, A&A, 486, 951-970
- Hauschildt & Baron (1999) Hauschildt, P. H., & Baron, E. 1999, J. Comp. Appl. Math., 109, 41
- Helling et al. (2008a) Helling Ch. et al. 2008a, MNRAS, 391, Issue 4, 1854
- Helling et al. (2008b) Helling, C., Dehn, M., Woitke, P., & Hauschildt, P. H. 2008b, ApJ, 675, L105
- Kurucz (1970) Kurucz R, 1970, SAO Special report N 309
- Mayor & Queloz (1995) Mayor M., Queloz D., 1995, Nature, 378, 355
- Mayor et al. (2003) Mayor M. et al., 2003, ESO Messenger 114: 20
- Muirhead et al. (2012) Muirhead P. et al., 2012, ApJ, 747, Feb
- Witte et al. (2009) Witte S., Helling Ch., Hauschildt P. H., 2009, A&A 506, 1367
- Wolszczan & Frail (1992) Wolszczan A., Frail D. A., 1992, Nature, 355, 145