Evidences to the pulse like origin of double spicules based on Hinode/SOT observations
Abstract
We analyze the time series of H line obtained from Hinode/SOT on the solar limb. The wavelet analysis shows that there are nice correlations between dynamical properties of the two parts of a double spicule. The dominant periods for height variations are estimated and s. The length of two parts of the spicule oscillates with the period of around s. The mean distance between two parts of the spicule has a periodical treatment with the period of s. Our results show that the strong pulses may lead to the quasi periodic rising of chromospheric plasma into the lower corona in the form of spicules. The periodicity may result from the nonlinear wake behind the pulse in the stratified atmosphere.
e-mail: hosseinebadi@tabrizu.ac.ir
Keywords Sun: spicules spicule formation double spicules
1 Introduction
Spicules were discovered almost years ago but they still remain as one of Solar Physics mysteries (Secchi, 1977). They are observable in Hα, D3 and Ca ii H chromospheric lines. The general properties of them can be found in some reviews (Beckers, 1968; Sterling, 2000; Zaqarashvili & Erdélyi, 2009).
Spicule seismology, which means the determination of spicule properties from observed oscillations and was originally suggested by Zaqarashvili et al. (2007), has been significantly developed during last years (Verth et al., 2011; Ebadi et al., 2012).
Despite the large body of theoretical and observational works devoted to the spicules, their ejection mechanism is not clear yet. Spicule formation mechanisms can be formally divided into three different groups: pulses, Alfvén waves, and p-mode leakage.
The spicule formation idea by impulsively launched perturbations is as follows: The velocity or gas pressure pulses are launched initially below the transition region. The pulse quickly steepens to a shock as a result of rapid decrease in mass density with height and lifts up the transition region which may lead to spicule formation. Hollweg (1982) showed that the Alfvén waves may be nonlinearly coupled to fast magnetoacoustic shocks, which may lead to spicule formation. Cargill et al. (1997) performed the numerical simulations of the propagation of Alfvénic pulses in two dimensional magnetic field geometries. They concluded that for an Alfvénic pulse the time at which different parts of the pulse emerge into the corona depends on the plasma density and magnetic field properties. Moreover, they discussed that this mechanism can interpret spicule ejection forced through the transition region. Kudoh & Shibata (1999) used the random nonlinear Alfvénic pulses and concluded that the transition region lifted up to more than km (i.e. the spicule produced). Zaqarashvili & Skhirtladze (2008) concluded that photospheric granulation may excite transverse pulses in anchored vertical magnetic flux tubes. The pulses propagate upward along the tubes while oscillating wake is formed behind the wave front in a stratified atmosphere. Murawski & Zaqarashvili (2010); Murawski et al. (2011) studied the upward propagation of a velocity pulse launched initially below the transition region. Their numerical simulations show that the strong initial pulse may lead to the quasi periodic rising of chromosphere material into the lower corona in the form of spicules. The periodicity results from the nonlinear wake behind the pulse in the stratified atmosphere. The superposition of rising and falling off plasma portions resembles the time sequence of single and double (even sometimes triple) spicules. Recently, Ebadi & Hosseinpour (2013) studied transverse oscillations in solar spicules induced by propagating Alfvénic pulses. They showed that the period of transversal oscillations is in agreement with those observed in spicules. Moreover, it is found that the excited Alfvénic waves spread during propagation along the spicule length, and suffer efficient damping of the oscillations amplitude.
Most spicules show a double thread structure during their evolution. This double structure was reported for the first time by Tanaka (1974) and then by Dara et al. (1998). Recently, Suematsu (2008) based on Hinode observations confirmed that most spicules exhibit the double thread structures. They found that the separation of some of the double spicules vary in time, repeating a single-thread phase and the double thread-thread one. The width of each thread and a separation distance between them is a few tenths of arc sec on average.
In the present work, we report the observational evidences to the double spicules through the data obtained from Hinode. Our motivation to this work is the numerical simulations which have been made by Murawski & Zaqarashvili (2010).
2 Observations and image processing
We used a time series of H ( nm) line obtained on 8 November 2007 during 15:49 to 16:01 UT by the Solar Optical Telescope onboard Hinode (Tsuneta et al., 2008). The spatial resolution reaches arc sec ( km) and the pixel size is arc sec ( km) in the H line. The time series has a cadence of seconds with an exposure time of seconds. The position of -center and -center of slot are, respectively, arc sec and arc sec, while, -FOV and -FOV are arc sec and arc sec, respectively.
The “fgprep,” “fgrigidalign” and “madmax” algorithms (Koutchmy & Koutchmy, 1989) are used to reduce the images spikes and jitter effect and to align time series and enhance the finest structures, respectively.
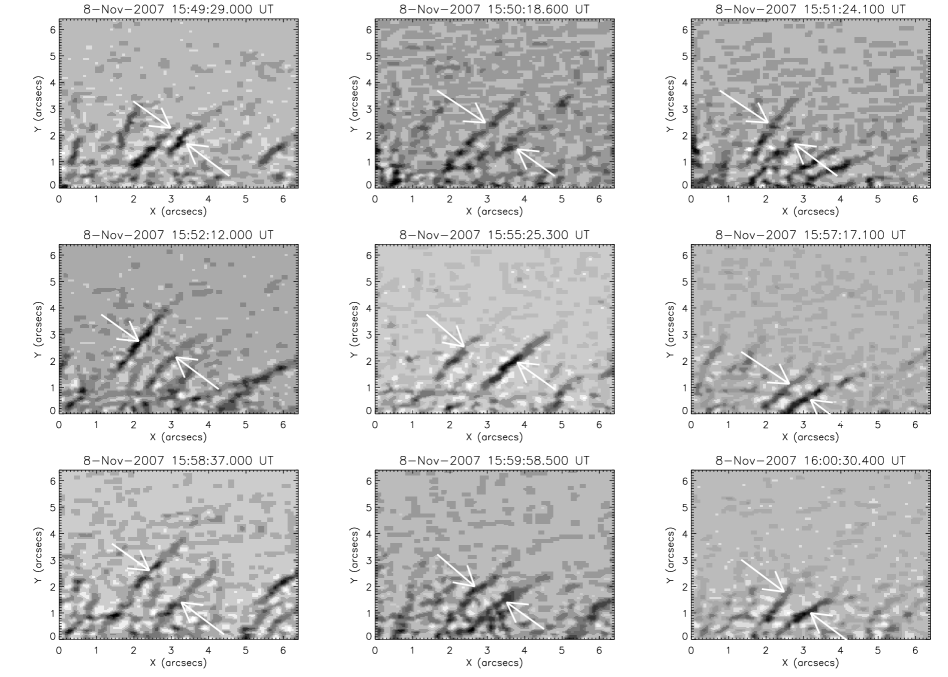
In Figure 1, images of time sequence in H line are presented. White arrows show the position of studied double spicule. It is clear that height, length, and mean distance between two parts of the spicule are changed with time. Moreover, it is obvious from Figures that the two components are related to a single spicule. To study this point more deeply, wavelet analysis is used to find correlation between dynamical properties of two components. The Morlet wavelet transform is used for analyzing the data.
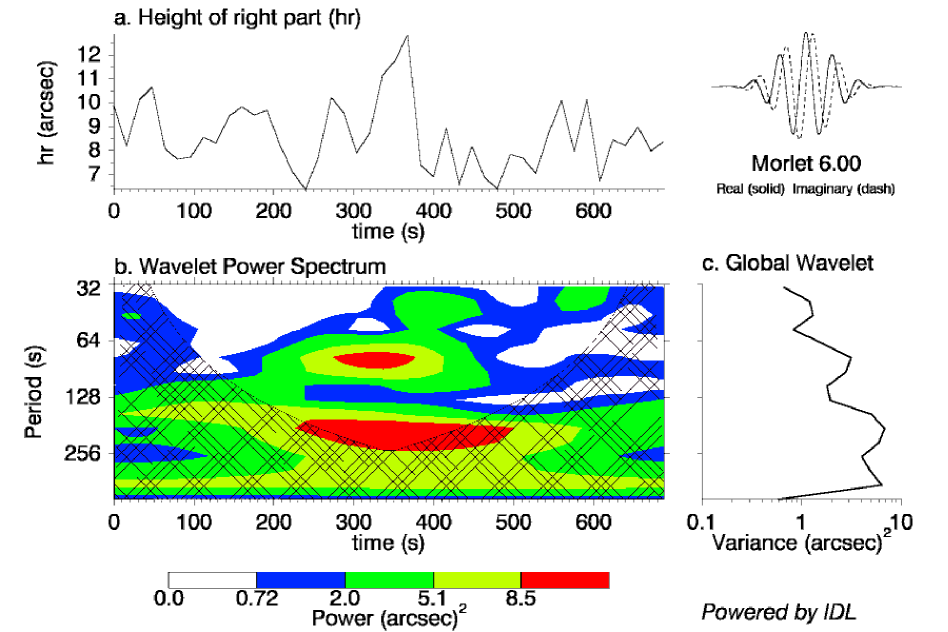
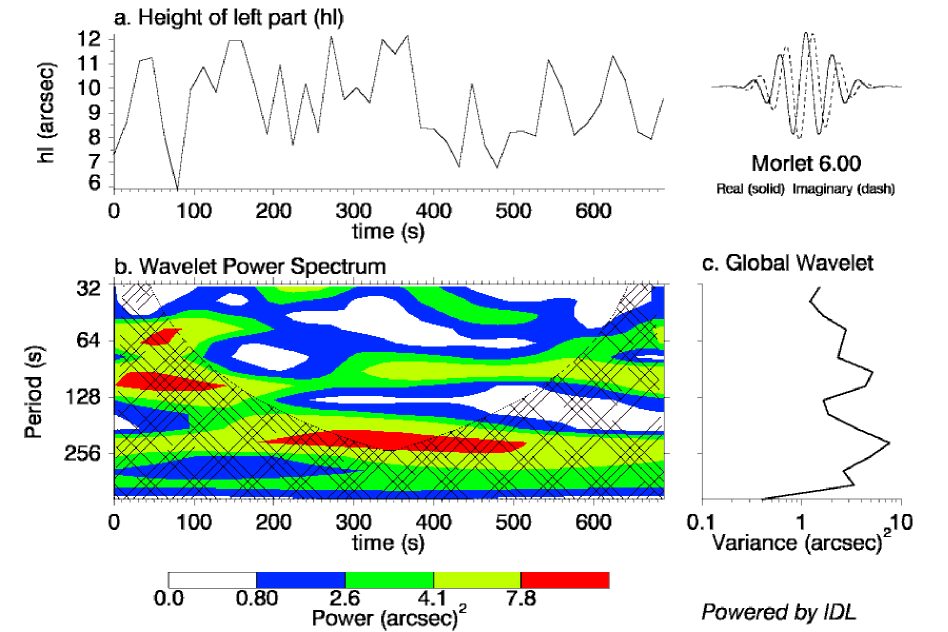
In Figures 2, and 3 height variations of right and left parts of the studied spicule are presented, respectively. The proper wavelet analysis results are also presented at each Figure (Torrence & Compo, 1998). The lower height is measured from the limb (photosphere) but the upper height is difficult to measure precisely because of its continuously fading away with height. Generally, the top of the spicule is defined as the height where the spicule becomes invisible. The proper wavelet analysis results are illustrated at the down panels of each Figure. The dominant periods for height variations are estimated as and s. It is interesting that these results are the same for two parts of the spicule. Furthermore, the height of spicule components begins from arc sec and goes up until arc sec.
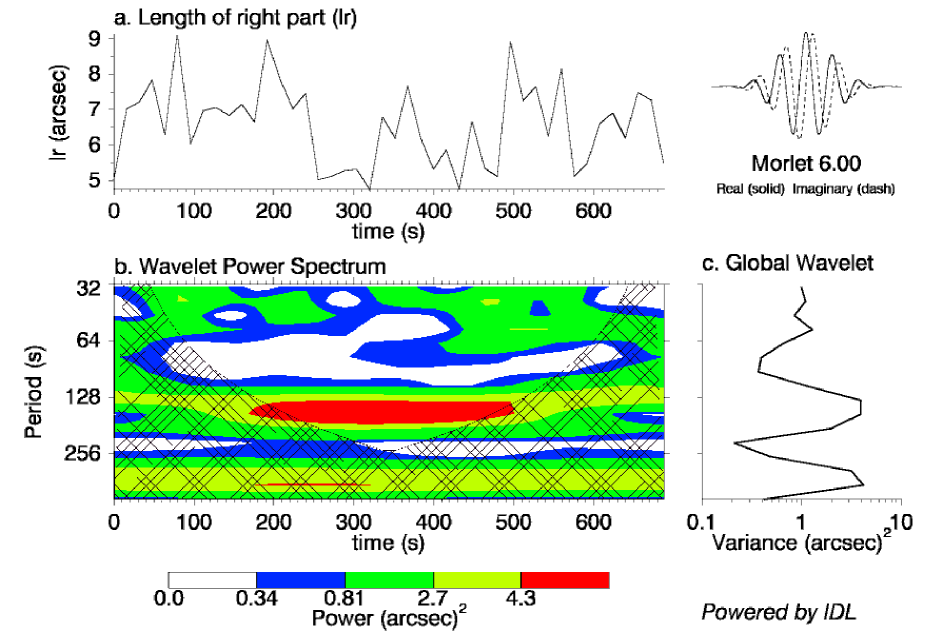
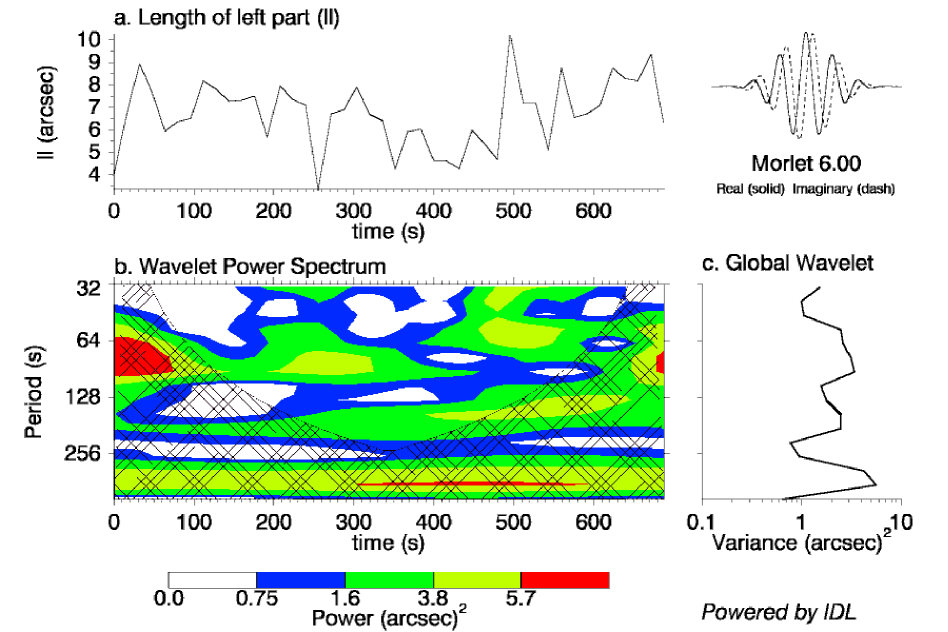
The length variations of right and left parts of the spicule are presented in Figures 4, and 5, respectively. The wavelet analysis results are also shown at the down panels. The length of two parts of the spicule oscillates with the period of around s. The length of the two parts of the spicule varies from – arc sec.
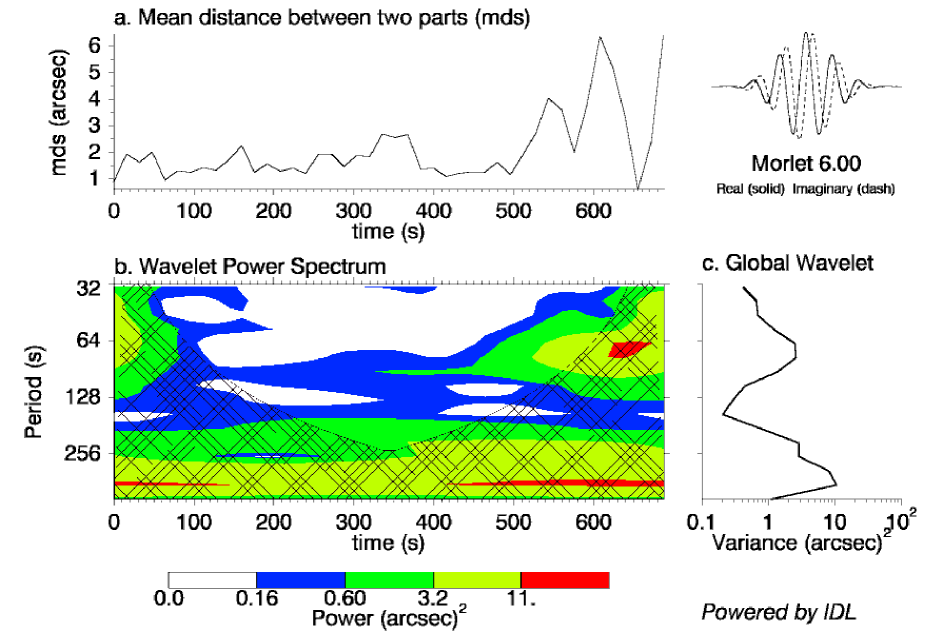
As it is clear from Figure 6, the mean distance between two parts of the spicule has a periodical treatment with the period of s. It may be interpreted as the period of transversal oscillations of the whole spicule axis (Kukhianidze et al., 2006; De Pontieu et al., 2007). It should be noted that the mean distance between two parts of the spicule is the average of the distance between the spicule centers and their boundaries. To measure it we determined the double spicule axis on each panel. Then we plotted three perpendicular lines from the center and the two boundaries. The average of these three distances can be estimated as the mean distance between two parts of the spicule.
3 Discussion and conclusion
We used high resolution images of spicules in H line obtained by the Solar Optical Telescope onboard Hinode. It is found that height, length, and mean distance between two parts of the spicule are changed oscillatory with time. The dominant periods for height variations are estimated as and s. The length of two parts of the spicule oscillates with the period of around s. Additionally, the mean distance between two parts of the spicule has a periodical treatment with the period of s. Correlations exist between height, length, and mean distance between two parts of the spicule treatments. Height and length variations period is the same in s. In addition, The height and mean distance between two parts of the spicule are common in s period. These results show that the two parts are related to a single spicule. Moreover, these results are in good agreement with the results of numerical simulations of Murawski & Zaqarashvili (2010). This may be interpreted that the strong pulses may lead to the quasi periodic rising of chromosphere plasma into the lower corona in the form of spicules. The superposition of rising and falling off plasma portions resembles the time sequence of double spicules.
It should be noted that we found evidences of the pulse like origin of double spicules at the present work. In fact, other mechanisms discussed in the literature confirmed by observations.
Acknowledgements The authors are grateful to the Hinode Team for providing the observational data. Hinode is a Japanese mission developed and lunched by ISAS/JAXA, with NAOJ as domestic partner and NASA and STFC(UK) as international partners. Image processing Mad-Max program was provided by Prof. O. Koutchmy.
References
- Beckers (1968) Beckers, J.M.: Sol. Phys. 3, 367 (1968)
- Cargill et al. (1997) Cargill, P. J., Spicer, D. S., Zalesak, S. T.: Astrophys. J. 488, 854 (1997)
- De Pontieu et al. (2007) De Pontieu, B., McIntosh, S.W., Carlsson, M., et al.: Science 318, 1574 (2007)
- Dara et al. (1998) Dara, H.C., Koutchmy, S., Suematsu, Y.: Solar Jets and Coronal Plumes, SP-421, ESA, 255 (1998)
- Ebadi & Hosseinpour (2013) Ebadi, H., Hosseinpor, M.: Astrophys. Space Sci. 343, 11 (2013)
- Ebadi et al. (2012) Ebadi, H., Zaqarashvili, T.V., Zhelyazkov, I.: Astrophys. Space Sci. 337, 33 (2012)
- He et al. (2009) He, J., Marcsh, E., Tu, G., Tian, H.: Astrophys. J. Lett. 705, L217 (2009)
- Hollweg (1982) Hollweg, J.V.: Astrophys. J. 257, 345 (1982)
- Koutchmy & Koutchmy (1989) Koutchmy, O., Koutchmy, S.: In: O. von der Lühe (ed.): High Spatial Resolution Solar Observations: Proceedings of the Tenth Sacramento Peak Summer Workshop (Sunspot, NM, August 22–26, 1988), p. 217, National Solar Observatory/Sacramento Peak, Sunspot, NM 88349 (1989)
- Kukhianidze et al. (2006) Kukhianidze, V., Zaqarashvili, T. V., Khutsishvili, E.: Astron. Astrophys. 449, 35 (2006)
- Kudoh & Shibata (1999) Kudoh, T., Shibata, K.: Astrophys. J. 514, 493 (1999)
- Murawski et al. (2011) Murawski, K., Srivastava, A. K., Zaqarashvili, T.V.: Astron. Astrophys. 535, 58 (2011)
- Murawski & Zaqarashvili (2010) Murawski, K., Zaqarashvili, T.V.: Astron. Astrophys. 519, A8 (2010)
- Secchi (1977) Secchi P. A.: Le Soleil, 2 (1977)
- Sterling (2000) Sterling, A.C. 2000, Sol. Phys. 196, 79 (2000)
- Suematsu (2008) Suematsu, Y., Ichimoto, K., Katsukava, X., et al.: ASP Conf. Ser., 397, 27 (2008)
- Tanaka (1974) Tanaka, K.: in choromospheric fine structure, ed. G. Athay, IAU symp., 56, 239 (1974)
- Torrence & Compo (1998) Torrence, C., Compo, G.P.: Bull. Amer. Meteor. Soc., 79, 61 (1998)
- Tsuneta et al. (2008) Tsuneta, S., Ichimoto, K., Katsukawa, Y., et al.: Sol. Phys. 249, 167 (2008)
- Verth et al. (2011) Verth, G., Goossens, M., He, J.-S.: Astrophys. J. Lett. 733, 15 (2011)
- Zaqarashvili & Erdélyi (2009) Zaqarashvili, T.V., Erdélyi, R.: Space Sci. Rev. 149, 335 (2009)
- Zaqarashvili & Skhirtladze (2008) Zaqarashvili, T.V., Skhirtladze, N.: Astrophys. J. 683, 91 (2008)
- Zaqarashvili et al. (2007) Zaqarashvili, T.V., Khutsishvili, E., Kukhianidze, V., Ramishvili, G.: Astron. Astrophys. 474, 627 (2007)