Finite-temperature properties of strongly correlated fermions in the honeycomb lattice
Abstract
We study finite-temperature properties of strongly interacting fermions in the honeycomb lattice using numerical linked-cluster expansions and determinantal quantum Monte Carlo simulations. We analyze a number of thermodynamic quantities, including the entropy, the specific heat, uniform and staggered spin susceptibilities, short-range spin correlations, and the double occupancy at and away from half filling. We examine the viability of adiabatic cooling by increasing the interaction strength for homogeneous as well as for trapped systems. For the homogeneous case, this process is found to be more efficient at finite doping than at half filling. That, in turn, leads to an efficient adiabatic cooling in the presence of a trap which, starting with even relatively high entropies, can drive the system to have a Mott insulating phase with substantial antiferromagnetic correlations.
pacs:
71.10.Fd, 75.40.Cx, 67.85.-d, 75.40.MgI INTRODUCTION
The Fermi-Hubbard model in the honeycomb lattice, especially its ground-state phase diagram, has attracted much interest in recent years. This is in part motivated by the advent of graphene,Castro Neto et al. (2009) whose semimetallic properties can be understood within the weakly interacting regime of this model. It is also motivated by results of large-scale quantum Monte Carlo (QMC) calculations by Meng et al.,Meng et al. (2010) which suggested that a spin liquid phase exists in that model at intermediate interaction strengths, despite the absence of frustration. Following those results, a considerable number of studies have been done on the Hubbard model as well as in closely related models in the honeycomb geometry.Wu et al. (2010); Liebsch (2011); Ebrahimkhas (2011); Ma et al. (2011); Wang et al. (2011); Sun and Kou (2011); Tang et al. (2012); He and Lu (2012); Chang and Scalettar (2012); Sorella et al. (2012); Wu et al. (2013); Hassan and Sénéchal (2013); Assaad and Herbut (unpublished) However, QMC simulations of very large systems,Sorella et al. (2012) and the use of accurate approaches to estimate the antiferromagnetic (AF) order parameter,Assaad and Herbut (unpublished) have indicated that the existence of a spin liquid in such a model is unlikely.
A remarkable property of the Fermi-Hubbard model in the honeycomb lattice at half filling is the existence of a quantum phase transition to a Mott insulator at a finite interaction strength. Insulating behavior in this case is accompanied by the emergence of long-range AF correlations at zero temperature, as unveiled in QMC simulations.Sorella and Tosatti (1992); Paiva et al. (2005); Sorella et al. (2012) This phase transition has also been examined by means of dynamical mean-field theory and its cluster extensions,Santoro et al. (1993); Jafari (2009); Wu et al. (2010); Liebsch (2011); Ebrahimkhas (2011); He and Lu (2012); Hassan and Sénéchal (2013) as well as within the coherent phase approximation.Le (2013) Other studies of this and closely related models have explored the existence of pairing and superconductivity away from half filling.Ma et al. (2011); Wu et al. (2013)
A new front for studying the properties of the Fermi-Hubbard model in the honeycomb lattice has been recently opened by the (almost ideal) experimental realization of this model by: (i) building artificial graphene and loading it with a two-dimensional electron gas,Singha et al. (2011) (ii) trapping ultracold atoms in highly tunable optical lattices with that geometry,Tarruell et al. (2012) and (iii) creating molecular graphene in a fully tunable condensed-matter set up.Gomes et al. (2012) These experiments follow extensive research on simulating the Hubbard model on cubic geometries using ultracold gases,Esslinger (2010) aimed at answering fundamental questions surrounding Hubbard models, such as whether they support superconductivity.
In a recent Letter,Tang et al. (2012) we utilized two state-of-the-art computational methods, a numerical linked-cluster expansion (NLCE) and determinantal quantum Monte Carlo (DQMC), to study thermodynamic properties and spin correlations of interacting fermions in the honeycomb lattice, as described by the Fermi-Hubbard model. Our emphasis was in the half-filled case for which we found that, in comparison to the square lattice, the honeycomb lattice exhibits a more significant region of anomalous rise in the double occupancy at low temperature, leading to a more efficient adiabatic cooling. We also showed that nearest-neighbor (NN) spin correlations are stronger in the honeycomb lattice than in the square lattice for a wide range of interaction strengths and for an extended region of experimentally relevant entropies. This was found to be true even in the weakly-interacting regime, where the former has a semimetallic ground state while the latter has an AF Mott insulating one.
In this work, we extend the analysis presented in Ref. Tang et al., 2012 by studying other quantities of much interest, such as the entropy, the specific heat, uniform and staggered spin susceptibilities, and the structure factor. We establish a connection between the temperature at which the nearest neighbor (NN) spin correlations change most rapidly and the onset of exponentially long AF correlations in the system. More importantly, we explore in detail the behavior of some of those quantities, and of quantities studied in Ref. Tang et al., 2012, away from half filling. In particular, we analyze how the double occupancy, which can be accurately measured in ultracold gases experiments,Jördens et al. (2008) evolves as a function of temperature at different densities. Isentropic curves for the temperature as a function of the interaction strength away from half filling are also presented. Finally, employing a local density approximation (LDA), we analyze the possibility of achieving adiabatic cooling by increasing the strength of the interaction between trapped fermions in optical lattice experiments. We show that in the presence of a harmonic trap, even starting with relatively high entropies, it is possible to create Mott insulating regions with exponentially long antiferromagnetic correlations by using this approach.
The exposition is organized as follows. In Sec. II, we introduce the Hubbard model and provide a brief explanation of the two numerical methods used in this study. In Sec. III, we report results for the thermodynamic properties of the homogeneous system in the honeycomb lattice and, in some cases, we compare those results with the ones obtained in the square lattice. Properties of systems confined by a harmonic potential, relevant to ultracold gases experiments, are presented in Sec. IV. A summary of our results is presented in Sec. V.
II MODEL AND COMPUTATIONAL METHODS
II.1 The Hamiltonian
The one-band Hubbard Hamiltonian describes electrons in a lattice, or two component fermions in an optical lattice, and can be written as
| (1) |
where () is a creation (annihilation) operator of a fermion with spin (or pseudo-spin) on lattice site , and is the site occupation operator. Here, denotes nearest-neighbor sites, is the nearest-neighbor hopping amplitude, and is the on-site repulsive interaction.
The most recent DQMC studies of the phase diagram of this model in the honeycomb geometry indicate that there are two ground-state phases, a semimetallic one at weak coupling and an AF Mott insulating one at strong coupling, with a continuous phase transition between them that occurs at .Sorella et al. (2012); Assaad and Herbut (unpublished)
II.2 Numerical approaches
In this work, we use two fundamentally different unbiased numerical methods, a NLCERigol et al. (2006, 2007a, 2007b) and DQMC,Scalapino and Sugar (1981) to study the thermodynamic properties of Hamiltonian (1) in the honeycomb lattice.
In NLCEs, any extensive property of a lattice model per site ( is the number of lattice sites), in the thermodynamic limit, can be expanded in terms of contributions from all clusters that can be embedded in the infinite lattice:
| (2) |
where is the lattice constant of , defined as the number of ways per site in which cluster can be embedded in the lattice, and is the weight of that cluster. can be computed recursively based on the inclusion-exclusion principle:
| (3) |
where is the property calculated for the finite cluster using full exact diagonalization.Rigol et al. (2006, 2007a, 2007b)
In this work, we use the site-based NLCE,Rigol et al. (2007a) i.e., contributions to the order of the expansion come solely from clusters with up to sites. The computational effort is reduced by identifying all clusters that have the same Hamiltonian (same topology), and diagonalizing only one of them.Rigol et al. (2007a); Tang et al. (2013) In Table I, we report the total number of topologically distinct clusters (second column) that are diagonalized in each order of the NLCE (first column). The number of topological clusters should be compared to the much larger number of added lattice constants at each order of the expansion (third column).
| No. of sites | No. of topological clusters | |
|---|---|---|
| 1 | 1 | 1 |
| 2 | 1 | 3/2 |
| 3 | 1 | 3 |
| 4 | 2 | 7 |
| 5 | 2 | 18 |
| 6 | 5 | 47 |
| 7 | 7 | 125 |
| 8 | 15 | 675/2 |
| 9 | 26 | 919 |
| 10 | 59 | 5 053/2 |
| 11 | 113 | 7 008 |
| 12 | 258 | 39 169/2 |
| 13 | 542 | 55 097 |
| 14 | 1 233 | 311 751/2 |
| 15 | 2 712 | 443 080 |
| 16 | 6 208 | 1 264 630 |
| 17 | 14 004 | 3 622 431 |
NLCEs converge at a given temperature whenever correlations in the system are of the order of or smaller than the largest cluster sizes considered in the expansion. However, even if the bare sums diverge, one can accelerate the convergence of NLCEs at lower temperatures by using resummation algorithms. Here, we carry out the calculations up to the ninth order in the site expansion and employ Wynn and Euler resummation techniquesRigol et al. (2007a); Tang et al. (2013) to improve the convergence at low temperatures. Our calculations are performed in the grand-canonical ensemble,Rigol et al. (2007b) and we compute all observables for a wide range (and dense grid) of chemical potentials, , and temperatures, . Note that we can make the grid for and arbitrarily fine without much computational overhead since, for a given , everything needed to compute the observables is generated in a single run of the exact diagonalization. This allows us to accurately compute the equation of state so that all quantities can also be studied at any desired constant density.
Within DQMC,Scalapino and Sugar (1981) the partition function is expressed as a path integral by using the Suzuki-Trotter decomposition of , where with the Boltzmann constant, after discretizing the imaginary time. This introduces an imaginary-time interval that we set to . The interaction term is decoupled through a discrete Hubbard-Stratonovich transformation,Hirsch (1983) which introduces an auxiliary Ising field. One can then integrate the fermionic degrees of freedom analytically, and the summation over the auxiliary field (which depends both on the site and the imaginary time) is carried out stochastically using a Monte Carlo algorithm. Most of our results are for 96 sites for the honeycomb lattice and 100 sites for the square lattice geometry, though in some cases, other system sizes (namely 24, 54, 150, and 216 sites) were studied for the honeycomb lattice to analyze finite-size effects. As it will become apparent in the following, from comparisons to the NLCE, the systematic errors in DQMC are mostly negligible for our parameters of interest.
As shown in previous studies,Khatami and Rigol (2011); Tang et al. (2012) the two approaches are complementary. For the half-filled system with weak interactions (in comparison to the bandwidth), DQMC can access lower temperatures than NLCE. This can be understood from the fact that the computational cost of the former method increases almost linearly with inverse temperature, whereas the exponential growth of correlations in the model by decreasing the temperature limits the region of convergence of NLCE. On the other hand, for strong interactions, while DQMC runs into statistical difficulties when sampling the auxiliary fields, the convergence of NLCE extends to lower temperatures. This is because in the strong-coupling regime of the half-filled system, the relevant energy scale at low temperatures is that of the spin degrees of freedom, namely, the exchange interaction , which sets the characteristic temperature for the onset of the exponential growth of AF correlations. This scale decreases as the interaction strength increases and NLCEs can follow it without running into computational difficulties.
Away from half filling, DQMC is limited to higher temperatures in comparison to half filling due to the so-called fermion ‘sign problem’. Loh et al. (1990); Batrouni and Scalettar (1990) We find that in NLCEs, despite the lack of sign problem, the lowest temperature at which the series converge for our observables of interest also generally increases as the system is doped away from half filling. This seems to be a consequence of the emergence of competing correlations at higher temperatures.
III RESULTS
III.1 Entropy
In the grand-canonical ensemble, the entropy (per site) can be written as
| (4) |
where is the operator for the total number of particles. Within NLCEs, all the extensive quantities in the right-hand side of Eq. (4) can be computed (per site) directly in the thermodynamic limit. This is not the case within DQMC. The calculation of the entropy in the latter approach, for finite clusters, is done by integrating the energyWerner et al. (2005)
| (5) |
where is the high-temperature limit of the entropy for a given density ; . Throughout the paper, the entropy is given in units of . Since we present results for two different lattice geometries, we have chosen the unit of energy to be the noninteracting bandwidth, , which is for the honeycomb lattice and for the square lattice.
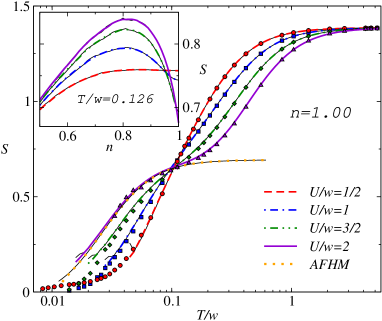
In the main panel in Fig. 1, we show the entropy of the honeycomb lattice as a function of temperature at half filling and for different values of from NLCE (lines) and DQMC (symbols). As anticipated, we find that NLCE results converge to lower temperature as increases. For the largest value of shown (), the convergence is extended to around . Figure 1 shows that, for the two smallest values of ( and 1), the results from the two methods agree very well down to the lowest convergence temperature in the NLCE. On the other hand, small deviations between the results from NLCE and DQMC become apparent for larger values of and low temperature, e.g., DQMC slightly underestimates the entropy for for .
As expected, and similarly to previous results for the square lattice,Khatami and Rigol (2011) the entropy shows different behavior in the weak- and strong-coupling regimes. While in the former it decreases steadily from to when lowering the temperature, in the latter, a plateau develops at intermediate temperatures (). The plateau becomes visible with increasing . This can be explained as follows: when (and consequently the cost of double occupancy) increases the charge degrees of freedom freeze out at increasingly high temperatures. Once they are frozen, the system at lower temperatures can be described by an effective Heisenberg model (with ), whose high-temperature entropy () agrees with the entropy at the plateau of the Hubbard model. As increases, decreases and the low temperature regime of the effective Heisenberg model moves to lower temperatures. This results in a larger plateau with increasing . To make those points apparent, in Fig. 1 we also show the entropy of the AF Heisenberg model in the honeycomb lattice with , which closely follows the results of the Hubbard model with at .
NLCE results for the entropy away from half filling are presented in the inset in Fig. 1. Those results were obtained for , the same four values of depicted in the main panel, and for a wide range of local fillings (). In the weakly-interacting regime (e.g., ), as the density increases, the entropy increases monotonically first and then saturates at a finite value when . This is because the system behaves similarly to a non-interacting system at this temperature: as , the number of microstates increases and therefore the entropy increases. However, as correlations become significant by increasing , the entropy decreases dramatically as the density approaches half filling due to the formation and ordering of local moments. This is accompanied by the appearance of a peak in the entropy at , which resembles the one appearing for the same model in the square lattice.Bonča and Prelovšek (2003); Mikelsons et al. (2009); Khatami and Rigol (2011) The high entropy around that filling at low temperature signals the presence of many low-energy competing states, which, upon further cooling, could result in the emergence of exotic phases such as superconductivity.
III.2 Specific Heat
The specific heat (per site) is defined as
| (6) | |||||
| (7) |
where the second expression is more amenable for evaluation in the grand-canonical ensemble. However, in order to avoid numerical derivatives and eliminate the systematic errors they introduce, we rewrite Eq. (7) using Maxwell equations asKhatami and Rigol (2012)
| (8) |
where and . All expectation values in Eq. (8) can be directly evaluated in NLCEs.
Within DQMC, obtaining from Eq. (8) requires the calculation of expectation values of products of up to eight fermion operators. While this is possible in principle, it would lead to large statistical fluctuations in the results, which are costly to reduce. Therefore, we resort to the numerical differentiation of high-quality data for as prescribed in Eq. (6).
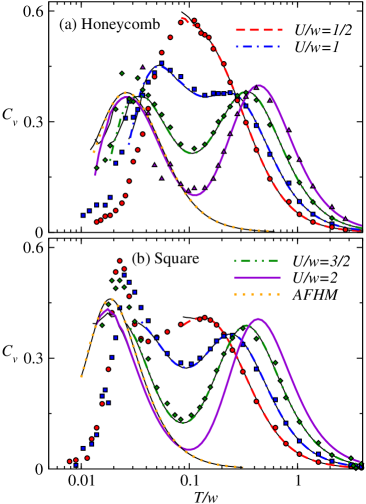
The specific heat of the Hubbard model in the honeycomb and square lattices are presented in Figs. 2(a) and 2(b), respectively, for different values of the coupling strength. The NLCE results in the square geometry were previously reported in Ref. Khatami and Rigol, 2012, while early DQMC results in the square and honeycomb geometries (admittedly less accurate than those reported here) can be found in Refs. Paiva et al., 2001 and Paiva et al., 2005, respectively. The complementarity of NLCE and DQMC is once again clear from these plots for both lattice geometries. For weak interactions (e.g., ), DQMC and NLCE results are in good agreement with each other down to the temperatures at which NLCE converges. However, DQMC can also access the very low-temperature regime that is not accessible to NLCE. Because of this, DQMC can resolve the double-peak structure that is present in the square lattice for , which is the result of the Mott insulating ground state with long-range AF order that occurs for any nonzero value of . Such a structure is absent in the honeycomb lattice in the weakly interacting regime, where the ground state of the system lacks long-range AF order.Paiva et al. (2005)
For values of the interaction strength of the order of the bandwidth, we do find small deviations between NLCE and DQMC results at intermediate to low temperatures ( for both geometries), as (mainly) systematic errors due to the discretization of imaginary time start to affect the DQMC results. Nevertheless, the relatively good agreement between the results from these two methods for , especially for the honeycomb geometry down to , indicates that systematic errors in DQMC are not playing an important role. For larger values of ( and 2 in Fig. 2), NLCE provides more accurate results down to lower temperatures. In particular, from the NLCE data it becomes apparent that the position of the low-temperature peak moves to lower temperature (proportional to ) as the interaction strength increases. This is expected once the charge degrees of freedom become irrelevant and the system falls in a regime that can be described by the Heisenberg model. The specific heat predicted by the corresponding spin model in the honeycomb and square lattices are also depicted in Fig. 2. They closely follow (but are not equal to) the results obtained within the Hubbard model for the largest value of shown in those figures ().
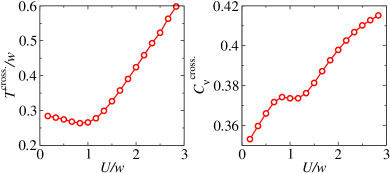
Similarly to what happens in the square lattice, in the weak-coupling regime in the honeycomb lattice the curves for specific heat vs temperature show what appears to be a unique crossing point at a high temperature for different interaction strengths.Paiva et al. (2005) This phenomenon has been extensively discussed for strongly-correlated models and materials.Vollhardt (1997) The high accuracy of the NLCE results at those temperatures allows us to make definite statements as to whether this is indeed a unique crossing point. In Fig. 3(a) and 3(b), we plot (as a function of ) the high- crossing temperature () and the value of at the crossing () between curves of for and . One can see that has a weak dependence on with a shallow minimum around before rising linearly with increasing the interaction at larger . is also dependent. These results are qualitatively similar to those obtained for the square lattice in Ref. Khatami and Rigol, 2012, so that the features seen in and appear to be related to the onset of strong correlations in the system.
III.3 Uniform Susceptibility and NN Spin Correlations
Another thermodynamic property of much experimental interest is the uniform susceptibility (per site)
| (9) |
where is the component of the spin operator. In solid state experiments, is usually measured using SQUID magnetometers.
Results for the uniform susceptibility in the honeycomb lattice are presented in Fig. 4(a) as a function of temperature for different interaction strengths. For , the DQMC results agree once again with those from NLCE down to the lowest convergence temperature in the NLCE. For , an accurate DQMC calculation of this quantity at low temperatures becomes costly and we only show results for , which exhibit large statistical errors at the lowest temperatures.
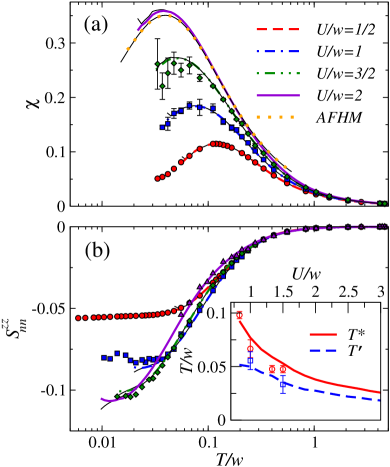
The plots for the uniform susceptibility in Fig. 4(a) make apparent that there exists a peak for all values of whose location moves to lower temperatures monotonically with increasing . This is unlike in the square lattice where such a peak first moves to higher temperatures with increasing (in the weakly interacting regime) before moving to lower temperatures for , following the AF characteristic temperature.Paiva et al. (2001, 2010); Khatami and Rigol (2011) Insight as to why the honeycomb lattice model behaves differently can be gained from the fact that its ground state is semimetallic in the weakly interacting regime with no long-range AF correlations. Therefore, the peak in the uniform susceptibility in that regime does not represent the onset of long-range AF correlations, which we know do not diverge in the ground state. In the strongly interacting regime, on the other hand, the peak temperature of (denoted by ) does characterize the onset of exponentially long AF correlations and decreases following the energy scale as increases. In the inset in Fig. 4(b), we plot as a function of .
If it would be possible to measure the uniform susceptibility in experiments with ultracold gases, its downturn as the temperature is decreased could be used to identify the onset of antiferromagnetism. Since this is still not possible in current experimental setups, measuring NN spin correlations () can be considered a first step for probing the emergence of AF order in strongly-correlated lattice models such as the Hubbard model. This step has already been taken in experiments in the square lattice geometry.Trotzky et al. (2010); Greif et al. (2011, 2013)
In our calculations, we define (per bond) as
| (10) |
where is the coordination number ( for the honeycomb lattice), means that we sum over all ’s that are nearest neighbors of , and then sum over all ’s. In previous studies, we used NLCEs and DQMC to explore NN spin correlations at various interaction strengths in the square and honeycomb lattice geometries.Khatami and Rigol (2011); Tang et al. (2012) (Note that there is a factor 4 difference between the definition of here and in those references.) Surprisingly, we found that for a wide range of temperatures (entropies), accessible to current optical lattice experiments, these correlations are greater in the honeycomb than in the square lattice. This occurs even in regimes where the former has a semimetallic ground state while the latter has an AF Mott insulating one.Tang et al. (2012)
Here, we are interested in identifying how to use those short range correlations to determine whether the system is in a regime with exponentially long AF correlations. In Fig. 4(b), we show , as a function of temperature in the honeycomb lattice and for different values of . They do not exhibit any sharp feature at . For , which is below the critical value for the formation of the Mott insulator in the ground state of the honeycomb lattice model, increases but eventually saturates as decreases. Note that the minus sign indicates opposite NN (pseudo-)spins. For , increases to values much larger than for with the region of fastest increase being pushed to lower temperatures as is increased. We have computed the derivative of with respect to temperature () and determined the temperature at which it is maximal. That temperature (denoted by ) is shown in the inset in Fig. 4(b). One can see there that is close to, but falls below, . This implies that if is determined from experimental measurements and is identified, then one will know (from the results here) that the system is in a regime with exponentially long AF correlations for .
III.4 Staggered susceptibility and structure factor
In Sec. III.3, we discussed two indirect measurements that help locating the onset of antiferromagnetism in the Hubbard model in the honeycomb lattice. Here we present results for two quantities that directly track the growth of such correlations, namely, the staggered susceptibility and the AF structure factor.
The staggered susceptibility (per site) is defined as the negative second derivative of the free energy (per site) with respect to a staggered field, , added to the Hamiltonian:
| (11) |
This derivative can be evaluated numerically within NLCE because one has full access to the partition function in the presence or absence of a staggered field. Using a Taylor expansion of , and considering that the magnetization at is zero, can be rewritten as
| (12) |
where is very small. In the NLCE calculations, we have tested several values of , which were orders of magnitude apart (), to ensure that the value of reported here is independent of the chosen.
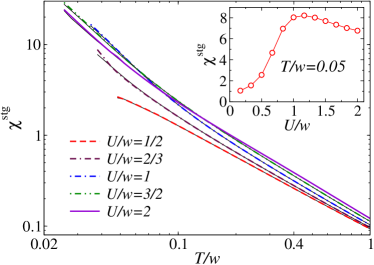
In Fig. 5, we show results for the staggered susceptibility as a function of temperature for various interaction strengths. In all cases, one can see a fast growth of this quantity when lowering the temperature starting from high temperatures (). However, when , the curves for depart from those for , as the curvature of changes sign by changing . In fact, for temperatures lower than for (see the inset in Fig. 4), appears to be growing exponentially.
As discussed before, in the effective Heisenberg model decreases as increases in the strongly interacting regime, which results in the onset of exponentially growing correlations to move to lower temperatures with increasing (for ). This has a visible effect on at the lowest temperatures we have access to. In Fig. 5, one can already see that after an initial increase for , decreases with increasing for . This is shown more clearly in the inset of Fig. 5, where we plot vs at . The maximal value of at that temperature occurs in the vicinity of .
The second quantity of interest is the AF structure factor, which is defined as
| (13) |
where if and belong to a different sublattice and if and belong to the same sublattice. Note that the lack of long range order at any finite temperature implies that is finite in the thermodynamic limit. This means that for the NLCE calculation an “additive” structure factor is computed in finite clusters as . This is done so that the intensive counterpart () can be evaluated within NLCE in the thermodynamic limit. can be measured in solid-state systems using neutron scattering, and, in ultracold atomic gases, it has been recently proposed that Bragg scattering can be used for that purpose.Corcovilos et al. (2010) It can also be calculated using DQMC.
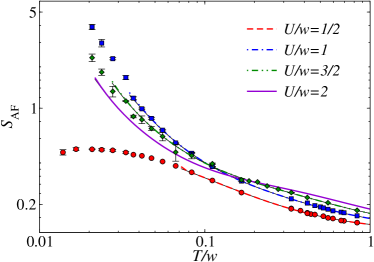
In Fig. 6, we plot as a function of for the honeycomb lattice at half filling for different values of . We should note that, in contrast to the quantities discussed in previous sections, exhibits strong finite-size effects in the DQMC simulations for the temperatures of interest here. Because of this, the DQMC results shown in Fig. 6 are the outcome of an extrapolation to the thermodynamic limit considering five different system sizes (24, 54, 96, 150, and 216 sites). Closely related to the strong finite-size effects seen in the DQMC calculations, we note that NLCE results for generally converge up to temperatures (for a given ) that are higher than those for the quantities discussed in previous sections.
It is apparent in Fig. 6 that the results for as a function of temperature and interaction strength correlate with those for in Fig. 5. For , we show DQMC results that extend to much lower temperatures than those at which NLCE converges in the weak-coupling regime. They make evident that, for ( in Fig. 6) where the ground state is a semimetal, the structure factor increases very slowly with decreasing temperature below before saturating and even decreasing at the lowest temperatures accessible to DQMC. For strong interactions, on the other hand, the growth below is exponential, which is consistent with the presence of an AF ground state.
III.5 Double occupancy
A quantity that draws great interest in experiments with ultracold gases in optical lattices is the double occupancy , which can be accurately measured and has been used to identify the presence of a Mott insulator.Jördens et al. (2008) In our recent Letter,Tang et al. (2012) we found that, in the half-filled Hubbard model on the honeycomb geometry, exhibits a more pronounced low-temperature rise with decreasing temperature than in the square lattice. This implies that, as discussed there and in what follows in Sec. III.6, adiabatic cooling is more efficient in the honeycomb lattice.
Here we show what happens away from half filling. Figure 7 depicts the normalized double occupancy, namely, divided by its uncorrelated high-temperature value of , for two different values of the interaction strength. In Fig. 7, one can see that the region in temperature with an anomalous exists not only at half filling but also away from it. The low- upturn away from half filling, which has also been observed for the square lattice geometry,Mikelsons et al. (2009); Khatami and Rigol (2011) can be attributed to delocalization effects due to Fermi liquid behavior, especially in the weak to intermediate coupling regimes. Consistently with that picture, the low- upturn starts at higher temperatures as decreases from 1, as shown in the inset in Fig. 7(a). This also explains the enhancement in the value of in the anomalous region as one dopes the system away from, but remains close to, half filling for . At half filling, this phenomenon, and the resulting Pomeranchuk cooling mechanism, has been studied using several techniques. Werner et al. (2005); Daré et al. (2007); De Leo et al. (2008)
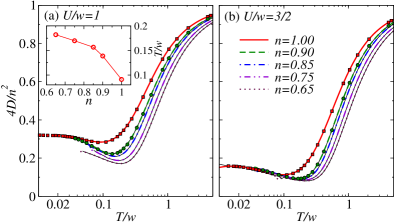
In the strong-coupling regime, the (less pronounced) upturn in at half filling is attributable to the increase in virtual hoppings to NN sites due to the enhancement of AF correlations. Gorelik et al. (2010) In that case, the similar upturn in away from half filling, and the agreement of the normalized double occupancies for a range of densities close to one at low temperatures [see Fig. 7(b)], can be explained by the fact that AF correlations and ordering of the moments likely remain significant, even at small dopings when the interaction strength is large. Khatami and Rigol (2011)
III.6 Adiabatic cooling away from half filling
As mentioned before, the existence of an anomalous region with is of much interest as it implies that the system can be cooled adiabatically by increasing the interaction strength. This follows from the relation ,Werner et al. (2005) which indicates that the entropy increases with increasing at constant , or decreases with increasing at constant . In Ref. Tang et al., 2012, we compared the constant-entropy curves in the - plane between the honeycomb and square lattice at half filling, and showed that the adiabatic cooling is more efficient in the former lattice geometry.
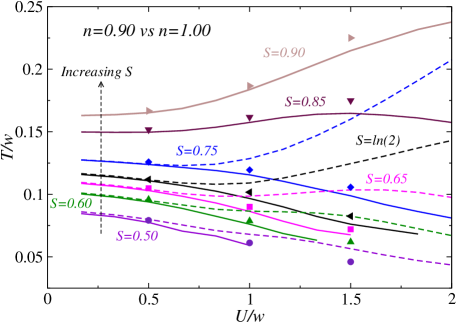
Here, we present results for , and explore how such a cooling mechanism changes away from half filling relative to the half-filled case. In Fig. 8, we show the isentropic curves in the - plane at (NLCE as thick solid lines and DQMC as symbols) and compare them with the ones at (NLCE as thin dashed lines). It is worth noting the good agreement between NLCE and DQMC results for , specially for . For the ranges of and temperatures presented here the “sign” problem in the QMC calculations was small at this filling.
Figure 8 makes apparent what one could have predicted from the results for the double occupancy in Fig. 7 (from the more pronounced rise in by lowering temperature when than when ), namely, that adiabatic cooling by increasing is generally stronger away, but close to, half filling. For high entropies, e.g., in Fig. 8, one can see that as increases in the strong-coupling regime the temperature for the system with decreases while it increases for the half-filled system. Similarly, at lower entropies, e.g., in Fig. 8, the system with can be cooled down to lower temperatures than with . As we show in the following section, these findings have important implications for adiabatically cooling of systems confined in harmonic potentials, as is the case for experiments with cold gases in optical lattices.
IV Trapped Systems
In order to emulate optical lattice experiments, we consider fermions trapped in a harmonic potential by adding a term to the Hamiltonian (1), where is the potential strength and is the distance of each site from the center of the trap. Since NLCE and DQMC results discussed in the previous sections are for homogeneous systems, we use the LDA to estimate thermodynamic properties of the confined system. For temperatures similar to those studied here, LDA was found to be a good approximation, at least for the square lattice geometry, in a DQMC study of the Hubbard model for harmonically trapped systems.Chiesa et al. (2011)
We are interested in understanding how adiabatic cooling changes in the presence of a confining potential. In those systems, the density changes from its maximal value in the center of the trap to zero. Given the results in Fig. 8, which show an important dependence of the isentropic curves on the density, one needs to consider a fully trapped system to determine how the contributions from low and high densities add up in a trap to result in cooling (or heating) as the interaction strength is increased. To provide general results, which apply to systems with potentially different strengths of the confining potential and/or number of particles, it is convenient to utilize the characteristic density ,Rigol et al. (2003); Rigol and Muramatsu (2004) where is the total number of particles in the trap and is the dimensionality.
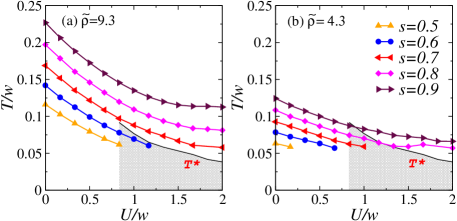
In Fig. 9, we show isentropic curves for vs in trapped systems with and . Note that here, gives the average entropy per particle in the trap, which is to be compared to the entropy per site () of the homogeneous system only at half filling. For , the region with in the latter system is depicted as a shaded area in Fig. 9. Figure 9 shows that even if is as large as , the temperature in the trapped system decreases steadily as increases. This is to be contrasted with the results in Fig. 8 where such a steady decrease of the temperature is not seen even if at is as low as 0.6. Furthermore, as shown in Fig. 9(b), one can adiabatically drive the trapped system into a regime with starting from entropies per particle that are higher than , required for the homogeneous case to achieve .Tang et al. (2012)
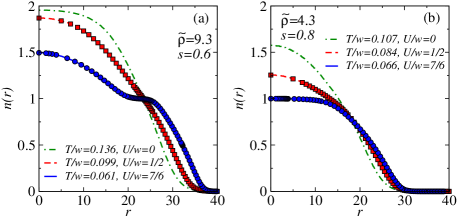
What remains to be checked is whether there is a Mott () region in the trapped system when . In Fig. 10, we show density profiles corresponding to the same characteristic densities depicted in Fig. 9, for selected values of the entropy per particle and . Figure 10(a) reports results for when . This average entropy leads to a temperature when , and we indeed find that a Mott shoulder develops in the system at the desired interaction strength (see the density profile for ).
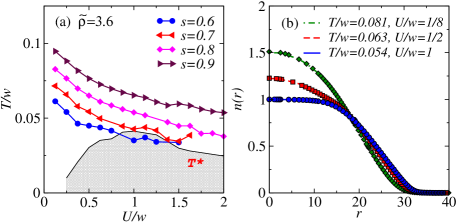
A preferable AF Mott plateau occupying the entire center of the trap may then be obtained by reducing the characteristic density. This can be seen in Fig. 9(b) for and , where the density profile at and exhibits an extended plateau with in the center of the system. Note that, for this characteristic density and entropy per particle, the isentropic curve for exhibits a region in for which is below [Fig. 9(b)]. For (not shown), we find that the density profiles for the highest values of whose temperature falls below have at . This means that the highest average entropy per particle that can support exponentially long AF correlations in a Mott plateau in the center of the trap is roughly , and this occurs for characteristic densities [corresponding to the results in Fig. 9(b)].
Finally, one may wonder how those results compare to what happens in the square lattice. In Fig. 11(a), we show isentropic curves for a harmonically trapped system in the square lattice with . This is about the lowest characteristic density that supports a Mott insulator with for . The density profiles corresponding to are presented in Fig. 11(b). (Those results are similar to the ones presented in Ref. Khatami and Rigol, 2011, but are extended to lower temperature using numerical resummations in the NLCE.) Figure 11(a) clearly shows that are required to achieve temperatures below in this case, so that the Mott plateau seen in Fig. 11(b) for does not exhibit exponentially long correlations. This indicates that long-range AF correlations should be easier to observe in the honeycomb geometry than in the square one.
V summary
In summary, we have utilized two complementary and unbiased computational techniques, NLCE and DQMC, to study finite-temperature thermodynamic properties of the Hubbard model in the honeycomb lattice. We have calculated experimentally relevant quantities, including the entropy, specific heat, uniform and staggered spin susceptibilities, NN spin correlations, and the double occupancy at and away from half filling.
Among other things, we correlated the maximum in with the temperature at which exponentially long correlations set in the system, so that NN spin correlations could be used in experiments to (indirectly) probe antiferromagnetism. We have also shown that a low-temperature upturn in the double occupancy also occurs away from half filling, and that it is actually more prominent than the one at half filling. By comparing the isentropic curves for as a function of away from (but close to) half filling and those at half filling, we have shown that adiabatic cooling is more efficient in the former. We then have used the local density approximation to study adiabatic cooling in the presence of a confining harmonic potential, finding that in the trapped system such a process is indeed more efficient than in the homogeneous one. This means that, in the presence of a harmonic trap, one can create Mott insulating domains with exponentially long AF correlations at average entropies per particle of , while in the homogeneous system one needs to fall in such a regime.Tang et al. (2012) These upper limits for the values of entropy are even higher than those predicted for the square lattice geometry.
Acknowledgements.
This work was supported by NSF Grant No. OCI-0904597 (B.T., E.K., and M.R.), and by CNPq, FAPERJ and INCT on Quantum Information (T.P.).References
- Castro Neto et al. (2009) A. H. Castro Neto, F. Guinea, N. M. R. Peres, K. S. Novoselov, and A. K. Geim, Rev. Mod. Phys. 81, 109 (2009).
- Meng et al. (2010) Z. Meng, T. Lang, S. Wessel, F. Assaad, and A. Muramatsu, Nature (London) 464, 847 (2010).
- Wu et al. (2010) W. Wu, Y.-H. Chen, H.-S. Tao, N.-H. Tong, and W.-M. Liu, Phys. Rev. B 82, 245102 (2010).
- Liebsch (2011) A. Liebsch, Phys. Rev. B 83, 035113 (2011).
- Ebrahimkhas (2011) M. Ebrahimkhas, Phys. Lett. A 375, 3223 (2011).
- Ma et al. (2011) T. Ma, Z. Huang, F. Hu, and H.-Q. Lin, Phys. Rev. B 84, 121410 (2011).
- Wang et al. (2011) G. Wang, M. O. Goerbig, C. Miniatura, and B. Grémaud, Europh. Lett.) 95, 47013 (2011).
- Sun and Kou (2011) G.-Y. Sun and S.-P. Kou, J. Phys.: Condens. Matter 23, 045603 (2011).
- Tang et al. (2012) B. Tang, T. Paiva, E. Khatami, and M. Rigol, Phys. Rev. Lett. 109, 205301 (2012).
- He and Lu (2012) R.-Q. He and Z.-Y. Lu, Phys. Rev. B 86, 045105 (2012).
- Chang and Scalettar (2012) C.-C. Chang and R. T. Scalettar, Phys. Rev. Lett. 109, 026404 (2012).
- Sorella et al. (2012) S. Sorella, Y. Otsuka, and S. Yunoki, Sci. Rep. 2, 992 (2012).
- Wu et al. (2013) W. Wu, M. M. Scherer, C. Honerkamp, and K. Le Hur, Phys. Rev. B 87, 094521 (2013).
- Hassan and Sénéchal (2013) S. R. Hassan and D. Sénéchal, Phys. Rev. Lett. 110, 096402 (2013).
- Assaad and Herbut (unpublished) F. F. Assaad and I. F. Herbut, Phys. Rev. X 3, 031010 (2013).
- Sorella and Tosatti (1992) S. Sorella and E. Tosatti, EPL (Europhysics Letters) 19, 699 (1992).
- Paiva et al. (2005) T. Paiva, R. T. Scalettar, W. Zheng, R. R. P. Singh, and J. Oitmaa, Phys. Rev. B 72, 085123 (2005).
- Santoro et al. (1993) G. Santoro, M. Airoldi, S. Sorella, and E. Tosatti, Phys. Rev. B 47, 16216 (1993).
- Jafari (2009) S. A. Jafari, Eur. Phys. J. B 68, 537 (2009).
- Le (2013) D. A. Le, Mod. Phys. Lett. B 27, 1350046 (2013).
- Singha et al. (2011) A. Singha, M. Gibertini, B. Karmakar, S. Yuan, M. Polini, G. Vignale, M. I. Katsnelson, A. Pinczuk, L. N. Pfeiffer, K. W. West, et al., Science 332, 1176 (2011).
- Tarruell et al. (2012) L. Tarruell, D. Greif, T. Uehlinger, G. Jotzu, and T. Esslinger, Nature (London) 483, 302 (2012).
- Gomes et al. (2012) K. K. Gomes, W. Mar, W. Ko, F. Guinea, and H. C. Manoharan, Nature (London) 483, 306 (2012).
- Esslinger (2010) T. Esslinger, Annu. Rev. Condens. Matter Phys. 1, 129 (2010).
- Jördens et al. (2008) R. Jördens, N. Strohmaier, K. Günter, H. Moritz, and T. Esslinger, Nature (London) 455, 204 (2008).
- Rigol et al. (2006) M. Rigol, T. Bryant, and R. R. P. Singh, Phys. Rev. Lett. 97, 187202 (2006).
- Rigol et al. (2007a) M. Rigol, T. Bryant, and R. R. P. Singh, Phys. Rev. E 75, 061118 (2007a).
- Rigol et al. (2007b) M. Rigol, T. Bryant, and R. R. P. Singh, Phys. Rev. E 75, 061119 (2007b).
- Scalapino and Sugar (1981) D. J. Scalapino and R. L. Sugar, Phys. Rev. Lett. 46, 519 (1981).
- Tang et al. (2013) B. Tang, E. Khatami, and M. Rigol, Comput. Phys. Commun. 184, 557 (2013).
- Hirsch (1983) J. E. Hirsch, Phys. Rev. B 28, 4059 (1983).
- Khatami and Rigol (2011) E. Khatami and M. Rigol, Phys. Rev. A 84, 053611 (2011).
- Loh et al. (1990) E. Y. Loh, J. E. Gubernatis, R. T. Scalettar, S. R. White, D. J. Scalapino, and R. L. Sugar, Phys. Rev. B 41, 9301 (1990).
- Batrouni and Scalettar (1990) G. G. Batrouni and R. T. Scalettar, Phys. Rev. B 42, 2282 (1990).
- Werner et al. (2005) F. Werner, O. Parcollet, A. Georges, and S. R. Hassan, Phys. Rev. Lett. 95, 056401 (2005).
- Bonča and Prelovšek (2003) J. Bonča and P. Prelovšek, Phys. Rev. B 67, 085103 (2003).
- Mikelsons et al. (2009) K. Mikelsons, E. Khatami, D. Galanakis, A. Macridin, J. Moreno, and M. Jarrell, Phys. Rev. B 80, 140505 (2009).
- Khatami and Rigol (2012) E. Khatami and M. Rigol, Phys. Rev. A 86, 023633 (2012).
- Paiva et al. (2001) T. Paiva, R. T. Scalettar, C. Huscroft, and A. K. McMahan, Phys. Rev. B 63, 125116 (2001).
- Vollhardt (1997) D. Vollhardt, Phys. Rev. Lett. 78, 1307 (1997).
- Paiva et al. (2010) T. Paiva, R. Scalettar, M. Randeria, and N. Trivedi, Phys. Rev. Lett. 104, 066406 (2010).
- Trotzky et al. (2010) S. Trotzky, Y.-A. Chen, U. Schnorrberger, P. Cheinet, and I. Bloch, Phys. Rev. Lett. 105, 265303 (2010).
- Greif et al. (2011) D. Greif, L. Tarruell, T. Uehlinger, R. Jördens, and T. Esslinger, Phys. Rev. Lett. 106, 145302 (2011).
- Greif et al. (2013) D. Greif, T. Uehinger, G. Jotzu, L. Tarruell, and T. Esslinger, Science 340, 1307 (2013).
- Corcovilos et al. (2010) T. A. Corcovilos, S. K. Baur, J. M. Hitchcock, E. J. Mueller, and R. G. Hulet, Phys. Rev. A 81, 013415 (2010).
- Daré et al. (2007) A.-M. Daré, L. Raymond, G. Albinet, and A.-M. S. Tremblay, Phys. Rev. B 76, 064402 (2007).
- De Leo et al. (2008) L. De Leo, C. Kollath, A. Georges, M. Ferrero, and O. Parcollet, Phys. Rev. Lett. 101, 210403 (2008).
- Gorelik et al. (2010) E. V. Gorelik, I. Titvinidze, W. Hofstetter, M. Snoek, and N. Blümer, Phys. Rev. Lett. 105, 065301 (2010).
- Chiesa et al. (2011) S. Chiesa, C. N. Varney, M. Rigol, and R. T. Scalettar, Phys. Rev. Lett. 106, 035301 (2011).
- Rigol et al. (2003) M. Rigol, A. Muramatsu, G. G. Batrouni, and R. T. Scalettar, Phys. Rev. Lett. 91, 130403 (2003).
- Rigol and Muramatsu (2004) M. Rigol and A. Muramatsu, Opt. Commun. 243, 33 (2004).