The [O III] Nebula of the Merger Remnant NGC 7252: A Likely
Faint Ionization Echo11affiliation: Based in part on data gathered with the 6.5 m Magellan
Telescopes located at Las Campanas Observatory, Chile.
Abstract
We present images and spectra of a 10 kpc-sized emission-line nebulosity discovered in the prototypical merger remnant NGC 7252 and dubbed the ‘[O III] nebula’ because of its dominant [O III] 5007 line. This nebula seems to yield the first sign of episodic AGN activity still occurring in the remnant, 220 Myr after the coalescence of two gas-rich galaxies. Its location and kinematics suggest it belongs to a stream of tidal-tail gas falling back into the remnant. Its integrated [O III] 5007 luminosity is erg s-1, and its spectrum features some high-excitation lines, including He II 4686. In diagnostic line-ratio diagrams, the nebula lies in the domain of Seyfert galaxies, suggesting that it is photoionized by a source with a power-law spectrum. Yet, a search for AGN activity in NGC 7252 from X-rays to radio wavelengths yields no detection, with the most stringent upper limit set by X-ray observations. The upper luminosity limit of erg s-1 estimated for the nucleus is 103 times lower than the minimum ionizing luminosity of erg s-1 necessary to excite the nebula. This large discrepancy suggests that the nebula is a faint ionization echo excited by a mildly active nucleus that has declined by 3 orders of magnitude over the past 20,000 – 200,000 years. In many ways this nebula resembles the prototypical ‘Hanny’s Voorwerp’ near IC 2497, but its size is 3 smaller and its [O III] luminosity 100 lower. We propose that it be classified as an extended emission-line region (EELR). The [O III] nebula is then the lowest-luminosity ionization echo and EELR discovered so far, indicative of recent, probably sputtering AGN activity of Seyfert-like intensity in NGC 7252.
Subject headings:
galaxies: active — galaxies: evolution — galaxies: formation — galaxies: individual (NGC 7252) — galaxies: interactions — galaxies: ISM1. INTRODUCTION
Over recent decades the hierarchical assembly of galaxies (White & Rees, 1978) has become a paradigm of modern cold dark matter cosmology. Whereas the assembly of dark-matter halos is now reasonably well modeled and understood (e.g., Frenk & White, 2012), the baryonic growth of galaxies through gas accretion (Rees & Ostriker, 1977; Katz & Gunn, 1991; Keres et al., 2005; Dekel & Birnboim, 2006) and mergers (Toomre & Toomre, 1972; Barnes & Hernquist, 1992, 1996; Mihos & Hernquist, 1996; Hopkins et al., 2006) has turned out to be much more challenging to simulate. Some key issues of current theoretical and observational interest are the relative contributions of gas accretion and mergers to galaxy assembly, the apparent coevolution of supermassive black holes and spheroids (Magorrian et al., 1998; Gebhardt et al., 2000; Ferrarese & Merritt, 2000), and the effects of gaseous outflows in slowing—or possibly even quenching—the galactic growth process (e.g., Hopkins et al., 2006, 2013).
Mergers of gas-rich galaxies can offer insights on at least two of these issues. Especially major mergers (i.e., those with mass ratios ) often lead to intense starbursts and even some AGN activity, each of which can drive strong gaseous outflows (e.g., Heckman et al., 1990; Veilleux et al., 2005; Sturm et al., 2011). In trying to assess the relative influence of starbursts and AGN activity on the subsequent evolution of merger remnants, their individual durations and relative intensities matter, as does the detailed sequence of their occurrence. Whereas starbursts tend to peak close to the time of coalescence of the nuclei (e.g., Sanders & Mirabel, 1996), AGN activity may last longer and be more sporadic. Observational studies of gas-rich mergers and their remnants have found peak AGN activity delayed by typically 108–109 yr relative to the peaking of starbursts (Canalizo & Stockton, 2001; Kauffmann et al., 2003; Schawinski et al., 2007; Wild et al., 2010), in rough agreement with theoretical estimates based on -body plus hydrodynamical simulations suggesting AGN delays of 107 yr to a few 108 yr, with a wide scatter (Hopkins, 2012).
A problem for all studies involving not only ongoing mergers, but also merger remnants is the uncertainty about the remnants’ past merger history: What kinds of galaxies merged, and what were their gas contents and mass ratios? Our ignorance of such important details in well-known active merger remnants as, e.g., NGC 5128 and NGC 1316 is both surprising and embarrassing. Clearly, a few cases of well-studied merger remnants with known merger history could provide welcome checks on observational claims based on larger, statistical studies.
In this regard, the prototypical merger remnant NGC 7252 would seem to hold great promise. It is the only remnant whose past merger history has been simulated in some detail (Borne & Richstone, 1991; Mihos et al., 1993; Hibbard & Mihos, 1995; Mihos et al., 1998; Chien & Barnes, 2010). There is little doubt that two gas-rich spirals began merging less than 1 Gyr ago, coalesced about 220 Myr ago, and have transformed themselves into some sort of modern-day protoelliptical (Toomre, 1977; Schweizer, 1982, 1998). Much is known about its gas contents and kinematics (Wang et al., 1992; Hibbard et al., 1994), post-starburst stellar populations (Schweizer, 1982, 1990; Liu & Kennicutt, 1995), and system of massive young star clusters formed during the merger (Whitmore et al., 1993; Miller et al., 1997; Schweizer & Seitzer, 1998; Bruzual & Charlot, 2003; Bastian et al., 2013).
Yet, until the present study no sign of AGN activity in NGC 7252 was found, leaving us in the dark concerning the possible presence of any supermassive black hole (SMBH), its mass, activity, and recent growth history. Admittedly, one could construe the presence of considerable amounts of molecular gas in the small central disk ( : Dupraz et al., 1990; Wang et al., 1992) and of neutral hydrogen in the tidal tails (: Hibbard et al., 1994) as evidence that NGC 7252 experienced no quasar phase in its recent history. Yet, gas from the tidal tails keeps falling back into the remnant (Hibbard et al., 1994; Hibbard & Mihos, 1995; Chien & Barnes, 2010) and replenishing the central gas disk. Hence, it may be obliterating earlier evidence—if it existed—that strong AGN activity expelled most or all of the central gas.
Our serendipitous discovery of an extended emission-line nebulosity in NGC 7252 promises to shed new light on the question of the presence of a central SMBH and its past and present activity. We discovered the existence of this faint nebulosity in 1991 August during a cloudy observing run with the Modular Spectrograph at the du Pont 2.5 m telescope on Las Campanas. Hoping to exploit occasional gaps in the drifting cirrus, we took several hour-long exposures with the spectrograph slit placed across the nucleus of NGC 7252 at position angles corresponding to the major and minor axes of the central ionized-gas disk (Schweizer, 1982). A lone, faint and extended emission line struck us as the only spectral feature visible beyond this central gas disk; it appeared about 10″– 20″ SSW of the nucleus along the projected rotation axis of the disk and was quickly identified as [O III] 5007 emission at the redshift of the galaxy. Hoping to perhaps find some high-excitation outflow or major shock front, we followed up in 2000 September by imaging NGC 7252 through narrow-band [O III] 5007 and filters, also with the du Pont telescope. The resulting images, presented in § 2.1 below, revealed the presence of a 10 kpc large nebulosity significantly brighter in [O III] 5007 than in , whence we dubbed it the ‘[O III] nebula.’ It is this nebula that is the central subject of the present paper.
In the following, Section 2 describes our observations and reductions, including broad- and narrow-band imaging and long-slit spectroscopy of the nebula. Section 3 presents results concerning the general morphology of the ionized gas in NGC 7252 and the properties of the [O III] nebula, including its structure, metallicity, spectrum, excitation, and kinematics. Section 4 then discusses excitation mechanisms for the nebula, some properties of the nucleus of the galaxy, the hypothesis that the nebula is an ionization echo, its properties compared to those of other known such echos, and some implications for the evolutionary history of NGC 7252. Finally, Section 5 summarizes our main results and conclusions.
2. OBSERVATIONS AND REDUCTIONS
For general reference, the merger remnant NGC 7252 is also known as Arp 226 and the “Atoms for Peace” galaxy. It is located at , (Miller et al., 1997) and has a recession velocity relative to the Local Group of km s-1 (Schweizer, 1982, value revised by 3 km s-1), which places it at a distance of 66.2 Mpc for km s-1 Mpc-1 (Freedman & Madore, 2010). At that distance, adopted throughout the present paper, pc. The corresponding true distance modulus is . The Milky Way foreground extinction is small, with values in the literature ranging between (de Vaucouleurs et al. 1991) and 0.100 (Schlegel et al., 1998). We adopt the latter value, with which the absolute visual magnitude of NGC 7252 becomes .
Our observations of NGC 7252 described below include a series of direct images obtained with the Irénée du Pont 2.5-m telescope at Las Campanas Observatory and spectra taken with two spectrographs on the Clay 6.5-m telescope there. Table 1 presents a log of these observations.
2.1. Imaging
Direct broad- and narrow-band images of NGC 7252 were obtained with the CCD camera of the du Pont telescope during the four nights of 2000 September 27–30 (Table 1). Conditions were photometric, and the seeing was in the range – (FWHM).
The two broad-band images were taken through standard filters. The camera was equipped with the chip Tek 5 (format 20482048), which yielded a scale of pixel-1 in and a field of view of in and .
The narrow-band images were taken through three interference filters centered on the emission lines [O III] 5007, , and [S II] 6716, 6731 at the systemic redshift of NGC 7252. To permit subtraction of the stellar continuum from the galaxy, we also obtained exposures through two intermediate-band filters named ”BluCont” and ”RedCont,” as detailed in Table 1. The filter pairs ([O III], BluCont) and (, RedCont) were specially designed for this study, and the filters were fabricated in -inch size by Barr Associates, Inc. The unvignetted field of view through these four filters was approximately . The [S II] filter was borrowed from a filter set belonging to Cerro Tololo Inter-American Observatory and was used in combination with our RedCont filter.
The various direct CCD frames were flatfielded, coadded, and reduced in standard manner with IRAF.111 The Image Reduction and Analysis Facility (IRAF) is distributed by the National Optical Astronomy Observatories (NOAO), which are operated by the Association of Universities for Research in Astronomy (AURA), Inc., under a cooperative agreement with the National Science Foundation. The images were calibrated through observations of standard stars in the fields L98 and L110 (Landolt, 1973, 1992) observed during the same nights, while no special calibration frames were taken for the narrow-band images. To isolate the emission-line fluxes in the three narrow-band images from the galaxy continuum, scaled versions of the BluCont and RedCont images were subtracted, with the scale factors determined by trial and error to minimize the galaxy background contribution. The resulting deep [O III] 5007 and emission-line images are shown and discussed below, while the less deep [S II] emission-line image featured little measurable flux and is not further discussed here.
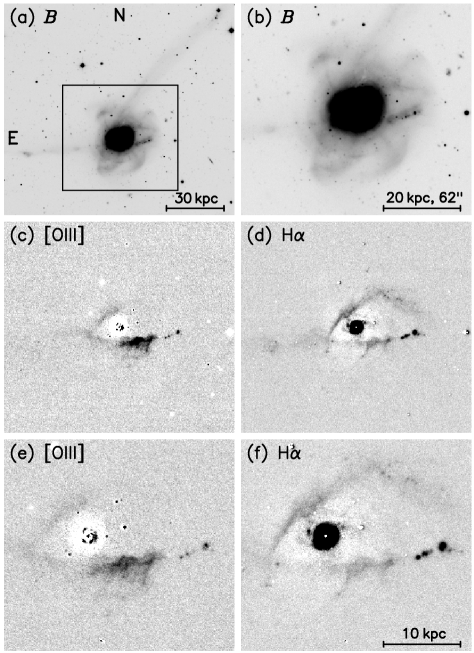
Figure 1 shows portions of the image (panels a, b), [O III] 5007 image (panels c, e), and image (panels d, f) at various contrasts, with scale bars indicating the angular and projected linear scales. The box in Figure 1a identifies the area shown 2 enlarged in Figures 1b–1d. The bottom two panels are enlarged 2 more, showing a region half the size (and one quarter the area) of the box drawn in Figure 1a. Both the [O III] 5007 and the images had the galaxy continuum subtracted as described above. They are displayed at relatively high contrast in the middle two panels, and at lower contrast in the bottom two panels to show more details. Notice the striking [O III] emission nebulosity slightly below the centers of panels (c) and (e), the bright central disk of emission surrounding the nucleus of the galaxy (circular black areas in panels d and f), and the string of five H II regions 14 kpc west of the nucleus, best visible in the same two panels.
The [O III] nebulosity (hereafter ‘[O III] nebula’) covers a projected area of about kpc2 () in the east–west and north–south directions, respectively, and appears brightest at a point lying about 4.0 kpc () west and 3.6 kpc () south of the nucleus. The apparent structure of this [O III] nebula is discussed in more detail in § 3.1 below.
2.2. Spectroscopy
Long-slit spectra of the [O III] nebula in NGC 7252 were obtained with both the Low-Dispersion Survey Spectrograph (LDSS-3; see Allington-Smith et al. 1994 for LDSS-2) and the Magellan Echellette (MagE) spectrograph (Marshall et al., 2008) at the Clay 6.5-m telescope (see Table 1). All spectra were taken with the spectrograph slits placed at a position angle of P.A. = across the [O III] nebula (e.g., Fig. 2a below).
2.2.1 LDSS-3 Spectra
During the 2007 September observations with LDSS-3, three long-slit spectra of the nebula were obtained. The first was taken with the “VPH Blue” grism (1090 g mm-1) through a slit, yielding a wavelength coverage of 3850–6590 Å and a spectral resolution of 4.0 Å after full reduction. The second spectrum was taken with the “VPH Red” grism (660 g mm-1) through the same slit, yielding a wavelength coverage of 6070–10,760 Å and a resolution of 6.6 Å. Finally, the third spectrum was taken with the same “VPH Blue” grism as above, but through a mask with four parallel slits of each and separated by (center to center) from each other; its spectral resolution is 3.5 Å. The purpose of this (third) spectrum was to map ionized-gas velocities measured from the [O III] 5007 emission line across the nebula, as described in § 3.4. The spatial scale along the slit for all three 2D spectra is pixel-1, with the spatial resolution set by the average seeing during the observations (Table 1).
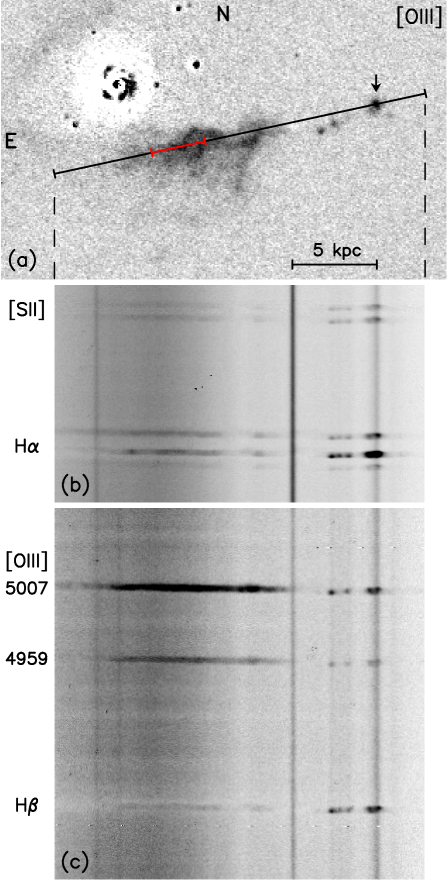
Figure 2 shows the position of the main LDSS-3 slit as placed across the [O III] nebula during the observations (panel a), and portions of the fluxed and sky-subtracted 2D red and blue spectra (panels b and c, respectively). The slit was designed and positioned to cover the brightest area of the [O III] nebula (§ 2.1) and to also cut across the brightest H II region in the western loop of tidal material. This giant H II region (marked by a downward pointing arrow in panel a) is centered on the young star cluster S101 (Schweizer & Seitzer, 1998), which served as a spatial reference point for our various measurements along the slit; henceforth, it will be referred to as H II (S101). On the two spectral segments shown in panels b and c, notice the dominance of the [O III] 5007 emission line in the nebula, while in H II (S101) is clearly the strongest line. Notice also the broad absorption line underlying the weak emission of the nebula. This absorption component stems from the galactic background light, which in NGC 7252 features a post-starburst spectrum well into the outer parts of the remnant (Schweizer, 1982, 1990; Liu & Kennicutt, 1995).
To permit flux calibration, three standard stars (EG 274, Feige 110, and LTT 1020) were observed repeatedly throughout the run, with both the blue and red grisms and using a wide slit at parallactic angle.
The subsequent reduction of the various spectra included pipeline processing to flat-field, wavelength calibrate, and rectify the spectra frame by frame (Kelson, 1998; Kelson et al., 2000). Frames belonging to multiple exposures were then coadded and cleaned of cosmic rays with the IRAF task imcombine. Finally, the resulting blue and red rectified 2D spectra were flux-calibrated and sky-subtracted in preparation for the various object extractions and measurements to follow (Fig. 2c, b). A careful comparison of the galaxy continuum in the overlap region ( – 6580 Å) of the blue and red 2D spectra showed that, to get equal fluxes there, blue fluxes needed to be multiplied by, and red fluxes divided by, a factor of 1.027. These small flux-scale corrections were applied to all fluxes from LDSS-3 spectra displayed or quoted in the present paper.
2.2.2 MagE Spectrum
During our 2009 August 23 observations with the MagE spectrograph, the slit was placed across the brightest part of the [O III] nebula, as indicated by the red bar in Figure 2a. The main goals of taking this spectrum were (1) to better cover the UV part of the nebular spectrum, including the [O II] 3727 doublet not covered by the LDSS-3 spectra, and (2) to permit a reliable measurement of the Balmer emission-line decrement. The 2.5 hr total exposure was broken into five 30 min subexposures, during which the airmass increased from 1.005 to 1.284 and the seeing held steady at –. A separate sky exposure, also of 30 min duration, was then obtained with the slit offset to a patch of blank sky 90″ N of the [O III] nebula. To calibrate fluxes, six standard stars were observed with the same slit at parallactic angle throughout the night.
The subsequent reduction of the various MagE spectra included pipeline processing to flat-field and coadd frames, rectify spectral orders, calibrate wavelengths, and subtract the sky spectrum. Although MagE covers the wavelength range of 3100 Å – 1.0 m in orders 20 – 6 (Marshall et al., 2008), the two most ultraviolet orders yielded no signal and the two most infrared orders could not be reliably processed because of scattered-light problems. The final extracted spectra cover the wavelength range 3300 – 8250 Å, extracted from orders 18 – 8, at a spectral resolution of . The spatial scale along the slit varies from pixel-1 in Order 18 (UV) to pixel-1 in Order 8 (near-infrared).
Two kinds of measurements were made from the rectified 2D order spectra. First, emission-line velocities and profiles were measured along the slit from selected orders, with results described in §§ 3.4 and 3.3.1 below. And second, a full spectrum of the brightest part of the [O III] nebula was extracted from orders 18 – 8 along a segment of the slit corresponding to a projected area of kpc2. This segment was carefully chosen to avoid ionized gas with a strong velocity gradient near the east end of the slit; it extends from WNW to ESE of the slit center, which itself was positioned at relative to the galaxy nucleus. For each spectral order, a 1D spectrum was extracted from the described segment of the slit, taking the order-dependent spatial scale into account, and the resulting eleven 1D spectra were then spliced into a single spectrum on a linear wavelength scale via a specially written IRAF script. In a final step, the weak stellar background spectrum from the outskirts of the galaxy was extracted, slightly smoothed, and then subtracted to produce a purely nebular emission-line spectrum.
3. RESULTS
The following subsections first briefly describe the general morphology of the ionized gas in NGC 7252 and where the [O III] nebula fits in, then derive the metallicity of the brightest giant H II region in the same gas stream as the nebula, and go on to present the spectral properties, physical properties, and kinematics of the nebula in detail.
3.1. Morphology of Ionized Gas in NGC 7252
Ionized gas pervades the main body of NGC 7252 and shows complex kinematics (Schweizer, 1982; Hibbard et al., 1994), as a future paper will describe in more detail. Here we give a brief overview of its apparent morphology to show where the [O III] nebula fits in and point out some details of importance for the interpretation of its spectrum.
As the panels of Figure 1 labeled “[O III]” and “” show, the projected distribution of the ionized gas can be naturally divided into four main areas: (1) a central gas disk very bright in ; (2) a NE stretch (or “front”) best seen in and lying roughly parallel to the NW tail of tidal debris seen in panels a and b; (3) a long southern stretch of gas best visible in (panel d) and extending from the E tail westward past the central disk and through the region of the [O III] nebula all the way to a string of bright H II regions ending with H II (S101); and (4) a faint NW stretch of gas seen only in and containing various faint and fuzzy H II regions (panels d and f).
The central disk of ionized and molecular gas extends to a radius of about 7″ (2.2 kpc) and rotates with – 110 km s-1, corresponding to km s-1 with the uncertainty of the disk inclination () included (Schweizer, 1982; Wang et al., 1992). As can be seen on HST broad-band images, it hosts a large number of young star clusters and OB associations arranged in spirally patterns, leading to its nickname “minispiral” (Whitmore et al., 1993; Miller et al., 1997, esp. Fig. 8). An interesting peculiarity is that the gas disk seems to feature a small “hole” at the nucleus, first noticed in the ionized gas as a likely “1″ – 2″ hole near the center” by Schweizer (1982) and then also seen in the molecular gas (CO) distribution by Wang et al. (1992). This hole, if representing a central cavity of a few hundred parsecs diameter in the gas distribution, may tell us something about recent activity in the nucleus (see § 4.5).
The NE stretch of ionized gas, brighter in than in [O III] 5007 (Figs. 1d and 1c), coincides with a 15 kpc long dust lane (or system of dust lanes) along the inner edge of the NW tail, as can be seen by comparing Figures 5b and 5d of Hibbard et al. (1994). This extensive dust lane makes it clear that the NW tail passes in front of the main body before looping around it in the southeast (Schweizer, 1982). By association, the NE stretch of ionized gas must lie in front of the main stellar body of NGC 7252 as well.
Similarly, the S stretch of ionized gas is clearly associated with the stellar debris of the E tail, best seen in Figures 1a and 1b. Since the [O III] nebula (Fig. 1c) appears well lined up with the general emission along that tail (Fig. 1d), it seems likely to be part of the tail gas. In § 3.4 we will use its kinematics to verify that this indeed seems to be the case. The E tail itself passes behind the main body of NGC 7252, as suggested by the strongly negative line-of-sight velocity (230 km s-1) of H II (S101) near its west end (§ 3.4), the kinematics of the H I gas along the tail (Hibbard et al., 1994), and -body simulations reproducing the observed tail shapes and velocities (Hibbard & Mihos, 1995; Chien & Barnes, 2010). Hence, the [O III] nebula itself probably also lies behind the main body of the remnant.
The faint NW stretch of ionized gas is more difficult to place in space. By its projected location and orientation, it seems to form part of the “W Loop” seen on deep photographs (Schweizer, 1982) and in Figure 1b. If so, it may be a continuation of the E tail material that is falling back into the remnant (Hibbard & Mihos, 1995). The line-of-sight velocity of about 60 km s-1 for one of its faint H II regions (unpublished) seems to agree at least in sign, if not necessarily in magnitude, with this interpretation. The H I distribution also seems to indicate continuity along the loop (Hibbard et al., 1994), though with coarse resolution. Yet, the continuity cannot be established beyond any doubt from our , , and images, which all fail to show a direct luminous connection between emission from the NW stretch and emission from the E tail that seems to end just past H II (S101). Perhaps the apparent gap in luminosity is due to some dust obscuration, or else the W “loop” is only apparent. We do not pursue this detail any further here, given that it does not directly impact our discussion of the [O III] nebula and its properties.
The apparent structure of the [O III] nebula itself is, of course, of interest. Perhaps the most striking features are the apparent filaments (“streamers”) extending from the ridge of highest surface brightness in [O III] 5007 to the south. Notice their different relative brightnesses in [O III] and . Whereas the westernmost filament appears brightest in [O III], it is the easternmost that appears brightest in . Another feature of interest is a possible dust lane that may run along the E-W ridge of highest [O III] surface brightness in a step-like fashion (see Fig. 1e). The reality of this possible dust lane is—however—difficult to establish, given the relatively low signal-to-noise ratio of the [O III] image.
We close this discussion of the ionized-gas morphology with a cautionary note. In the absence of high-resolution 2D kinematic information, any specific area of the projected ionized-gas distribution in this messy merger remnant could lie anywhere along the line of sight, and its preliminary assignment to a certain depth level within the remnant might have to be revised in the light of future new evidence.

3.2. Abundances from Giant H II Region Around Cluster S101
In interpreting the unusual spectrum of the [O III] nebula, having a reliable, independent estimate of the metallicity of the involved gas would be helpful. Fortunately and by design, the main slit used for our spectroscopic observations of the nebula with LDSS-3 crossed H II (S101), the giant H II region surrounding Cluster S101 (Fig. 2a), yielding a new spectrum of it. Therefore, we had a chance to redetermine the metallicity of this H II region, for which Schweizer & Seitzer (1998) had measured a logarithmic metallicity relative to the sun of with the Ritchey-Chrétien spectrograph of the Blanco 4-m telescope.
A blue and a red 1D spectrum of H II (S101) were extracted from the corresponding rectified and sky-subtracted 2D spectra (§ 2.2.1) through an aperture measuring (corresponding to kpc2), where the larger dimension represents the extent of detected and the smaller dimension the projected slit width; this aperture was centered on Cluster S101. Figure 3 displays the two spectra, which show the strong emission lines typical of a giant H II region, in the observed-wavelength interval 3900 – 7200 Å. Note that the spectral continuum contains not only light from Cluster S101, but also some background light from the galaxy. Disentangling these two continuum contributions proved too difficult, mainly because of the lack of an atmospheric-dispersion corrector (ADC) at the Clay telescope. As a result and despite certain precautions, the spectrum of Cluster S101—which appears nearly as a point source—experienced different slit losses as a function of wavelength than did the spectrum of the galaxy background. The same cause likely explains the mismatch of the cluster continuum where the blue and red spectra overlap. However, the emission lines from H II (S101) should be affected significantly less than the cluster continuum since this giant H II region extends over 4″.
Table 2 gives integrated emission-line fluxes measured from the blue and red spectra via the IRAF task splot. Because of the continuum-subtraction problem mentioned above, the spectra were displayed as shown in Fig. 3 and the “continuum” level was chosen visually near each emission line as best possible. For the Balmer lines, this involved estimating the profile of the broad underlying absorption component, whence especially the – line fluxes may be affected by that component more than the pure measuring errors indicate.
The mean visual extinction for the emission-line spectrum of H II (S101) can be estimated from the reddening of the Balmer lines by comparison with a Case B spectrum for a temperature of K (Osterbrock & Ferland, 2006) and is . This value includes the Milky Way foreground extinction of (Schlegel et al., 1998) and is derived from the measured flux ratios for and (Table 2). (The ratio yielded no reasonable answer, .) The above mean extinction agrees with a re-evaluation of the value of quoted by Schweizer & Seitzer (1998) for a Case A spectrum, which for the more appropriate assumption of Case B emission yields as well.
Concerning the mean nebular temperature of H II (S101), the approximate upper flux limit for the [O III] 4363 line—unusually large because of a likely noise spike at the observed wavelength—yields only a nominal upper limit of K (via the [O III] {4959+5007}/4363 line ratio), hardly of interest given the limited temperature range of about 7,000 – 14,000 K for known giant H II regions (Osterbrock & Ferland, 2006). The observations by Schweizer & Seitzer (1998) yielded a stricter upper flux limit for [O III] 4363 and, from it, K. In agreement with this upper limit, the abundance-determination method about to be described yields K.
Chemical abundances for oxygen and nitrogen in H II (S101) can be estimated—despite the lack of a measured flux for the [O II] 3726, 3729 doublet—through the method developed by Pilyugin & Mattsson (2011) specifically for this case. Using the reddening-corrected flux ratios of Table 2, their method yields logarithmic abundances of for oxygen and for nitrogen. Taken at face value, these abundances would indicate a relative logarithmic gas metallicity of on the solar-abundance scale by Asplund et al. (2009). However, optical spectroscopy of a large sample of giant H II regions in Spitzer/SINGS galaxies by Moustakas et al. (2010) suggests that nebular abundances derived through similar empirical calibrations need a logarithmic correction of about 0.20 to be in accord with the Asplund et al. scale. With such a correction, the logarithmic abundances for H II (S101) become about for oxygen and for nitrogen, respectively, and the relative gas metallicity , corresponding to a linear gas metallicity of . This new value agrees to within the combined errors with the value of found by Schweizer & Seitzer (1998) through the traditional method (McGaugh, 1991, 1994), which included the [O II] doublet. Giving both quite independent measurements equal weight, we adopt the average of for the metallicity of H II (S101).
In passing, we note that the reddening-corrected -luminosity of H II (S101) within the measuring aperture is erg s-1, from which we estimate a total true -luminosity of – erg s-1. This luminosity makes H II (S101) comparable to 30 Doradus, the most luminous giant H II region in the Local Group, but still about one order of magnitude less -luminous than the most extreme extragalactic H II regions (Searle, 1971; Kennicutt, 1988).
In summary, the giant H II region surrounding Cluster S101 is highly luminous, of slightly subsolar metallicity (0.80 ), and lies—based on its location and radial velocity (§ 3.4)—clearly in the same stream of returning tidal material as the [O III] nebula. Assuming that its self-enrichment is relatively low, we adopt its metallicity as likely being also that of the tidal material and nebula.

3.3. Spectral Properties of the [O III] Nebula
As described in § 2.2.2, a spectrum of the brightest part of the [O III] nebula was recorded with the MagE spectrograph through a slit, with the final extraction of the spectrum restricted to a long segment of the slit, corresponding to a projected area of kpc2 at the distance of NGC 7252. The processed spectrum has a resolution of 4100 and covers the wavelength range 3300 – 8250 Å. Figure 4 shows the two main segments of it that contain all detected emission lines. Details of two groups of lines are displayed in the bottom panels on a 10 expanded wavelength scale. Notice the dominance of the [O II] 3726, 3729 and [O III] 4959, 5007 lines.
The following subsections first describe the spectrum and our measurements of emission-line fluxes from it, then derive estimates of the temperature, electron density, and integrated [O III] 5007 and line luminosities, and finally discuss the position of the brightest part of the [O III] nebula in several diagnostic line-ratio diagrams.
3.3.1 Description of Spectrum
The optical spectrum of the [O III] nebula shown in Fig. 4 is distinctly different from that of a normal giant H II region (e.g., Fig. 3), with the main forbidden lines of oxygen, [O II] 3726, 3729 and [O III] 4959, 5007, clearly dominant in flux. It also shows the Balmer recombination lines – and the usual collisionally-excited lines [N II] 6548, 6583 and [S II] 6716, 6731. Perhaps most telling are the relatively high-excitation lines, besides [O III] 5007, of [Ne III] 3868 and He II 4686. The latter requires full ionization of helium and, hence, an ionization source rich in photons of energy eV.
Some diagnostic emission lines worth noting for their absence within the noise limits of the MagE spectrum are [Ne V] 3346, 3426, [O III] 4363, [N I] 5198, 5200, [N II] 5755, and He I 5876. The absence of the two [Ne V] lines prevents us from commenting on the possible presence of ionizing photons with energies of eV (necessary to produce Ne4+), but yields only weak constraints because of the increased noise of the MagE spectrum at wavelengths Å (see § 4.1).
All emission lines measured in the [O III] nebula are, with the exception noted below, quite narrow. This can be established from the MagE spectrum much better than from the lower-resolution LDSS-3 spectra. Gaussian fits to the line profiles of [O III] 4959, 5007, and at six locations along the MagE slit yield—after correction for the instrumental profile—a mean full width at half maximum of km s-1, corresponding to a mean velocity dispersion in the ionized gas of km s-1. This velocity dispersion is comparable to the isothermal sound speed in ionized gas, 10 km s-1 at K (e.g., Spitzer, 1978). Given the volume of the sampling regions, kpc2 times the depth of the [O III] nebula along the line of sight, this low measured dispersion suggests that small-scale velocity gradients within the nebula must be relatively minor.
The one exception to the generally narrow line widths is the observed asymmetric broadening of some forbidden lines near their base. The strongest such broadening is observed for the [N II] 6548, 6583 lines, as illustrated in Fig. 4c, whereas no similar broadening is seen in the Balmer emission lines. The cause of this asymmetric broadening is currently unknown. Unfortunately, the signal-to-noise ratio of the MagE spectrum is insufficient to permit reliable two-component fits for the various forbidden lines and locations along the slit.
Fluxes of all emission lines were measured from the MagE spectrum shown in Fig. 4 with the IRAF task splot. Line profiles were fit with a single Gaussian or, when clearly broadened near the base, with two Gaussians, and integrated. Table 3 gives the resulting fluxes of the main, narrow components. Adding the flux of the broad components, when present and measurable, would increase by 5% in all cases except for the [N II] doublet, where would increase by about 20% to 25% for both lines. Even the latter sizable flux increase would, however, not significantly affect any of the results derived in the present paper. The upper flux limits given in Table 3 for four interesting, but undetected emission lines, [Ne V] 3426, [O III] 4363, [N II] 5755, and He I 5876, correspond to of the local noise.
Table 3 also gives flux ratios relative to corrected for Milky-Way foreground reddening, , and for Milky-Way plus internal reddening, . The foreground-reddening corrections were computed from the adopted (Schlegel et al., 1998) using the reddening curve by Cardelli et al. (1989), as approximated by O’Donnell’s (1994) formulae. After correcting the observed Balmer decrement for foreground reddening, the internal reddening was estimated by comparing the decrement with that of a Case B spectrum for K and low density (Osterbrock & Ferland, 2006), but with the ratio / set to 3.1. This slightly increased value has been shown to be appropriate for nebulae photoionized by a power-law source (Halpern & Steiner, 1983; Gaskell & Ferland, 1984), which seems to be the case here (see § 3.3.3). The resulting weighted mean internal extinction, , is only a rough estimate since it rests on the simplistic assumption that the dust distribution is screen-like. Hence, we adopt a more conservative value of that indicates the entire likely range of internal visual extinction. The flux ratios corrected for both Milky-Way and internal reddening, , are given in the last column of Table 3.
3.3.2 Electron Density, Temperature, and Line Luminosities
From the line fluxes listed in Table 3, we can estimate the mean electron density and temperature in the part of the [O III] nebula covered by the MagE slit.
The mean line ratio of the [O II] doublet, , yields cm-3 (e.g., Osterbrock & Ferland, 2006), while (noisy) individual values of the ratio along the slit suggest a range of cm-3, with values above 100 cm-3 rare. The mean line ratio of the [S II] doublet, , yields cm-3. Thus, within the area covered by the MagE slit, the electron density seems to be generally low, – cm-3.
We can gain some additional insight into the density distribution within the nebula from the two single-slit spectra obtained with LDSS-3 (§ 2.2.1). The blue spectrum does not cover the [O II] doublet, but the red spectrum does include the diagnostic [S II] doublet and shows that along the entire section of the [O III] nebula covered by the slit (see Fig. 2). This limits the density to cm-3 along that 10 kpc long section with—again—most values significantly lower than this upper limit. Thus, it seems reasonable to assume that the entire visible [O III] nebula has a large-scale ( 0.5 kpc) mean significantly below this limit. Most diagnostic line ratios can, therefore, be interpreted within their low-density approximations (§ 3.3.3).
Upper limits for the mean temperature of the [O III] nebula within the MagE aperture can be estimated from [O III] and [N II] line ratios. Using the fully reddening-corrected fluxes of Table 3, the [O III] line ratio yields K for cm-2 (Osterbrock & Ferland, 2006, Equation (5.4)). Similarly, the [N II] ratio yields K (ibid., Equation (5.5)). In what follows we adopt the stricter, rounded-up limit of K for the nebular temperature.
Integrated line luminosities for the entire [O III] nebula are of interest since they may help establish the source and history of excitation. Here we derive the integrated [O III] 5007 and luminosities as follows.
The [O III] 5007 flux measured within a subsection of the MagE slit is erg cm-2 s-1 (Table 3). We used it to calibrate the counts in our continuum-subtracted, but otherwise uncalibrated [O III] 5007 image (§ 2.1 and Fig. 1). Note that the [O III] 5007 line is the only emission line of the nebula within the narrow passband used for the exposure. Integrating counts over an area of ( kpc2) oriented at P.A. = , which covers all measurable [O III] line emission of the nebula, and converting the sum to flux units yields a total observed flux of erg cm-2 s-1. The total reddening-corrected flux is erg cm-2 s-1, and the corresponding true integrated line luminosity of the [O III] nebula at the distance of NGC 7252 is erg s-1. Note that the relatively large errors for the last two, reddening-corrected quantities reflect mainly the uncertainty in our adopted value for the internal reddening, (§ 3.3.1).
The determination of the integrated flux and luminosity is slightly more complicated since the [N II] 6583 line enters the narrow passband used for the “” imaging at nearly full strength, while the [N II] 6548 line lies on the blue flank of the passband and enters at about 44% of peak transmission. The line itself is located at peak transmission. Hence, to calibrate the counts of the “” image in flux units we have to calculate the weighted sum of the three line fluxes given in Table 3, , and divide it by the integrated number of image counts within the subsection of the MagE slit. On the assumption that the line ratios within the slit are representative of those across the entire [O III] nebula, we can then estimate the integrated flux of the entire nebula over the same area used for the [O III] 5007 line above; we find a total observed flux of erg cm-2 s-1. The total reddening-corrected flux is erg cm-2 s-1, and the corresponding true integrated luminosity of the nebula is erg s-1. The 21% errors of the last two quantities reflect the combined uncertainties of the background subtraction, flux calibration, and internal reddening correction.
As a check on our integrated luminosities, the ratio agrees well with the flux ratio measured within the MagE subaperture (Table 3), . The fluxes measured with MagE were, of course, used to calibrate the continuum-subtracted narrow-band images, yet it is reassuring to know that the continuum subtractions and count integrations performed on these images did not significantly change the ratio. The good agreement also supports the assumption that the relevant line ratios do not vary much across the entire [O III] nebula (see also § 3.3.3 below).
3.3.3 Line-Ratio Diagnostics
Ratios of emission-line fluxes from ionized-gas nebulae provide important diagnostic information concerning the possible source, or sources, of excitation (e.g., Baldwin et al., 1981; Veilleux & Osterbrock, 1987; Kewley et al., 2001, 2006).
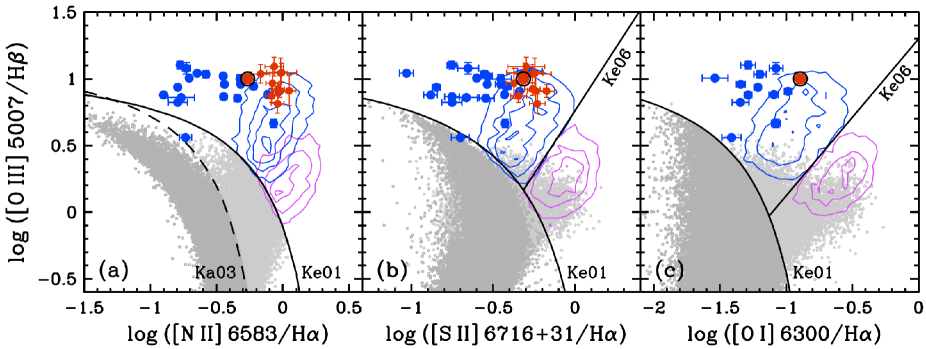
Figure 5 shows reddening-corrected logarithmic line ratios for the [O III] nebula (red dots) plotted in three standard diagnostic line-ratio diagrams. Also plotted, for comparison, are line ratios for a number of extended emission-line regions (EELRs) around quasars observed by Fu & Stockton (2009, blue dots) and for about 102,000 emission-line galaxies from the Sloan Digital Sky Survey (SDSS, gray dots plus red and blue isopleths). Curves and straight lines mark well-known boundaries for starforming, composite-spectrum, LINER, and Seyfert galaxies, as detailed in the caption. As the high-quality line ratios measured with MagE (black-circled red dot in each panel) show, the [O III] nebula clearly lies in Seyfert territory (blue isopleths), well above the boundary for extreme starbursts (Kewley et al., 2001) and away from the dividing line between Seyfert and LINER galaxies (Kewley et al., 2006). Emission-line nebulae in that part of the diagrams, especially at , are most often photoionized by a source with a power-law spectrum.
According to photoionization model grids by Groves et al. (2004) shown in Fu & Stockton (2009, Fig. 11b) the [O III] nebula’s position in the metallicity-sensitive [O III]/ vs [N II]/ diagram suggests gas of slightly sub-solar metallicity ( ) photoionized by a power-law-spectrum source with an exponent of about . Supporting this tentative interpretation is the fact that our measured abundance of in the nearby giant HII region H II (S101) (§ 3.2) yields a similarly sub-solar abundance for the gas in that part of NGC 7252’s tidal tail. Furthermore, the line ratios of the [O III] nebula lie close to those of the EELRs around quasars measured by Fu & Stockton (2009), all of which appear to be of subsolar metallicity and are clearly photoionized by the central engine.
To check on our MagE results, we also measured line ratios from the blue and red LDSS-3 spectra along the 10 kpc cross section of the nebula covered by the main long slit (Fig. 2 and § 2.2.1). Figures 5a and 5b display these ratios as red dots with error bars. (Note that no ratios are shown since the [O I] 6300 line lies too close to the ends of the blue and red spectra to be measured reliably.) The ratios measured with LDSS-3 support those measured with MagE, and hence the above conclusions concerning the metallicity and likely ionization mechanism. The one minor exception is that the ratios measured with LDSS-3 exceed those measured with MagE by 70% on average. About 10% of this excess can be attributed to the weaker flux measured with LDSS-3, where the relatively low resolution makes the subtraction of the underlying continuum with absorption considerably more difficult. Also, the broad components of the [N II] doublet mentioned above (§ 3.3.1) are unresolved in the LDSS-3 spectra, adding 20% – 25% to the measured flux (see Fig. 4c). Hence, about half of the excess measured with LDSS-3 relative to the higher-resolution MagE spectrum is explained, but the other half remains unexplained. Even with this uncertainty, however, the LDSS-3 line ratios confirm the main MagE result that NGC 7252’s [O III] nebula is likely photoionized and possibly related to EELRs seen around quasars.
Finally, we searched for any possible gradients in the three line ratios , , and that might indicate varying excitation levels along the cross section covered by the LDSS-3 long slit and found none. However, remember that in the various filaments of the nebula extending from its bright ridge southward the [O III] and images (Figs. 1e and 1f) strongly suggest the presence of excitation () variations, as described in § 3.1. Hence, the question of such variations across the entire nebula will need to be reexamined through detailed observations with an integral-field-unit (IFU) spectrograph.
3.4. Kinematics of the [O III] Nebula
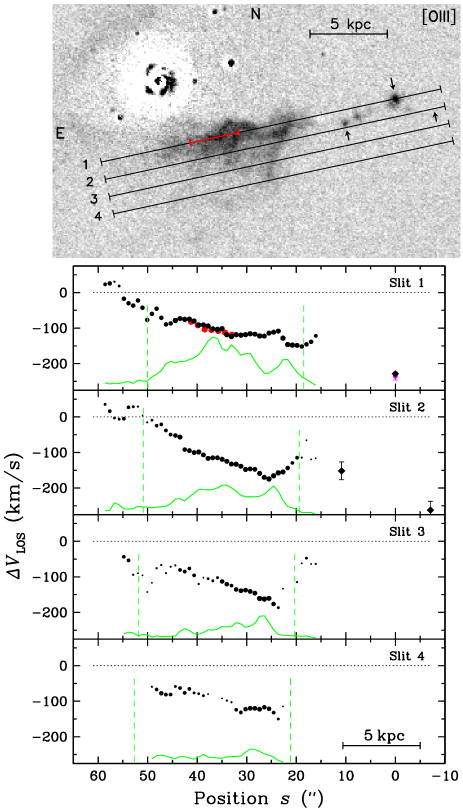
The kinematics of the [O III] nebula holds clues about both the nebula’s relation to the gas of NGC 7252 surrounding it and its own internal motions. We used the blue 2D spectrum obtained with LDSS-3 through a mask with four parallel slits (§ 2.2.1) to roughly map this kinematics and the velocities of three giant H II regions in the W loop. The results are shown in Figure 6, where black data points in the bottom four panels represent line-of-sight velocities relative to the systemic velocity of the galaxy, km s-1 (Schweizer, 1982).
These velocities were measured across the [O III] nebula with the IRAF task splot and an “aperture” of (9 pixels) in steps of (5 pixels) along each of the four slits. Although emission lines other than [O III] 5007 were also measured when feasible, only the 5007 line was strong enough to be measured consistently along most of each slit. Hence, the plotted data points for the nebula and ionized gas surrounding it represent measurements from only this line, their sizes being proportional to the estimated quality of the measurement. For the largest points, the estimated error is roughly of the size of the plotted point ( km s-1), while the smallest, least reliable data points may have errors of up to about km s-1. Note that along Slit 1 the velocities measured with LDSS-3 (black data points), where they overlap with those measured with MagE (red data points), agree excellently. Solid green lines in each of the four bottom panels of Figure 6 represent the [O III] 5007 line flux on an arbitrary, but uniform scale, and pairs of vertical green dashed lines mark the two right-ascension boundaries of the nebula, and relative to the nucleus (§ 2.1). As the figure shows, the general trend of is to decrease (i.e., become more negative) from E to W across the nebula, with most relative velocities ranging between about 50 km s-1 and 200 km s-1.
As Figure 6 also shows, this trend seems to continue beyond the [O III] nebula into the ionized gas of the W loop, where Slit 1 crossed the giant H II region H II (S101) by design and Slit 2 crossed two H II regions (marked in the top panel by upward-pointing arrows) at least in their outskirts by chance. The velocities of these three regions were measured from multiple emission lines to improve their accuracy. Note that our new value of for H II (S101), km s-1, agrees well with that measured by Schweizer (1982), km s-1 after correction for redshift stretching ignored by him (magenta point with error bars); we adopt a weighted average of km s-1 for this giant H II region. In contrast, the of the two H II regions crossed by Slit 2, km s-1 and km s-1, have relatively large errors because these regions were not centered on the slit, leading to non-uniform slit illuminations unknown in detail. Taken all together, these optical velocity measurements strongly support the notion that the [O III] nebula lies in a stream of at least partially ionized gas that includes the southern branch of the W loop.
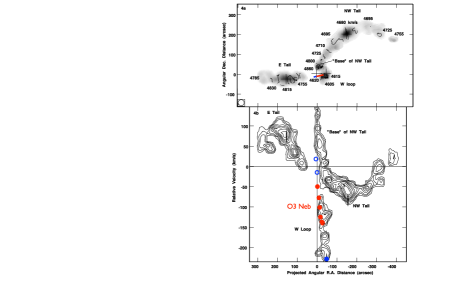
It is interesting to also compare these ionized-gas velocities with the neutral-gas H I velocities measured by Hibbard et al. (1994). Figure 7 shows, at the top, the H I distribution in NGC 7252 with the locations of our ionized-gas velocity measurements indicated by a blue-and-red bar. To approximate the lower spatial resolution of the H I observations, we averaged the measured ionized-gas velocities from slits 1 and 2 (Fig. 6) in 5″ long segments along the slits, yielding six mean velocities within the [O III] nebula plus two to its east. The bottom panel of Fig. 7 shows the six velocities of the [O III] nebula as solid red dots superposed on a position–velocity diagram of the H I velocities displayed in contour form (for details, see Hibbard et al. 1994, Fig. 4). The two blue open circles mark ionized-gas velocities to the east of the [O III] nebula, while the filled blue dot near the bottom of the diagram marks the velocity of H II (S101). From these various data points, the [O III] nebula clearly appears to be associated with the H I in the W loop. In contrast, the ionized gas to its east (blue circles) appears more likely to be associated—if at all—with the NW tail than with the E tail. Further, the giant H II region H II (S101) clearly appears embedded in the H I of the southern branch of the W loop.
In summary, the combined velocity data strongly suggest that the [O III] nebula, the various H II regions to its west, and the neutral H I are all part of the gas stream forming the southern branch of the W loop. This gas stream is clearly falling back into the remnant. Whether it itself is a continuation of the gas stream in the E tail, as the H I profiles of Fig. 7 and dynamical models of NGC 7252 (Hibbard & Mihos, 1995; Chien & Barnes, 2010) suggest, is at present less certain. We comment on this issue further in §§ 4.3 and 4.6 below.
4. DISCUSSION
The present discussion focuses first on the excitation mechanism for the [O III] nebula, which most likely is photoionizaton by a power-law source in the nucleus of NGC 7252. It then describes the lack, so far, of any detection of AGN activity in this remnant, with tight upper limits. We then put forth the hypothesis that the nebula is an “ionization echo” similar to others recently discovered in some weakly active galaxies, except that is it over an order of magnitude less luminous. After a brief discussion of the implications for the history of activity in NGC 7252, we point out some remaining questions and suggest further work.
4.1. Excitation Mechanism for [O III] Nebula
The position of the [O III] nebula in the three line-ratio diagrams shown in Figure 5 and the presence of He II 4686 line emission in its spectrum (Fig. 4) strongly point toward the nebula beeing photoionized by a source with a relatively hard spectrum rich in eV photons (§ 3.3.1).
Yet, given the nebula’s location in the W loop’s gas stream that is falling back into the remnant, possibly from the E tidal tail (§ 3.4), one has to seriously consider the possibility that some shocks might occur in that stream, whether it be through collision of the stream with other gas in the already rather relaxed halo of NGC 7252, with an outflow from the central region, or perhaps even with a so far undetected jet emanating from the nucleus.
The three main reasons why we think shock excitation of the [O III] nebula is unlikely are as follows. First, shock excitation typically yields high electron temperatures, , yet our measured upper temperature limit of for the nebula indicates much cooler gas. The few “shock + precursor” models for near-solar abundances in the MAPPINGS III library of shock models (Allen et al., 2008) that do reach temperatures below 10,000 K have shock velocities well below 300 km s-1, quite insufficient to produce the observed high excitation. Second, only models with shock velocities of km s-1 get close to being able to reproduce the observed line ratio of (Table 3), yet the measured emission-line widths indicate a low velocity dispersion in the gas of km s-1, a value close to the isothermal sound speed in ionized gas of the measured temperature (§ 3.3.1); it is difficult to conceive how the above high shock velocities could be present without creating significant turbulence and line broadening. And third, the observed line ratio of (Table 3) is difficult to reproduce with shock velocities of less than about 350 km s-1 and, hence again, incompatible with the low measured temperature.
An alternative way to summarize these difficulties is that in diagnostic diagrams with shock-sensitive line ratios the MAPPINGS III models can easily be made to cover the domain of LINERs, but not the domain of Seyfert galaxies (e.g., Figs. 33 and 34 in Allen et al. 2008), in which the [O III] nebula clearly lies. In short, the line strengths measured in the nebula seem to strongly favor photoionization by a relatively hard source of radiation over some form of internal shock excitation.
Accepting photoionization by a presumably central power-law source with a relatively hard spectrum as the likely excitation mechanism, we can estimate the mean ionization parameter in the brightest part of the [O III] nebula (covered by the MagE slit) from the reddening-corrected ratio , using the photoionization model by Komossa & Schulz (1997) and the approximation formulae by Bennert (2005, esp. Appendix C.4). The logarithmic value of this parameter, which represents the dimensionless ratio of the local ionizing photon density to the electron density (e.g., Osterbrock & Ferland, 2006), is for cm-3 and for cm-3. These values lie well within the range of typically measured in EELRs associated with quasars and Seyfert galaxies (e.g., Fu & Stockton, 2009; Keel et al., 2012a).
Note that our non-detection, in the [O III] nebula, of the [Ne V] 3426 line often seen in EELRs does not weaken any of the above conclusions. The measured upper limit for this line’s flux ratio to , (Table 3), places the [O III] nebula among relatively week [Ne V]-line emitters in the sample of 19 EELRs (“AGN-ionized clouds”) studied by Keel et al. (2012a). However, this limit lies still well within the range of observed for the sample, with seven EELRs falling below the limit for the [O III] nebula. Similarly, the upper limit for the [Ne V] line’s flux ratio relative to [Ne III] 3868, , also places the [O III] nebula potentially within the range of measured for the sample of EELRs (Table 4 of Keel et al., 2012a), in this case above the bottom quintile (four EELRs out of 19). Clearly, detecting and measuring the [Ne V] 3426 line in the [O III] nebula will not be easy because of its low surface brightness, but it will be important for checking our above conclusion that the nebula is most likely photoionized by a central power-law source in NGC 7252.
4.2. Properties of the Nucleus
Given the above evidence that the [O III] nebula is, or has been, excited by a power-law source, it seems perplexing that no clear evidence of any nuclear activity in NGC 7252 has been found to date.
Optically, the spectrum of the nucleus shows strong Balmer absorption lines typical of a post-starburst stellar population, with only relatively weak emission lines superposed (Schweizer, 1982, 1990; Liu & Kennicutt, 1995). Table 4 gives the [O II] 3727, , [O III] 5007, and flux ratios and apparent luminosities measured with the MagE spectrograph through a ( pc2) aperture centered on the nucleus and, for comparison, the corresponding flux ratios and luminosities for both the central ionized-gas disk out to (1.28 kpc) and the entire [O III] nebula. The data for the nucleus and central gas disk are taken from a detailed study of the central region of NGC 7252 to be published separately (Schweizer et al., in preparation). Note that the apparent emission-line luminosity of the nucleus, computed from the measured line flux on the assumption of negligible internal extinction, is a measly erg s-1, whereas that of the surrounding ionized-gas disk within (0.16 – 1.28 kpc) is erg s-1, or a good two orders of magnitude higher. Similarly, the apparent [O III] 5007 luminosity of the nucleus is only erg s-1, while that of the ionized-gas disk is about 40 higher. Note also that the ratio of this nuclear [O III] 5007 luminosity to that of the entire [O III] nebula is small, . In short, the nuclear optical-line emission appears weak and is nearly negligible compared to the line emission from the surrounding, strongly star-forming (6 yr-1) central gas disk; it definitely does not show any signs of nuclear activity.
Could the nucleus be highly reddened and its emission-line fluxes strongly extincted? The surface-brightness and color profiles measured with the Hubble Space Telescope (HST) (Laine et al., 2003; Rossa et al., 2007) do not suggest so. On the contrary, the profile, which stays approximately flat at from to 5, turns slightly bluer within , reaching in the central . And the central surface-brightness profile appears as a pure power law with essentially the same index in both (Miller et al., 1997) and (Rossa et al., 2007). Hence, there is no sign of significant nuclear reddening or extinction. This is consistent with the measured flux ratio corrected only for Milky-Way foreground reddening (Table 4), though the large uncertainty makes this a relatively weak check.
In the mid-infrared, a significantly stronger check on the possible presence of any highly reddened AGN is provided by two magnitudes measured with the Wide-field Infrared Survey Explorer (WISE) (Wright et al., 2010), at m and at m. The simple color criterion , in connection with the magnitude cutoff , reveals AGNs both unobscured and obscured over the redshift range with great efficiency (Stern et al., 2012). Yet the central magnitudes measured for NGC 7252 with a point-spread function of 6″ FWHM, and (Cutri et al., 2012), yield a color of , placing the nucleus far short of the realm of local Seyfert galaxies ( to 1.7 mag). Hence, there is no evidence in the mid-infrared either for any strongly reddened active nucleus in NGC 7252, in agreement with a more detailed Spitzer/IRS spectroscopic study by Brandl et al. (2006).
There is also no evidence from the radio continuum for any significant nuclear activity. A central radio-continuum source has been detected with a flux density of mJy at 1.4 GHz and “is possibly resolved” when observed at a resolution of (FWHM) with the VLA’s hybrid CnB array (Hibbard et al., 1994). At the distance of NGC 7252, this flux density corresponds to a spectral luminosity of erg s-1 Hz-1, which in turn indicates a star formation rate (SFR) of yr-1 (via the conversion relation by Murphy et al. 2011). This extinction-free estimate of the SFR agrees well with the SFR of yr-1 determined from the integrated luminosity of the ionized-gas disk (corrected for an internal extinction of mag; Schweizer et al., in prep.). Hence, there is no need for any nuclear contribution to the observed , and we estimate an upper limit for any such contribution to be less than 10% of the detected luminosity, or erg s-1 Hz-1. This radio power would still permit the nucleus of NGC 7252 to lie in the mid-range of radio powers of local Seyfert galaxies ( erg s-1 Hz-1 for detected Seyferts; Ho & Ulvestad 2001), but would make NGC 7252 at least an order of magnitude less radio loud than the well-known nearby Seyferts NGC 1068 (Sey2, erg s-1 Hz-1) and NGC 4151 (Sey1.5, erg s-1 Hz-1). Obviously, better than 1 resolution radio-continuum images will be needed to address the question whether NGC 7252’s nucleus shows any detectable radio emission.
Finally, if there is any hard X-ray emission from the nucleus betraying its activity, it has to be quite weak. The suggestion by Awaki et al. (2002) that the 2.0 – 10 keV X-ray emission detected with ASCA’s Solid-State Imaging Spectrometer (SIS) may indicate nuclear activity in NGC 7252 is questionable (Nolan et al., 2004), given that the 6 diameter region used for the spectrum extraction contains the entire body of the remnant, including its numerous known extra-nuclear X-ray sources. As Nolan et al. (2004) show from Chandra observations, the relatively X-ray luminous “nuclear” source is clearly extended, with a break in its radial counts profile occurring at (where the SFR in the central gas disk drops off sharply). An analysis of its XMM–Newton spectrum in terms of gaseous and absorbed-power-law components reveals the presence of a possible power-law component peaking at 2.0 keV and traceable over the energy range 1.4 – 4.0 keV. The absorption-corrected luminosity of this component is erg s-1, with a 90% confidence interval of (1.27 – erg s-1 (values adjusted to our distance of 66.2 Mpc adopted for NGC 7252).
Yet, the unabsorbed 2 – 10 keV luminosity expected from the intense star formation ( yr-1) in the central gas disk is erg s-1, based on the relation
determined by Ranalli et al. (2003) and adjusted to the Kroupa (2001) initial mass function (IMF) by Kennicutt & Evans (2012). Hence the entire measured X-ray luminosity of the central hard component is more than fully supplied by the star-forming central disk, and there is no need to invoke any extra contribution from an AGN. We estimate that any such hypothetical nuclear X-ray component, if it exists, has currently a luminosity of erg s-1.
In summary, the current level of nuclear activity in NGC 7252 appears to be low from X-ray through optical to radio wavelengths and remains—if it exists—undetected so far.
4.3. The [O III] Nebula as a Possible “Ionization Echo”
The observed high excitation level of the [O III] nebula in NGC 7252 poses a riddle: On the one hand it strongly points toward photoionization by a central power-law source as the nebula’s excitation mechanism (§ 4.1), yet on the other hand the nucleus of NGC 7252 appears devoid of any such power-law source and seems, therefore, to be presently inactive (§ 4.2).
One possible solution is that the [O III] nebula could—like the by now well-studied [O III]-luminous nebula nicknamed Hanny’s Voorwerp near IC 2497 (Lintott et al., 2009; Józsa et al., 2009; Rampadarath et al., 2010; Schawinski et al., 2010; Keel et al., 2012b)—be an ionization echo revealing relatively recent ( 104 – 105 yr), but now declined AGN activity in its host galaxy. If so, how long past the cessation of central AGN activity could the nebula keep glowing and keep its high-excitation signatures?
For a nebula consisting mostly of hydrogen, the recombination time is years for K, where is the total recombination coefficient for Case B (Osterbrock & Ferland, 2006, esp. Table 2.1) and is the local electron density. In the case of the [O III] nebula, K, cm3 s-1, and – 100 cm-1, whence the hydrogen recombination time is – 11,300 yr. Clearly, if its source of excitation were suddenly turned off the nebula would fade on a short time scale ( yr). Since different ionic species differ in their , the observed line ratios would change as well (Binette & Robinson, 1987). Specifically, the excitation-sensitive ratios and would decline rapidly, since the recombination times of both O++ and Ne++ are an order of magnitude shorter than (H+). Hence, the [O III] luminosity of the nebula would begin fading on a very short time scale, likely yr. It would, though, take the fading about 20,000 – 50,000 years to progress through the nebula because of its kpc projected size (§ 2.1) and the finite speed of light.
Yet, the value measured for the excitation of the [O III] nebula, (Table 3), is close to the maximum values observed in Seyfert galaxies and EELRs around quasars (Fig. 5). Hence, the nebula was clearly still being excited, most likely by a source of strongly ionizing radiation (§ 4.1), when it emitted the photons recorded in our images and spectra. As Binette & Robinson (1987) concluded already long ago for similar [O III]-bright emission-line regions around galaxies with AGNs, this rules out any “fossil nebula” interpretation. What, then, is the minimum luminosity of the ionizing source required to ionize the nebula if the source lies in the nucleus, and what is the light travel time from the nucleus to the nebula, during which the nucleus could have faded?
A lower limit to the luminosity of the central ionizing source can be estimated from the recombination lines of the [O III] nebula and, specifically, from the observed flux. As Zanstra (1927) first pointed out for a pure hydrogen nebula excited by a central star, the number of photons emitted by the nebula is related to the number of ionizing photons from the central source (star) through the relation
where is the effective recombination coefficient for (Case B), the total hydrogen recombination coefficient for Case B, and the covering factor of the nebula as seen from the central source. In a real nebula also containing helium, the main wavelength range of UV photons capable of ionizing hydrogen lies between the ionization limit of helium at 228 Å (54.4 eV) and that of hydrogen at 912 Å (13.6 eV). As Keel et al. (2012a) point out for the case of a nebula excited by an AGN, the luminosity of the central source must be sufficient to explain all regions of emission, including those of highest surface brightness; in the present case of the [O III] nebula, the peak surface brightness measured in the MagE slit corresponds to erg cm-2 s-1 per square arcsecond. Using their formula , where is the redshift and the angle of the area under consideration (here ) as seen from the central source and expressed in degrees, yields a minimum ionizing luminosity of erg s-1 for the central source in NGC 7252 as seen by the [O III] nebula.
For an ionizing continuum typical of AGNs, with , the energy is approximately constant per decade, whence the minimum X-ray luminosity should be comparable to the above-derived minimum ionizing luminosity. Yet, our estimated upper limit for the current nuclear X-ray luminosity of NGC 7252 is erg s-1 (§ 4.2), or fully three orders of magnitude lower than expected. This gross mismatch suggests that the nucleus experienced strongly increased activity until recently, sufficient to photoionize the [O III] nebula as observed, yet this activity has declined since then dramatically.
The light-travel time from the nucleus to the [O III] nebula could be as short as 18,000 yr if the nebula were to lie at a true distance equal to its 5.4 kpc projected distance (for its brightest part) from the nucleus, i.e., in the same sky plane as the nucleus, or it could be even shorter if the nebula were to lie closer to us than the nucleus, i.e., in front of that sky plane. However, the kinematics of the nebula suggests that it is part of the tidal stream of infalling gas (§ 3.4), which two best-fit models place mostly behind that plane (Hibbard & Mihos, 1995; Chien & Barnes, 2010). Unfortunately, these models do not reproduce the H I observations in sufficient detail to permit locating the nebula accurately along our line of sight (J. E. Barnes, private communication). They only suggest that as part of the tidal-gas stream the nebula must lie somewhere between the sky plane and 30 kpc behind it. This leaves us to guess that the increase in light-travel time from the nucleus to us via the [O III] nebula is of the order of 20,000 – 200,000 yr.
We conclude that (1) the [O III] nebula appears to be the ionization echo of some AGN activity in NGC 7252 that lasted until about 20,000 – 200,000 yr ago, and (2) this nuclear activity has declined by at least three orders of magnitude since then. Note that the decline could easily exceed three orders of magnitude since the minimum ionizing luminosity derived above ( erg s-1) is based on the projected distance of the nebula from the nucleus (5.4 kpc), while the true distance may be up to 6 times larger. Perhaps the single most important assumption made in the above arguments is that the nuclear source emits isotropically. Were the emission to be beamed toward the [O III] nebula instead, the inferred decline of nuclear activity could be significantly less. We comment on this and other alternative interpretations further in § 4.6 below.
4.4. Comparison with Hanny’s Voorwerp and Similar EELRs
How does the [O III] nebula of NGC 7252 compare with the prototypical ‘Hanny’s Voorwerp’ of IC 2497 and with other extended emission-line regions also thought to be ionization echoes?
Table 5 summarizes the main parameters derived for the [O III] nebula in the present paper and for Hanny’s Voorwerp by Lintott et al. (2009), Schawinski et al. (2010), and Keel et al. (2012b). As a comparison of the individual parameters shows, the two nebulae are surprisingly similar in many of their properties. The main difference is that the [O III] nebula appears to be a scaled down version of Hanny’s Voorwerp, being about 3 smaller in linear projected size and 100 less luminous in and [O III] 5007. Note also that its metallicity is about twice that of Hanny’s Voorwerp, though still clearly subsolar, and its electron temperature is significantly lower. This lower temperature only strengthens the case that, like Hanny’s Voorwerp, the [O III] nebula is unlikely to be shock excited (§ 4.1) and must, therefore, be photoionized.
EELRs were first discovered around QSOs and are recognized as [O III]-bright emission nebulosities extending well beyond the limit of central narrow-line regions ( kpc), typically to distances of 10 – 40 kpc from the center. They are often, but not always, associated with gaseous tidal debris being photoionized by a central engine (Stockton & MacKenty, 1983, 1987; Stockton et al., 2006). Their typical projected size is 10 kpc (Huseman et al., 2013), in accord with that of the [O III] nebula. A somewhat arbitrary minimum line luminosity of erg s-1 is often associated with the definition of an EELR (e.g., Fu & Stockton, 2009; Huseman et al., 2013). According to this restrictive definition, Hanny’s Voorwerp clearly is an EELR, while NGC 7252’s [O III] nebula is not, falling short by a factor of 36 in . Yet, the two nebulae are so similar in most of their properties, including their being associated with gaseous tidal debris, that we believe it more logical to regard NGC 7252’s nebula as an EELR of very low luminosity.
A comparison of the nuclear ionizing luminosities and decline times inferred from the [O III] nebula and Hanny’s Voorwerp for NGC 7252 and IC 2497, respectively, is also of interest. As Table 5 shows, the minimum nuclear for NGC 7252 is three orders of magnitude lower than that for IC 2497, suggesting that the nuclear activity still seen in NGC 7252 by the [O III] nebula is much less than that seen by Hanny’s Voorwerp in IC 2497. In both galaxies, the present X-ray luminosity in the 2 – 10 keV band is at least three orders of magnitude lower than the ionizing luminosity still exciting the EELR,222 Neither NGC 7252 nor IC 2497 was detected in the 14 – 195 keV band by the Swift/BAT All-Sky Hard X-Ray Survey (Baumgartner et al., 2013), thus eliminating the possibility of highly obscured strong AGN activity in both galaxies. and the inferred decline times of about – yr are similar. However, note that the minimum ionizing luminosity inferred for IC 2497, – erg s-1 (Schawinski et al., 2010; Keel et al., 2012b) clearly attributes a recent QSO-like luminosity ( erg s-1) to the galaxy’s nucleus, whereas NGC 7252’s erg s-1 only attributes a recent Seyfert -like luminosity (1042 – 1044 erg s-1) to this merger remnant’s nucleus.
Studying a sample of 19 galaxies with EELRs at projected radii 10 kpc, Keel et al. (2012a) have recently identified seven additional cases where the EELR is likely to be an ionization echo revealing past enhanced AGN activity in the host galaxy. The seven host galaxies have redshifts in the range of – 0.091 and inferred minimum ionizing luminosities of – erg s-1 necessary to excite their EELRs. Hence, if we add NGC 7252 and IC 2497 to this sample of candidate systems with ionization echos, NGC 7252 with its [O III] nebula clearly marks the low-energy end of the sequence, while IC 2497 with its Voorwerp marks the high-energy end. At , NGC 7252 is the nearest of the nine objects, but not by much. Hence, the fact that its erg s-1 is more than an order of magnitude lower than that of the next member of the sequence ( erg s-1) makes NGC 7252 a host galaxy with a low-luminosity ionization echo and exceptionally faded AGN activity. In contrast, IC 2497 and Hanny’s Voorwerp at represent a relatively nearby case of recent QSO-like luminosity followed by a very strong decline, explaining why this system was discovered first and will likely remain the prototype of its class.
In short, NGC 7252’s [O III] nebula seems to be the lowest-luminosity ionization echo discovered so far. The nucleus of NGC 7252 itself must have reached at least Seyfert-like luminosity to still excite the nebula as observed, yet has since faded by several orders of magnitude to a very low, so far undetected activity level. The fact that the [O III] nebula is clearly associated with gaseous tidal debris adds to the growing evidence that many ionization echos occur in just such debris (Stockton & MacKenty, 1983; Józsa et al., 2009; Keel et al., 2012a).
4.5. Implications for the History of NGC 7252
It is interesting to place the above results on the [O III] nebula and inferred nuclear activity into the context of NGC 7252’s merger history.
According to the best currently available model simulation (Chien & Barnes 2010; see also Hibbard & Mihos 1995), this major merger began with the first close approach of two gas-rich disk galaxies about 640 Myr ago and was essentially complete when the two nuclei coalesced 220 Myr ago (times scaled to km s-1 Mpc-1). During this period, shock-induced star and cluster formation was enhanced by a factor of 4 over normal, leading to the spectacular set of several hundred young halo globular clusters (Miller et al., 1997; Schweizer & Seitzer, 1998), and peaking shortly after the coalescence of the two nuclei (see Fig. 4 of Chien & Barnes 2010). Presently, about 220 Myr after coalescence, intense star and cluster formation continues mainly in the central gas disk (“minispiral,” § 3.1).
If our conclusion is correct that over the past 0.02 – 0.20 Myr the nuclear activity has declined from a Seyfert-like level by at least three orders of magnitude (§ 4.4), then it must have fluctuated by comparable amounts over the past 200+ Myr. Otherwise, we would be privileged to observe NGC 7252 just at the moment when its previous, approximately steady Seyfert-like activity suddenly declined; this seems highly unlikely. Hence, we conclude that the [O III] nebula must be witness to some sputtering late AGN activity with surprisingly large luminosity amplitudes () in NGC 7252.
Yet, even at the present time the central gas disk contains of molecular gas (Dupraz et al., 1990; Wang et al., 1992), and the tidal tails and loop contain another of H I (Hibbard et al., 1994). Hence, if the nucleus reached much higher, QSO-like levels of activity in the past—as might be expected around or shortly after the time of nuclear coalescence—then these hypothetical high levels of nuclear activity have failed to rid the remnant of its gas, both in the central disk and in the tidal tails and W Loop. This sobering fact should temper any theoretical assumptions that gas-rich major mergers and their ensuing nuclear activity necessarily clean the remnant galaxies to a “red-and-dead” state.
4.6. Remaining Questions and Suggested Further Work
There are some obvious questions concerning the [O III] nebula that we haven’t addressed so far. Perhaps most important among them are: (1) Why does the [O III] nebula extend only over 10 kpc in projection if really it forms part of a much longer stream of tidal-tail gas falling back into the merger remnant? And (2), what causes the striking filaments (“streamers,” Fig. 1 and § 3.1) in the [O III] nebula that seem to extend from the bright ridge of [O III] 5007 emission to the SSE?
In answer to the first question, it is tempting to speculate that ionizing radiation may escape—or have escaped—from the nucleus of NGC 7252 in a cone-shaped volume, perhaps constrained by some central torus of dense circum-nuclear gas, as is often the case in Seyfert galaxies. If so, the [O III] nebula simply marks the intersection of this cone-shaped volume with the eastern gaseous tidal tail.
Alternative explanations cannot, however, be clearly ruled out. A detailed comparison of the [O III] and images of the [O III] nebula (Fig. 1c – f ) with Fig. 7 of Hibbard et al. (1994) shows that the westernmost “streamer” of the [O III] nebula coincides closely with a steep drop in the H I surface mass density, marked also by a strong H I velocity gradient. It is conceivable that a so far undetected plasma jet from the nucleus is ablating the H I, which might explain the limited extent of the nebula, or that an already more centrally-wrapped stream of gas is slamming into the tidal-tail H I stream and shock-ionizing it. Our strongest arguments against both possibilities have been provided by (i) the narrow velocity widths of most nebular emission lines (§ 3.3.1), (ii) the low temperature of the nebula (§ 4.1), and (iii) the apparent continuity in line-of-sight velocities along the tidal-tail stream and nebula (§ 3.4, esp. Fig. 6). Yet, the presence of some unexplained broader line wings near the base of especially the [N II] 6548, 6583 lines (Fig. 4c) may indicate increased turbulence in at least part of the gas of the nebula. Spectral mapping of the entire [O III] nebula with an IFU spectrograph at a high signal-to-noise ratio (much higher than that of our MagE spectrum) will be required to address this issue.
Such mapping might also help address our question about the nature and origin of the striking filaments. It would yield valuable quantitative information concerning the density and excitation variations present across the [O III] nebula and filaments. A visual intercomparison of Figs. 1e and 1f suggests that the excitation () of the easternmost filament is significantly lower than that of the westernmost filament (§ 3.1), a fact remaining to be explained. Perhaps the most interesting feature of the filaments is their projected geometry: they seem to run more nearly perpendicular to any radius drawn from the nucleus than parallel (Fig. 1c – f). This geometry would seem to argue against the filaments being minor gas streams flowing away from the nucleus (driven, e.g., by a hypothetical jet) or falling toward it. Rather, they may represent either density variations in the gas or—perhaps—fine structure in the ionization echo indicative of temporal variations in the central ionizing radiation. The above-mentioned spectral mapping seems then to be a necessary first step toward a better understanding of their nature and origin.
A third interesting question is whether there is any likely connection between the presence of the [O III] nebula and the presence of the string of H II regions further downstream in the W Loop (Fig. 6 and §§ 3.1, 3.4). Such a connection could, e.g., be created by any mechanism that currently excites the [O III] nebula and whose direction remains fixed over a prolonged period. If so, could the same mechanism have compressed the gas from which the string of H II regions has formed? The answer is very likely negative, as the following simple estimate shows. The projected distance from the center of the [O III] nebula to the approximate center of the five H II regions is about kpc. The tidal-tail gas near H II(S101) moves with km s-1 (§ 3.4) which, according to the best model simulations of NGC 7252 (Hibbard & Mihos, 1995; Chien & Barnes, 2010), must be close to the fallback velocity within the E tail. Traversing the above projected distance at this velocity takes about 35 Myr, or easily 5 – 10 the age of a giant H II region excited by O stars. Since the true distance between the [O III] nebula and the H II regions is probably considerably larger than the projected 8 kpc, the collapse of the tail gas hypothetically triggered by exposure to the same mechanism that presently excites the [O III] nebula would have taken an order of magnitude longer than the age of the H II regions. This seems unlikely, though not necessarily impossible.
Alternatively, however, either a directional change of some hypothetical jet or a past more isotropic event could have—in principle—both cleared the path to the [O III] nebula and caused the formation of the H II regions by compressing the gas there and inducing star formation. Such complex phenomena are observed in, e.g., the NE radio lobe of NGC 5128 (Blanco et al., 1975; Graham & Price, 1981; Morganti et al., 1991; Oosterloo & Morganti, 2005).
In order to better understand these various issues, improved model simulations of the merger that occurred in NGC 7252 will clearly be at least as important as new observations. Figuring out the true spatial geometry of the ionized gas in this nearby merger remnant holds great promise, since it will help pin down the time delays involved in the ionization history. However, it will take major new modeling efforts with improved gas hydrodynamics to fully realize this promise.
5. SUMMARY
We have described imaging and spectroscopic observations of a newly discovered extended emission-line nebulosity in NGC 7252, dubbed the ‘[O III] nebula.’ The observations, made at Las Campanas Observatory, consist of broad- and narrow-band images obtained with the du Pont 2.5 m telescope and follow-up long-slit spectra obtained with the LDSS-3 and MagE spectrographs at the Clay 6.5 m telescope. The discovery of this 10 kpc-sized nebula is of interest because it seems to yield the first sign ever of episodic AGN activity still occurring in this prototypical merger remnant, about 220 Myr after the coalescence of the two nuclei of the participant spiral galaxies.
The main conclusions from our observations and analysis concerning this [O III] nebula and the remnant’s nuclear activity are as follows.
1. The [O III] nebula lies about 4 kpc west and 3.6 kpc south (brightest part) of the nucleus and covers a projected area of kpc2 () in the E-W and N-S directions. Its main bright ridge appears approximately aligned with the E tidal tail, which is known to pass behind the main body of the remnant, and the southern leg of the W Loop. Several long faint filaments emerge from this ridge in the SSE direction. Line-of-sight velocities measured across the nebula show a smooth velocity gradient that seems to fit in with H I velocities in the E tail and W Loop, suggesting that the nebula belongs to the stream of tidal-tail material falling back into the remnant.
2. The UV–optical spectrum of the bright ridge recorded at a resolution of with the MagE spectrograph shows—besides the dominant [O III] and [O II] doublets—the Balmer recombination lines – , the usual collisionally-excited doublets of [N II] and [S II], and the relatively high-excitation lines of [Ne III] 3868 and He II 4686. The latter requires full ionization of helium and, hence, an ionization source rich in photons of energy eV. The lines are generally narrow, with a FWHM of km s-1 that corresponds to a mean velocity dispersion in the ionized gas of km s-1, or roughly the sound speed at K.
3. The mean electron density, temperature, and internal extinction of the nebula are all low. We measure an electron density of – cm-3—with likely values mostly 10 cm-3—in the bright ridge covered by the MagE slit, and find an upper limit of cm-3 along the entire 10 kpc slice of the nebula covered by the LDSS-3 slit. In agreement with these low densities, the internal visual extinction determined from the Balmer-line decrement is also low, mag. Given the high nebular excitation inferred from the flux ratio , our upper limit for the electron temperature, K, is surprisingly low. Finally, at the distance of 66.2 Mpc adopted for NGC 7252 the integrated luminosity of the nebula is erg s-1 in the strongest [O III] line and erg s-1 in the strongest Balmer line.
4. In three standard diagnostic diagrams, the line ratios measured for the [O III] nebula place it clearly in the domain of Seyfert galaxies and well away from the dividing line between Seyferts and LINERS. Several arguments suggest that the nebula is most likely photoionized by a central source in NGC 7252 with a power-law spectrum. The alternative possibility that the nebula might be excited by high-velocity shocks of km s-1, necessary to explain its measured high excitation, seems unlikely because of the low nebular temperature (8900 K) and internal velocity dispersion (9.6 km s-1). A comparison with photoionization models in the literature then suggests a subsolar gas metallicity of . This rough estimate is consistent with the metallicity of that we determine for H II (S101), a 30 Doradus-like giant H II region located 8 kpc in projection downstream from the nebula. Our conclusion that the [O III] nebula is photoionized by a central power-law source in NGC 7252 is further supported by the fact that in the above-mentioned diagnostic diagrams it falls among a group of EELRs observed by Fu & Stockton (2009) around five quasars, where photoionization is the only viable explanation.
5. Yet, an observational and literature search for AGN activity in NGC 7252—from X-rays through the UV–optical to near-IR, mid-IR, and radio wavelengths—fails to yield any significant detection. Although vigorous star formation occurs in the central gas disk of 1.6 kpc radius at the rate of 6.3 yr-1, the nucleus itself appears presently inactive. The perhaps most stringent upper limit for any AGN activity is set by X-ray observations of NGC 7252, from which we estimate an upper luminosity limit of erg s-1 for the nucleus. This upper limit is three orders of magnitude lower than the minimum nuclear ionizing luminosity of erg s-1 necessary to excite the [O III] nebula and produce its observed emission. Hence, there is a discrepancy of at least between the ionizing luminosity that the nebula was exposed to when it emitted the photons recorded on our images and spectra, and the low luminosity of the presently observed nucleus.
6. Assessing all available evidence, we conclude that the [O III] nebula of n7252 is most likely a faint ionization echo. It shows clear signs of being excited by a mildly active nucleus, yet the ionizing luminosity of this nucleus has declined by at least three orders of magnitude over the past 20,000 – 200,000 years. In many ways this nebula resembles the prototypical ‘Hanny’s Voorwerp,’ a bright likely ionization echo recently discovered near the still weakly active galaxy IC 2497; but in NGC 7252 its size is 3 smaller and its [O III] luminosity 100 lower. We propose that it should be classified as an EELR (extended emission-line region) despite falling well short of the minimum line luminosity of erg s-1 often adopted in the definition of EELRs. If so, the [O III] nebula is the lowest-luminosity ionization echo and EELR discovered so far, indicative of recent, probably sputtering AGN activity of Seyfert-like intensity in NGC 7252. It is the first sign of any AGN activity found in this merger remnant, occurring about 640 Myr after the merger of two gas-rich disk galaxies began and 220 Myr after the two nuclei coalesced. Its proximity and the rich multi-wavelength data—including detailed gas kinematics—available for NGC 7252 hold great promise for further study of black-hole feeding and feedback. This promise should encourage new model simulations—with improved hydrodynamics—of this intriguing merger remnant and its gaseous contents.
References
- Allen et al. (2008) Allen, M. G., Groves, B. A., Dopita, M. A., Sutherland, R. S., & Kewley, L. J. 2008, ApJS, 178, 20
- Allington-Smith et al. (1994) Allington-Smith, J., Breare, M., Ellis, R., et al. 1994, PASP, 106, 983
- Asplund et al. (2009) Asplund, M., Grevesse, N., Sauval, A. J., & Scott, P. 2009, ARA&A, 47, 481
- Awaki et al. (2002) Awaki, H., Matsumoto, H., & Tomida, H. 2002, ApJ, 567, 892
- Baldwin et al. (1981) Baldwin, J. A., Phillips, M. M., & Terlevich, R. 1981, PASP, 93, 5
- Barnes & Hernquist (1992) Barnes, J. E., & Hernquist, L. 1992, ARA&A, 30, 705
- Barnes & Hernquist (1996) Barnes, J. E., & Hernquist, L. 1996, ApJ, 471, 115
- Bastian et al. (2013) Bastian, N., Schweizer, F., Goudfrooij, P., Larsen, S. S., & Kissler-Patig, M. 2013, MNRAS, 431, 1252
- Baumgartner et al. (2013) Baumgartner, W. H., Tueller, J., Markwardt, C. B., et al. 2013, ApJS, in press (arXiv:1212.3336v1)
- Bennert (2005) Bennert, N. 2005, Ph. D. thesis, Ruhr–Universität Bochum
- Binette & Robinson (1987) Binette, L., & Robinson, A. 1987, A&A, 177, 11
- Blanco et al. (1975) Blanco, V. M., Graham, J. A., Lasker, B. M., & Osmer, P. S. 1975, ApJ, 198, L63
- Borne & Richstone (1991) Borne, K. D., & Richstone, D. O. 1991, ApJ, 369, 111
- Brandl et al. (2006) Brandl, B. R., Bernard-Salas, J., Spoon, H. W. W., et al. 2006, ApJ, 653, 1129
- Bruzual & Charlot (2003) Bruzual A., G., & Charlot, S. 2003, MNRAS, 344, 1000
- Canalizo & Stockton (2001) Canalizo, G., & Stockton, A. 2001, ApJ, 555, 719
- Cardelli et al. (1989) Cardelli, J. A., Clayton, G. C., & Mathis, J. S. 1989, ApJ, 345, 245
- Chien & Barnes (2010) Chien, L.-H., & Barnes, J. E. 2010, MNRAS, 407, 43
- Cutri et al. (2012) Cutri, R. M., et al. 2012, Explanatory Supplement to the WISE All-sky Data Release Products, http://wise2.ipac.caltech.edu/docs/release/allsky/expsup/
- Dekel & Birnboim (2006) Dekel, A., & Birnboim, Y. 2006, MNRAS, 368, 2
- de Vaucouleurs et al. (1991) de Vaucouleurs, G., de Vaucouleurs, A., Corwin, H. G., et al. 1991, Third Reference Catalogue of Bright Galaxies (Berlin: Springer)
- Dupraz et al. (1990) Dupraz, C., Casoli, F., Combes, F., & Kazès, I. 1990, A&A, 228, L5
- Ferrarese & Merritt (2000) Ferrarese, L., & Merritt, D. 2000, ApJ, 539, L9
- Freedman & Madore (2010) Freedman, W. L., & Madore, B. F. 2010, ARA&A, 48, 673
- Frenk & White (2012) Frenk, C. S., & White, S. D. M. 2012, Ann. der Phys., 524, 507
- Fu & Stockton (2009) Fu, H., & Stockton, A. 2009, ApJ, 690, 953
- Gaskell & Ferland (1984) Gaskell, C. M., & Ferland, G. J. 1984, PASP, 96, 393
- Gebhardt et al. (2000) Gebhardt, K., Bender, R., Bower, G., et al. 2000, ApJ, 539, L13
- Graham & Price (1981) Graham, J. A., & Price, R. M. 1981, ApJ, 247, 813
- Groves et al. (2004) Groves, B. A., Dopita, M. A., & Sutherland, R. S. 2004, ApJS, 153, 9
- Halpern & Steiner (1983) Halpern, J. P., & Steiner, J. E. 1983, ApJ, 269, L37
- Heckman et al. (1990) Heckman, T. M., Armus, L., & Miley, G. K. 1990, ApJS, 74, 833
- Hibbard et al. (1994) Hibbard, J. E., Guhathakurta, P., van Gorkom, J. H., & Schweizer, F. 1994, AJ, 107, 67
- Hibbard & Mihos (1995) Hibbard, J. E., & Mihos, J. C. 1995, AJ, 110, 140
- Hibbard & van Gorkom (1996) Hibbard, J. E., & van Gorkom, J. H. 1996, AJ, 111, 655
- Ho & Ulvestad (2001) Ho, L. C., & Ulvestad, J. S. 2001, ApJS, 133, 77
- Hopkins (2012) Hopkins, P. F. 2012, MNRAS, 420, L8
- Hopkins et al. (2013) Hopkins, P. F., Cox, T. J., Hernquist, L., et al. 2013, MNRAS, 430, 1901
- Hopkins et al. (2006) Hopkins, P. F., Hernquist, L., Cox, T. J., et al. 2006, ApJS, 163, 1
- Huseman et al. (2013) Husemann, B., Wisotzki, L., Sánchez, S. F., & Jahnke, K. 2013, A&A, 549, A43
- Józsa et al. (2009) Józsa, G. I. G., Gerrett, M. A., Oosterloo, T. A., et al. 2009, A&A, 500, L33
- Katz & Gunn (1991) Katz, N., & Gunn, J. E. 1991, ApJ, 377, 365
- Kauffmann et al. (2003) Kauffmann, G., Heckman, T. M., Tremonti, C., et al. 2003, MNRAS, 346, 1055
- Keel et al. (2012a) Keel, W. C., Chojnowski, S. D., Bennert, V. N., et al. 2012a, MNRAS, 420, 878
- Keel et al. (2012b) Keel, W. C., Lintott, C. J., Schawinski, K., et al. 2012b, AJ, 144, 66
- Kelson (1998) Kelson, D. D. 1998, Ph.D. thesis, Univ. Calif., Santa Cruz
- Kelson et al. (2000) Kelson, D. D., Illingworth, G. D., van Dokkum, P. G., & Franx, M. 2000, ApJ, 531, 159
- Kennicutt (1988) Kennicutt, R. C. 1988, ApJ, 334, 144
- Kennicutt & Evans (2012) Kennicutt, R. C., & Evans, N. J. 2012, ARA&A, 50, 531
- Keres et al. (2005) Keres, D, Katz, N., Weinberg, D. H., & Davé, R. 2005, MNRAS, 363, 2
- Kewley et al. (2001) Kewley, L. J., Dopita, M. A., Sutherland, R. S., Heisler, C. A., & Trevena, J. 2001, ApJ, 556, 121
- Kewley et al. (2006) Kewley, L. J., Groves, B., Kauffmann, G., & Heckman, T. 2006, MNRAS, 372, 961
- Komossa & Schulz (1997) Komossa, S., & Schulz, H. 1997, A&A, 323, 31
- Kroupa (2001) Kroupa, P. 2001, MNRAS, 322, 231
- Laine et al. (2003) Laine, S., van der Marel, R. P., Rossa, J., et al. 2003, AJ, 126, 2717
- Landolt (1973) Landolt, A. U. 1973, AJ, 78, 959
- Landolt (1992) Landolt, A. U. 1992, AJ, 104, 340
- Lintott et al. (2009) Lintott, C. J., Schawinski, K., Keel, W., et al. 2009, MNRAS, 399, 129
- Liu & Kennicutt (1995) Liu, C. T., & Kennicutt, R. C. 1995, ApJS, 100, 325
- Magorrian et al. (1998) Magorrian, J., Tremaine, S., Richstone, D., et al. 1998, AJ, 115, 2285
- Marshall et al. (2008) Marshall, J. L., Burles, S., Thompson, I. B., et al. 2008, Proc. SPIE, 7014, 701454
- McGaugh (1991) McGaugh, S. S. 1991, ApJ, 380, 140
- McGaugh (1994) McGaugh, S. S. 1994, ApJ, 426, 135
- Mihos et al. (1993) Mihos, J. C., Bothun, G. D., & Richstone, D. O. 1993, ApJ, 418, 82
- Mihos et al. (1998) Mihos, J. C., Dubinski, J., & Hernquist, L. 1998, ApJ, 494, 183
- Mihos & Hernquist (1996) Mihos, J. C., & Hernquist, L. 1996, ApJ, 464, 641
- Miller et al. (1997) Miller, B. W., Whitmore, B. C., Schweizer, F., & Fall, M. 1997, AJ, 114, 2381
- Morgan (1995) Morgan, J. A. 1995, in ASP Conf. Ser. 77, Astronomical Data Analysis Software and Systems IV, ed. R. A. Shaw, H. E. Payne, & J. J. E. Hayes (San Francisco: ASP), 129
- Morganti et al. (1991) Morganti, R., Robinson, A., Fosbury, R. A. E., et al. 1991, MNRAS, 249, 91
- Moustakas et al. (2010) Moustakas, J., Kennicutt, R. C., Tremonti, C. A., et al. 2010, ApJS, 190, 233
- Murphy et al. (2011) Murphy, E. J., Condon, J. J., Schinnerer, E., et al. 2011, ApJ, 737, 67
- Nolan et al. (2004) Nolan, L. A., Ponman, T. J., Read, A. M., & Schweizer, F. 2004, MNRAS, 353, 221
- O’Donnell (1994) O’Donnell, J. E. 1994, ApJ, 422, 158
- Oosterloo & Morganti (2005) Oosterloo, T. A., & Morganti, R. 2005, A&A, 429, 469
- Osterbrock & Ferland (2006) Osterbrock, D. E., & Ferland, G. J. 2006, Astrophysics of Gaseous Nebulae and Active Galactic Nuclei (2nd ed.; Sausalito, CA: Univ. Science Books)
- Pilyugin & Mattsson (2011) Pilyugin, L. S., & Mattsson, L. 2011, MNRAS, 412, 1145
- Rampadarath et al. (2010) Rampadarath, H., Garrett, M. A., Józsa, G. I. G., et al. 2010, A&A, 517, L8
- Ranalli et al. (2003) Ranalli, P., Comastri, A., & Setti, G. 2003, A&A, 399, 39
- Rees & Ostriker (1977) Rees, M. J., & Ostriker, J. P. 1977, MNRAS, 179, 541
- Rossa et al. (2007) Rossa, J., Laine, S., van der Marel, R. P., et al. 2007, AJ, 134, 2124
- Sanders & Mirabel (1996) Sanders, D. B., & Mirabel, I. F. 1996, ARA&A, 34, 749
- Schawinski et al. (2010) Schawinski, K., Evans, D. A., Virani, S., et al. 2010, ApJ, 724, L30
- Schawinski et al. (2007) Schawinski, K., Thomas, D., Sarzi, M., et al. 2007, MNRAS, 382, 1415
- Schlegel et al. (1998) Schlegel, D. J., Finkbeiner, D. P., & Davis, M. 1998, ApJ, 500, 525
- Schweizer (1982) Schweizer, F. 1982, ApJ, 252, 455
- Schweizer (1990) Schweizer, F. 1990, in Dynamics and Interactions of Galaxies, ed. R. Wielen (Berlin: Springer), 60
- Schweizer (1998) Schweizer, F. 1998, in Galaxies: Interactions and Induced Star Formation, ed. D. Friedli, L. Martinet, & D. Pfenniger (Berlin: Springer), 105
- Schweizer & Seitzer (1998) Schweizer, F., & Seitzer, P. 1998, AJ, 116, 2206
- Searle (1971) Searle, L. 1971, ApJ, 168, 327
- Spitzer (1978) Spitzer, L. 1978, Physical Processes in the Interstellar Medium (New York: Wiley), 227
- Stern et al. (2012) Stern, D., Assef, R. J., Benford, D. J., et al. 2012, ApJ, 753, 30
- Stockton et al. (2006) Stockton, A., Fu, H., & Canalizo, G. 2006, New A Rev., 50, 694
- Stockton & MacKenty (1983) Stockton, A., & MacKenty, J. W. 1983, Nature, 305, 678
- Stockton & MacKenty (1987) Stockton, A., & MacKenty, J. W. 1987, ApJ, 316, 584
- Sturm et al. (2011) Sturm, E., González-Alfonso, E., Veilleux, S., et al. 2011, ApJ, 733, L16
- Toomre & Toomre (1972) Toomre, A., & Toomre, J. 1972, ApJ, 178, 623
- Toomre (1977) Toomre, A. 1977, in The Evolution of Galaxies and Stellar Populations, ed. B. M. Tinsley & R. B. Larson (New Haven: Yale Univ. Observatory), 401
- Veilleux et al. (2005) Veilleux, S., Cecil, G., & Bland-Hawthorn, J. 2005, ARA&A, 43, 769
- Veilleux & Osterbrock (1987) Veilleux, S., & Osterbrock, D. E. 1987, ApJS, 63, 295
- Wang et al. (1992) Wang, Z., Schweizer, F., & Scoville, N. Z. 1992, ApJ, 396, 510
- White & Rees (1978) White, S. D. M., & Rees, M. J. 1978, MNRAS, 183, 341
- Whitmore et al. (1993) Whitmore, B. C., Schweizer, F., Leitherer, C., Borne, K., & Robert, C. 1993, AJ, 106, 1354
- Wild et al. (2010) Wild, V., Heckman, T., & Charlot, S. 2010, MNRAS, 405, 933
- Wright et al. (2010) Wright, E. L., Eisenhardt, P. R. M., Mainzer, A. K., et al. 2010, AJ, 140, 1868
- Zanstra (1927) Zanstra, H. 1927, ApJ, 65, 50
| Total | Wavelength | ||||||||
|---|---|---|---|---|---|---|---|---|---|
| CCD | P.A. | Expos. | Coverage | Seeing | |||||
| Date | Telescope | InstrumentaaDC = Direct camera; LDSS-3 = Low-Dispersion Survey Spectrograph 3; MagE = Magellan Echellette Spectrograph. | Detector | Filter | (deg) | (s) | (Å) | (arcsec) | Notes |
| 2000 Sep 27 …. | du Pont 2.5 m | DC | Tek #5 | [O III] | 1.2 | 15300 | 5071–5102 | 0.9 | |
| BluCont | 1.2 | 2520 | 5180–5495 | 1.0 | |||||
| 2000 Sep 28 …. | du Pont 2.5 m | DC | Tek #5 | H | 1.2 | 12300 | 6651–6702 | 0.8 | |
| RedCont | 1.2 | 900 | 6450–7145 | 0.7 | |||||
| 2000 Sep 29 …. | du Pont 2.5 m | DC | Tek #5 | 1.2 | 4800 | 3850–4850 | 0.7 | ||
| 1.2 | 2520 | 4900–5800 | 0.8 | ||||||
| 2000 Sep 30 …. | du Pont 2.5 m | DC | Tek #5 | [S II] | 1.2 | 5400 | 6787–6865 | 0.7 | |
| RedCont | 1.2 | 900 | 6450–7145 | 0.6 | |||||
| 2007 Sep 5 …… | Clay 6.5 m | LDSS-3 | STA0500A | 103.3 | 7200 | 3850–6590 | 0.7 | Slit | |
| 2007 Sep 5–6 .. | Clay 6.5 m | LDSS-3 | STA0500A | OG 590 | 103.3 | 12600 | 6070–10760 | 0.5–0.8 | Slit |
| 2007 Sep 6 …… | Clay 6.5 m | LDSS-3 | STA0500A | 103.3 | 7200 | 3850–6590 | 0.6–1.0 | Slits (4) | |
| 2009 Aug 23 … | Clay 6.5 m | MagE | E2V 42-20 | 103.3 | 9000 | 3300–8250 | 0.7 | Slit |
| Flux aaMeasured through aperture of centered on Cluster S101, corresponding to a projected area of kpc2 at the distance of NGC 7252. | |||||
|---|---|---|---|---|---|
| Line/Ion | (Å) | ( erg cm-2 s-1) | bbRatio of fluxes corrected for Milky Way foreground extinction of . | ccRatio of fluxes corrected for total extinction (Milky Way plus internal) of . | |
| 4101 | |||||
| 4340 | |||||
| [O III] | 4363 | ||||
| ddReddening-corrected flux within aperture is erg cm-2 s-1. | 4861 | ||||
| [O III] | 4959 | ||||
| [O III] | 5007 | ||||
| He I | 5876 | ||||
| [O I] | 6300 | ||||
| [N II] | 6548 | ||||
| eeReddening-corrected flux within aperture is erg cm-2 s-1, with corresponding luminosity of erg s-1. | 6563 | ||||
| [N II] | 6583 | ||||
| [S II] | 6716 | ||||
| [S II] | 6731 |
| Flux aaMeasured with MagE spectrograph through aperture of centered on brightest part of Nebula, corresponding to a projected area of kpc2 at the distance of NGC 7252. | |||||
|---|---|---|---|---|---|
| Line/Ion | (Å) | ( erg cm-2 s-1) | bbRatio of fluxes corrected for Milky Way foreground extinction of . | ccRatio of fluxes corrected for total extinction (Milky Way plus internal) of . | |
| [Ne V] | 3426 | ||||
| [O II] | 3726 | ||||
| [O II] | 3729 | ||||
| [Ne III] | 3868 | ||||
| 4101 | |||||
| 4340 | |||||
| [O III] | 4363 | ||||
| He II | 4686 | ||||
| ddReddening-corrected flux within aperture is erg cm-2 s-1. | 4861 | ||||
| [O III] | 4959 | ||||
| [O III] | 5007 | ||||
| [N II] | 5755 | ||||
| He I | 5876 | ||||
| [O I] | 6300 | ||||
| [N II] | 6548 | ||||
| eeReddening-corrected flux within aperture is erg cm-2 s-1, with corresponding luminosity of erg s-1. | 6563 | ||||
| [N II] | 6583 | ||||
| [S II] | 6716 | ||||
| [S II] | 6731 |
| aaRatio of fluxes corrected for Milky Way foreground extinction of . | bbApparent luminosity, corrected only for Milky Way foreground (but not internal) extinction. ( erg s-1) | ||||||||
|---|---|---|---|---|---|---|---|---|---|
| Line/Ion | NucleusccMeasured with MagE spectrograph through aperture of ( pc2). | Gas DiskddIntegrated within simulated ring-shaped aperture of radius – 4″ = 0.16 – 1.28 kpc. | [O III] NebulaeeMeasured in brightest part of nebula with MagE (see Footnote a in Table 3). | Nucleus | Gas Disk | [O III] NebulaffApparent luminosity is for entire nebula. | |||
| [O II] | 3727 | ggEstimated from (H) and line ratio measured in MagE slit. | |||||||
| 4861 | ggEstimated from (H) and line ratio measured in MagE slit. | ||||||||
| [O III] | 5007 | ||||||||
| 6563 | |||||||||
| NGC 7252 | IC 2497 | ||||
|---|---|---|---|---|---|
| Parameter | Symbol | [O III] Nebula | Hanny’s VoorwerpaaData taken from Lintott et al. (2009), Schawinski et al. (2010), and Keel et al. (2012b). | Units | |
| Galaxy: | |||||
| Heliocentric velocity | 4749 | 15,056 | km s-1 | ||
| Distance | 66.2 | 220 | Mpc | ||
| Emission-line nebula: | |||||
| Projected size | kpc | ||||
| Projected distancebbFrom nucleus to brightest part of nebula. | 5.4 | 24 | kpc | ||
| Velocity rangeccLine-of-sight velocities relative to galaxy nucleus. | 50 to 200 | 220 to 300 | km s-1 | ||
| [O III] luminosity | erg s-1 | ||||
| luminosity | erg s-1 | ||||
| Excitation ratio | |||||
| Electron density | cm-3 | ||||
| Electron temperature | K | ||||
| Metallicity | |||||
| Ionization parameter (log) | |||||
| Nucleus: | |||||
| Past ionizing luminosityddInferred from flux of [O III] nebula (see § 4.3). | (2–7) | erg s-1 | |||
| Present X-ray luminosity | erg s-1 | ||||
| Decline timeeeTime since the most recent enhanced AGN activity, still seen by nebula, ceased. | 20 – 200 | 40 – 230 | kyr |