The Chemical Imprint of Silicate Dust on the Most Metal-Poor Stars
Abstract
We investigate the impact of dust-induced gas fragmentation on the formation of the first low-mass, metal-poor stars () in the early universe. Previous work has shown the existence of a critical dust-to-gas ratio, below which dust thermal cooling cannot cause gas fragmentation. Assuming the first dust is silicon-based, we compute critical dust-to-gas ratios and associated critical silicon abundances (). At the density and temperature associated with protostellar disks, we find that a standard Milky Way grain size distribution gives , while smaller grain sizes created in a supernova reverse shock give . Other environments are not dense enough to be influenced by dust cooling. We test the silicate dust cooling theory by comparing to silicon abundances observed in the most iron-poor stars (). Several stars have silicon abundances low enough to rule out dust-induced gas fragmentation with a standard grain size distribution. Moreover, two of these stars have such low silicon abundances that even dust with a shocked grain size distribution cannot explain their formation. Adding small amounts of carbon dust does not significantly change these conclusions. Additionally, we find that these stars exhibit either high carbon with low silicon abundances or the reverse. A silicate dust scenario thus suggests that the earliest low-mass star formation in the most metal-poor regime may have proceeded through two distinct cooling pathways: fine structure line cooling and dust cooling. This naturally explains both the carbon-rich and carbon-normal stars at extremely low [Fe/H].
Subject headings:
cosmology: early universe — stars: abundances, formation, Population II1. Introduction
The formation of the first stars marks the beginnings of structure formation, cosmic reionization, and chemical enrichment (e.g., Bromm et al. 2009 and references within). These so-called Population III stars formed out of metal-free primordial gas at the centers of dark matter minihalos (Couchman & Rees, 1986; Haiman et al., 1996; Tegmark et al., 1997; Yoshida et al., 2003). Due to relatively weak feedback and inefficient cooling, they had high characteristic masses of order at least tens of solar masses and therefore short life spans (e.g., Abel et al. 2002; Bromm et al. 2002; Stacy et al. 2010, 2012; Greif et al. 2011; Hosokawa et al. 2011).
Although the short lives of Population III stars implies that they cannot be directly observed anymore, it is believed that the metals released in their supernovae trigger a transition from predominantly high mass star formation to a low mass mode (Bromm et al., 2001; Schneider et al., 2002). The chemical abundances of low-mass, metal-poor Population II stars in the Milky Way stellar halo have been interpreted as traces of the Population III star era (e.g., Beers & Christlieb 2005, Frebel & Norris 2013). If this is indeed the case, then an understanding of the formation process for Population II stars is one way to probe the epoch of the first stars (Tumlinson, 2006; Karlsson et al., 2013).
However, unlike the formation of Population III stars, whose gas properties and formation environments are relatively well-understood, the conditions for Population II star formation are quite uncertain (e.g., Bromm 2013). Introducing even trace amounts of metals significantly affects the thermal behavior of collapsing gas clouds (e.g., Omukai et al. 2005). There are also many possible candidate environments that might be the formation sites of these stars, ranging from the atomic cooling halos of the first protogalaxies (e.g., Wise & Abel 2007; Greif et al. 2008, 2010) to post-supernova shock regions (e.g., Salvaterra et al. 2004; Chiaki et al. 2013b). The two main theories for how metals cause low mass star formation are gas cooling through atomic fine structure lines (Bromm & Loeb, 2003; Santoro & Shull, 2006) and gas fragmentation induced by dust continuum radiation (e.g., Schneider et al. 2006; Omukai et al. 2010). We will refer to these as “fine structure cooling” and “dust cooling”, respectively.
Fine structure cooling argues that in the absence of sufficient atomic metal line cooling, gas clouds cannot quickly collapse beyond a “loitering state” of cm-3 and K (Bromm et al., 2002). The presence of molecular hydrogen may smooth out this metallicity threshold (e.g., Jappsen et al. 2009a, b), but only if there is no soft UV Lyman-Werner (LW) background produced by the first stars, capable of destroying molecular hydrogen (Bromm et al., 2001; Safranek-Shrader et al., 2010). Arguably, the presence of such a LW background is natural, as the same stars that produced the first heavy elements would also emit LW radiation; thus, the fine-structure threshold is clearly imprinted, without H2 cooling smoothing it out. If the gas metallicity is above a critical metallicity of , the gas is unstable to vigorous fragmentation (e.g., Santoro & Shull 2006; Smith et al. 2009). The most important atomic species are carbon and oxygen (Bromm & Loeb, 2003), so the theory predicts enhancements in these elements. If correct, this is a natural explanation for the measured carbon enhancement in many metal-poor stars (Frebel et al., 2007). However, the Jeans mass of gas fragments formed by just fine structure cooling is , which is too massive for a star formed early in the universe to survive until the present day (Klessen et al., 2012).
In contrast, dust cooling easily causes gas fragmentation at Jeans masses of because it becomes efficient only at high gas densities and temperatures around cm-3 and K. The critical metallicity required for dust cooling to cause fragmentation is also much lower at (Omukai et al., 2005; Tsuribe & Omukai, 2006; Schneider et al., 2006; Clark et al., 2008; Omukai et al., 2010; Schneider et al., 2012a; Dopcke et al., 2013). This dust must have been formed in early supernovae (Gall et al., 2011). Many dust models have been produced which turn supernova yields into dust masses (e.g., Todini & Ferrara 2001; Nozawa et al. 2003; Schneider et al. 2004; Bianchi & Schneider 2007). Most of these models assume steady-state chemistry and use classical nucleation theory to calculate dust yields. These approximations may not applicable in a supernova outflow environment (Donn & Nuth, 1985; Cherchneff & Lilly, 2008; Cherchneff & Dwek, 2009, 2010), although see Paquette & Nuth (2011) and Nozawa & Kozasa (2013). Furthermore, significant amounts of dust can also be destroyed in supernova reverse shocks (Silvia et al., 2010).
The large difference in the critical metallicity between these two cooling mechanisms has sparked some debate about which one is most relevant for the formation of low-mass metal-poor stars. This can be observationally tested, as the relevant cooling mechanisms should leave an imprint on the observed chemical abundances. Frebel et al. (2007) observationally tested the fine structure cooling theory by introducing the transition discriminant . They predicted that metal-poor stars forming through this mechanism must have . Nearly all stars satisfy this criterion (see Frebel & Norris 2013 for an updated figure). The only star known to violate the criterion is SDSS J1029151+1729 (Caffau et al., 2011). Schneider et al. (2012b) and Klessen et al. (2012) showed that dust cooling was instead able to explain the formation of this star. More generally, Schneider et al. (2012a) calculate a critical dust-to-gas ratio () that could in principle place an observational restriction on dust cooling, similar to the restriction on fine structure cooling. However, for metal-poor stars besides SDSS J1029151+1729, the impact of dust cooling has not been evaluated in detail.
Ideally, there would be general properties of supernova dust that could be tested with observations of abundances in metal-poor stars. Recently, Cherchneff & Dwek (2010) have shown that when accounting for non-equilibrium chemical kinetics in dust formation, dust yields are significantly lower and dominated by silicon-based grains, rather than the carbon grains that are typical results of most steady-state models. There is some debate about the extent to which carbon dust formation is suppressed (e.g., Nozawa & Kozasa 2013). However, if indeed carbon dust formation is generally suppressed in the early universe, the silicon abundance of metal-poor stars could be used as an observational constraint on dust cooling processes.
In this paper, we investigate the impact that silicon-based dust could have had on the formation process of the first low-mass stars. Using the silicon-based dust compositions from Cherchneff & Dwek (2010), we compute critical silicon abundances and compare them to observations of chemical abundances in long-lived metal-poor stars. In Section 2, we describe the dust models used for this paper. In Section 3, we calculate critical silicon abundances for our dust models, assessing how differences in chemistry, grain size distribution, and environment affect this critical threshold. Our main results are found in Section 4, where we compare our critical silicon abundances to measurements of metal-poor stars. Section 5 considers evidence for two distinct formation pathways of low-mass metal-poor stars, and Section 6 discusses the potential for Damped Lyman- systems to help constrain the star formation environments. After outlining important caveats in Section 7 (particularly related to the production of carbon dust), we conclude in Section 8.
2. Dust Models
We first present the dust models used in this paper in Section 2.1. We then discuss some processes in these dust models which strongly inhibit carbon dust formation in Section 2.2.
2.1. Dust Chemical Composition and Size Distributions
We use the eight different silicon-based dust chemistries presented in Cherchneff & Dwek (2010). We assume these are representative of typical dust yields in the early universe. The dust masses are given in Table 1. Although the eight different models represent different assumptions about the nature of the supernovae and the dust condensation process, we simply take them as plausible variations in the chemical composition of dust. The dominant dust species are SiO2, Mg2SiO4, amorphous Si, and FeS.
For our calculations in Section 3.1, we require a dust grain size distribution. However, Cherchneff & Dwek (2010) do not compute grain size distributions for their dust models. We thus consider two simple but well-motivated grain size distributions. The first is a Pollack et al. (1994) “standard” size distribution. This was used in Omukai et al. (2010), and it is similar to the Milky Way grain size distribution used in Dopcke et al. (2013). For spherical dust grains of radius :
| (1) |
We also consider a grain size distribution that approximates the effect of running a post-supernova reverse shock through newly created dust, based on the size distributions calculated in Bianchi & Schneider (2007):
| (2) |
From now on, we will refer to these two grain size distributions as the “standard” and “shock” size distributions. For simplicity, we assume that each type of dust grain has the same grain size distribution, though it may also be possible to calculate a good approximation to the grain size distribution using classical nucleation theory (Paquette & Nuth, 2011). We normalize the size distributions to number of particles per unit dust mass (cm-1 g-1) by using the amount of dust mass formed and the solid-phase chemical density of each type of dust (Semenov et al., 2003; Patnaik, 2003).
2.2. Silicate or Carbon Dust?
We use the Cherchneff & Dwek (2010) dust models to establish a critical silicon criterion (Section 3.3). Thus, our results crucially depend on the assumption that the dust composition is largely silicon-based. The most significant non-silicate dust is typically amorphous carbon. We thus briefly describe why carbon dust formation is almost completely inhibited in these models. We refer the reader to Cherchneff & Dwek (2009, 2010) for a more extensive discussion.
The chemical mechanisms that inhibit carbon dust formation depend on the C/O ratio in the supernova ejecta. When the C/O ratio is less than one, CO formation rapidly depletes the available carbon. Although there are processes that can destroy this supply of CO and form short carbon chains, subsequent oxidation of these chains inhibits dust formation. This effect is seen despite accounting for non-thermal processes such as the destruction of CO through high energy Compton electrons (Cherchneff & Dwek, 2010). When the C/O ratio is greater than one, small carbon clusters can form but are rapidly destroyed by the He+ ions that accompany large amounts of carbon.
In radial distributions of supernova ejecta, carbon is always accompanied by large oxygen or helium abundances (e.g., Nozawa et al. 2003). However, if the supernovae ejecta is poorly mixed at a microscopic level, then carbon rich clouds may form significant amounts of carbon dust in addition to silicate dust (Cherchneff & Dwek, 2010; Nozawa & Kozasa, 2013). Thus, the suppression of carbon dust may heavily depend on the level of mixing, which itself depends on the details of the supernova explosion.
We will follow the assumption of microscopically-mixed supernova ejecta as in Cherchneff & Dwek (2010), which leads to silicate dust being the dominant form of dust in the early universe. A major motivation for investigating the consequences of silicon-based dust is that silicon abundances measured from the most metal-poor stars are comparable to the theoretical critical silicon abundances we derive in Section 3.3, thus offering an empirical test of this important assumption. For completeness, in Section 7.1, we also explore the impact that the formation of carbon dust would have on our results.
3. Critical Silicon Abundance for Gas Fragmentation
In this section, we present the method for calculating the critical silicon abundance () required for gas fragmentation. We use a simplified model that only considers dust thermal cooling and adiabatic compressional heating. Many previous papers have studied these in detail, using a more comprehensive set of cooling mechanisms that influence a large range of gas densities (e.g., Omukai 2000; Omukai et al. 2005; Schneider et al. 2006; Omukai et al. 2010; Schneider et al. 2012a). To derive the critical silicon abundance, we focus on the density regime where dust cooling dominates.
In Section 3.1 we show how we calculate the dust cooling rate for a given dust model. In Section 3.2 we use the cooling rate to calculate a critical dust-to-gas ratio (Schneider et al., 2012a), which we convert to a critical silicon abundance in Section 3.3. In Section 3.4, we discuss uncertainties in the Population II star forming environment and the implications this may have for our critical silicon abundance.
3.1. Calculating the Dust Cooling Rate
We describe how to calculate the gas cooling rate due to dust emission. This calculation closely follows the method in Schneider et al. (2006). For completeness and convenience of the reader, we here give a brief summary.
Dust grain emission is well approximated by thermal radiation (Draine & Li, 2001), in which case the cooling rate can be written
| (3) |
where is the Stefan-Boltzmann constant, is the dust temperature, is the temperature-dependent Planck mean opacity of dust grains per unit dust mass, is the dust mass density, and is the photon escape fraction. We define the dust-to-gas ratio as
| (4) |
For a given dust composition model, the Planck mean opacity is given by
| (5) |
where is the wavelength-dependent opacity in cm2 g-1 and is the Planck specific intensity. can be calculated by
| (6) |
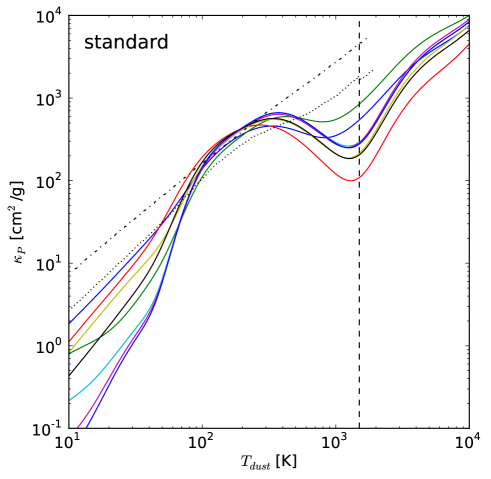
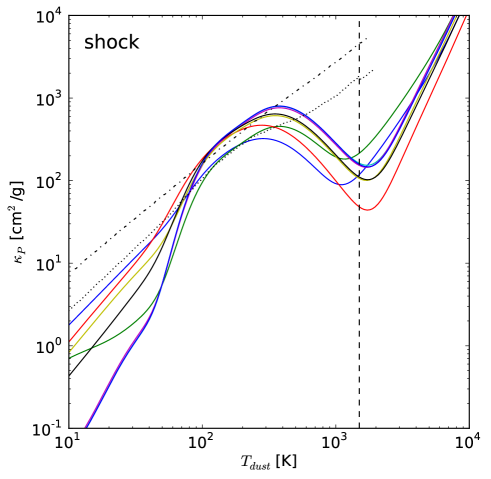
where denotes different dust species, is the mass fraction, is the area-normalized absorption cross section, and is the size distribution. We calculate using Mie theory, with optical constants taken from the sources listed in Table 1. If required, we linearly extrapolate the optical constants on a log-log basis. We plot the Planck mean opacities for all our dust models in Figure 1, and for comparison we also include the Planck mean opacities for carbon-heavy dust models in Schneider et al. (2006) and Schneider et al. (2012a).
To calculate the dust temperature, we set the dust cooling rate in Equation 3 equal to the gas-dust collisional heating rate (Hollenbach & McKee, 1979):
| (7) |
where is the number density of atomic hydrogen, is the number density of dust, is the dust geometrical cross section, is the thermal velocity of atomic hydrogen, is a correction factor for species other than atomic hydrogen, is the gas temperature, and is the dust temperature. Note that the kinetic energy per colliding gas particle is instead of because higher energy particles collide more frequently (Draine, 2011). We assume the gas has a Maxwellian velocity distribution so the average velocity of atomic hydrogen is
| (8) |
Since dust is most important at high gas densities, we assume the hydrogen in the gas is fully molecular. Then neglecting the effects of charge or sticking probabilities, we account for the differences in number density and thermal velocity by setting , where for primordial gas. We can also rewrite
| (9) |
where is the total dust geometrical cross section per unit dust mass defined by
| (10) |
and .
In general, solving Equation 7 depends on the dust-to-gas ratio because the amount of dust may influence . We assume which is suitable for radiative diffusion out of an optically thick gas (Omukai, 2000). The optical depth is given by:
| (11) |
is the continuum Planck mean opacity of primordial gas from Mayer & Duschl (2005), is the Planck mean opacity of dust calculated in this paper, and are the densities of gas and dust respectively, and is the Jeans length. The Jeans length is the typical size of a dense core of a uniformly collapsing spherical gas cloud (e.g., Larson 1969). If the gas is optically thin (), it is possible to solve for the dust temperature independently of . However for the optically thick case, dust opacity will affect the solution and cause some nonlinear dependence on .
If the dust temperature becomes too high, the dust will sublimate. Different dust grains sublimate at different temperatures. We simplify this effect by assuming all grains sublimate at K, a typical temperature for non-carbon grains (Schneider et al., 2006). We set when the dust sublimates. Also, when there is negligible dust heating from gas collisions, the cosmic microwave background (CMB) provides a temperature floor. We include this effect by modifying the dust radiation rate to (e.g., Schneider & Omukai 2010). We assume that K, corresponding to .
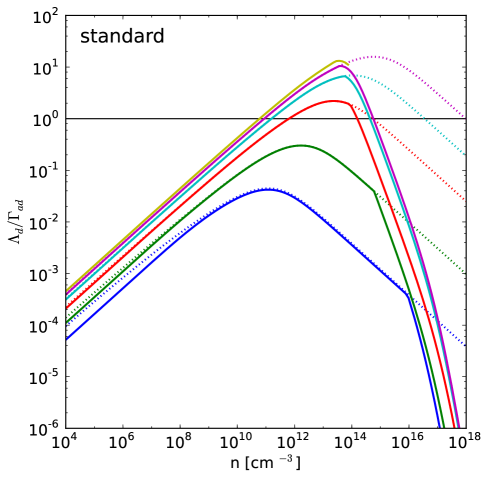
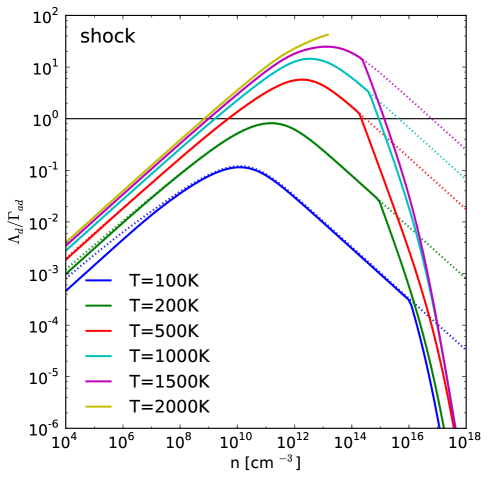
In summary, the inputs into this model are the gas properties and ; and the dust properties , , and . The output is a dust temperature with a corresponding cooling rate . In Figure 2, we show a representative calculation of using dust model 1 and . Our simple thermal model is sufficient to capture many important features of a full thermal evolution calculation (Omukai et al., 2005; Schneider et al., 2006). For example, we see that dust cooling becomes comparable to adiabatic heating at densities cm-3; the smaller grains in the shock size distribution increase gas cooling; and opacity begins to shut off dust cooling at densities cm-3. Note that the K lines terminate at cm-3 because the dust sublimates when it reaches K.
3.2. Critical Dust-to-Gas Ratio
Following Schneider et al. (2012a), we define the critical dust-to-gas ratio as the minimum mass fraction of dust that causes gas fragmentation. We solve for this in a manner similar to Bromm & Loeb (2003), by finding the dust to gas ratio such that
| (12) |
where is given by Equation 7 and is the adiabatic compressional heating rate, given by
| (13) |
where is the free fall time. Schneider et al. (2012a) show that this method of finding the dust-to-gas ratio gives a that is very close to a full calculation that accounts for other thermal effects in the gas. Also note that the value of depends on the gas density and temperature. Following Schneider et al. (2012a), we use a gas density of cm-3 and gas temperature of K as our fiducial values (but see Section 3.4).
3.3. Critical Silicon Abundance
Given a dust composition with a corresponding , we can calculate the minimum amount of silicon required for gas fragmentation. To do this, we write two expressions for the mass fraction of Si at the critical point.
The fraction of silicon in the dust is given by
| (14) |
where is the mass of silicon in the dust, is the total mass of dust, and is the critical dust-to-gas ratio. Note that and depend on the specific dust model used, and the ratios for our dust models are given in Table 1. The fraction of silicon in the gas is given by
| (15) |
where is the molecular weight of silicon (), is the molecular weight of the gas, is the number density of silicon at the critical point, and is the hydrogen number density.
We now assume that these two fractions are equal. In other words, we assume that all silicon present in the gas cloud is locked up in dust. This maximizes the amount of dust and provides the most conservative way to calculate a critical silicon threshold. Setting Equations 14 and 15 equal and rewriting them in terms of an abundance, we obtain
| (16) |
and we can find by subtracting the solar abundances from Asplund et al. (2009)111 for element X,Y. A star whose measured [Si/H] is less than thus has a sub-critical , too low to trigger dust-induced gas fragmentation.
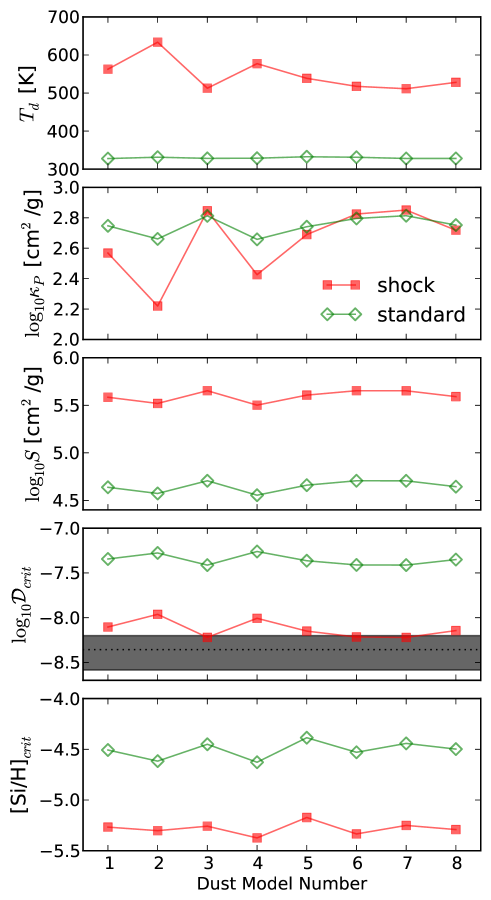
In Figure 3, we show the effect of varying the size distribution and the dust composition on the dust cooling solution at the fiducial gas density and temperature of cm-3 and K. Table 1 shows the numerical values for . The differences between chemical compositions are quite small, but changing the size distribution makes a very large difference. In particular, and for the shocked size distribution are about an order of magnitude lower for all the different chemical models. This is a direct result of differences in the average cross section , as a larger causes the grains to heat up more quickly (Schneider et al., 2006). In contrast, changing the chemical composition mostly affects , but the steep temperature dependence of dust cooling (Equation 3) implies that large changes in can be compensated by relatively small changes in . For comparison, in Figure 3 we show the calculated in Schneider et al. (2012a), where the dotted line indicates and the shaded box indicates . The range in corresponds to differences just in the grain size distribution/cross section. Most of the dust models in Schneider et al. (2012a) are composed primarily of carbon dust, and the similarity in between these models and our silicate dust models emphasizes that changing the dust composition produces only a small effect compared to changing the grain size distribution. Many previous authors have also noted the importance of the dust grain size distribution in determining the cooling properties of dust (e.g., Omukai et al. 2005; Hirashita & Omukai 2009).
3.4. Population II Star Forming Environments
The critical dust-to-gas ratio, , is a function of the ambient gas density and temperature in the regions where second-generation, Population II, star formation takes place. Their physical conditions are still rather uncertain, as opposed to the well-defined initial conditions for Population III star formation (Bromm, 2013). Thus far we have assumed a fiducial density and temperature of cm-3 and K where dust cooling will certainly be important (Omukai et al., 2005; Schneider et al., 2012a). This naturally corresponds to the protostellar disks explored in simulations (Clark et al., 2008; Stacy et al., 2010; Greif et al., 2011; Clark et al., 2011; Dopcke et al., 2013). However, other Population II star forming environments may also achieve high densities, with likely environments including the turbulent cores of atomic cooling halos (Wise & Abel, 2007; Greif et al., 2008; Safranek-Shrader et al., 2012) or in the post-shock region of a supernova (Mackey et al., 2003; Salvaterra et al., 2004; Nagakura et al., 2009; Chiaki et al., 2013b). To provide a broader view, we consider how dust could impact these environments by estimating their maximum densities and temperatures.
We do not expect Population II stars to form in the first dark matter minihalos since Population III supernova evacuate much of the gas from the minihalo, preventing future star formation (Whalen et al., 2008). However, a dark matter halo can cool efficiently through Lyman- lines (Wise & Abel, 2007; Greif et al., 2008). These atomic cooling halos are supersonically turbulent, which can cause densities as high as cm-3 (Safranek-Shrader et al., 2012). The virial temperatures of these halos are quite high (K) but H2 cooling can reduce the temperature to K (Oh & Haiman, 2002; Safranek-Shrader et al., 2012). These conditions will not be sufficient for dust fragmentation (Omukai et al., 2005; Schneider et al., 2012a). However, at the center of these halos gas can continue collapsing, eventually forming into protostellar disks.
An additional way to obtain a density enhancement is through a supernova shockwave. The supernova shell and post-shock region can achieve density enhancements of above the ambient ISM density (Mackey et al., 2003). Thus the maximum density achievable in a shell may be around cm-3, which will again be too low to immediately fragment through dust cooling. However, shell instabilities may still cause fragmentation, and subsequent collapse may cause dust-induced low-mass star formation (Salvaterra et al., 2004; Nagakura et al., 2009; Chiaki et al., 2013b).
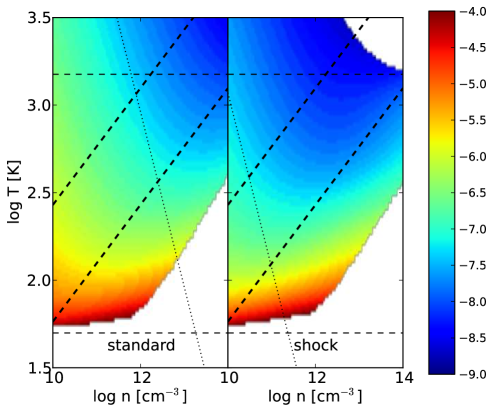
It is clear that in these environments, dust cannot cause widespread fragmentation until the disk stage of collapse. However, our density estimates of these environments are rather crude, and future studies may find other Population II star forming environments with extremely high densities. Also, there will certainly be variations in the density and temperature in a protostellar disk. Thus, for completeness, we show how varies with density and temperature in Figure 4. It is clear that (and thus ) is somewhat sensitive to the choice of density and temperature. We also show the analytic scaling of derived in Schneider et al. (2012a) as dotted lines in Figure 4 (using ). This scaling matches our calculation well at higher gas temperatures, as expected based on the approximation used to derive the formula.
We note that we use a simple thermal model that only considers adiabatic heating and dust thermal cooling. Thus, the values in Figure 4 should be treated as guidelines that approximate what would be obtained from a more complete thermal model or from simulations.
4. Comparison with Metal-Poor Star Abundances
We now compare the critical silicon abundances for star forming gas, as derived from all eight of our silicon-based dust models with both grain size distributions, to abundance measurements of metal-poor stars. We evaluate at cm-3 and K (Figure 3, Table 1).
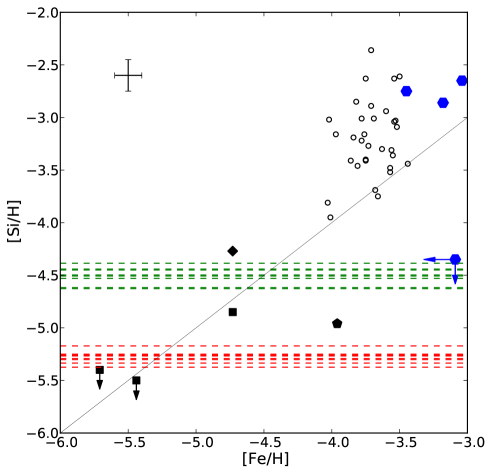
We use metal poor halo stars and dwarf galaxy stars with taken from the literature (Suda et al., 2008; Frebel, 2010; Yong et al., 2013). References to individual abundances can be found for all but the most iron-poor stars in the SAGA database (Suda et al., 2008). Figure 5 shows [Si/H] as a function of [Fe/H] for our stars. For consistency, we use abundances derived from 1D LTE stellar atmosphere models (but see further discussion below). The horizontal dashed lines indicate the critical silicon abundances from our dust models. The lines are colored by size distribution: green lines correspond to the standard size distribution, and red lines correspond to the shock size distribution. As previewed in Figure 3, the critical silicon abundances are higher for the standard size distribution by almost an order of magnitude, but variation between different chemical compositions is relatively low and less than dex. For reference, we also show the solar silicon-to-iron ratio as a thin black line. As can be seen, the stellar abundances cover a large range in the diagram. Stars with have typical -abundance ratios of and higher, albeit with one exception. For this study, stars with or are of particular interest. Indeed, there are several objects in this range which we use as test objects for our modeling of dust cooling in the earliest star forming environments. The higher metallicity stars are unfortunately not usable in this context as they likely formed at a later time from gas that already contained enough metals for cooling.
We note that silicon abundance measurements can be challenging in the most metal-poor stars given the overall weakness of absorption lines. Moreover, the strongest Si line at Å is blended with a molecular CH line. As most of these stars are carbon-enhanced, Si abundances or upper limits are difficult to derive. As a result, HE 05574840 (, Norris et al. 2007, 2012), HE 13272326 (, Frebel et al. 2005, 2006, 2008), and HE 01075240 (, Christlieb et al. 2002, 2004; Bessell et al. 2004) do not have published silicon abundances or (tight) upper limits. From having available spectra of these objects, we used the spectrum synthesis technique (see e.g., Frebel & Norris 2013 for further details) and published stellar parameters and carbon abundances (Norris et al., 2007; Frebel et al., 2005; Christlieb et al., 2002) to derive a silicon abundance for HE 05574840 and upper limits for HE 13272326 and HE 01075240. For HE 05574840, the silicon line is somewhat distorted in addition to the carbon blend, but two different spectra yield a consistent result of . For HE 01075240 and HE 13272326, a visual examination of the spectra shows no apparent absorption at Å, although again there is a strong CH feature very close to the position of the Si line. Our newly determined upper limits are for HE 01075240 and for HE 13272326. In the case of HE 01075240, we thus found a much improved limit compared to an equivalent width-based upper limit Christlieb et al. (2004).
Before comparing our critical silicon abundances to those observed in the metal-poor stars, it is important to briefly consider effects on abundances derived from 1D LTE model atmospheres, which can yield different abundances compared to using more physical 3D LTE hydrodynamic models or carrying out additional NLTE corrections. Although the carbon and oxygen abundances derived from 3D models have abundance corrections of order dex, the available 3D iron and silicon abundances appear to be within dex of the 1D abundances (Collet et al., 2006; Caffau et al., 2011). However, NLTE effects on 1D abundances can increase the silicon abundances in metal-poor stars by to dex when K. This effect becomes larger as stars become hotter (Shi et al., 2009; Zhang et al., 2011). Of the interesting stars, HE 13272326 (K) and SDSS J1029151+1729 (K) may be affected. But since only the most iron-poor stars have 3D LTE abundances available, we show the 1D LTE abundances of all stars in Figure 5. We then assume that within the given error bars, these abundances are reasonably accurately describing the Si and Fe content of the stars, especially relative to each other.
In Figure 5, the three black squares are HE 13272326, HE 01075240, and HE 05574840. These stars all have silicon abundances that fall below the critical lines for the standard size distribution, showing that they could not have formed from gas cooled by silicon-based dust of this size distribution. Furthermore, HE 01075240 and HE 13272326 have silicon upper limits that are even slightly below the critical silicon abundances derived from the shock size distribution. This suggests that both of these stars did not form because of the agency of silicon-based dust cooling at all, but instead relied on some other mechanism to enable low-mass star formation.
The star HE 14240241 is also interesting because of an abnormally low silicon abundance, , despite its somewhat higher iron abundance (; Cohen et al. 2008) compared to the stars described above. It also has only an upper limit on the carbon abundance and anomalously low [Ca/Fe] and [Ti/Fe] abundance, but significant enhancements in [Mn/Fe] and [Co/Fe]. This star is shown as the black pentagon in Figure 5. It also falls beneath the critical silicon abundances derived from the standard size distribution. While this is certainly interesting in the context of testing for cooling mechanisms, it may be possible that this star’s abundance pattern does not reflect nucleosynthesis products of typical supernovae, as such a low Si abundance has never before been found in similar metal-poor stars (Cohen et al., 2008).
There is another interesting star with low iron, SDSS J1029151+1729 (Caffau et al. 2011, , black diamond in Figure 5). It has which places it above the critical silicon values for all of our models. This star is also not carbon-enhanced (see further discussion in Section 5) and it has previously been suggested that this star formed from dust-cooled gas (Schneider et al., 2012b; Klessen et al., 2012). Our results agree with this finding.
Overall, from Figure 5, it is apparent that within our framework, the four stars falling beneath the standard size distribution’s critical silicon abundances are unable to have formed in a cloud cooled by silicate dust with a Milky Way grain size distribution. Thus, the fragmentation seen in simulations using metallicity-scaled Milky Way dust (e.g., Omukai et al. 2010; Dopcke et al. 2013) cannot explain the formation of these four stars222As a consistency check: we calculate of for the standard size distribution. The Milky Way dust-to-gas ratio is (Draine, 2011). Thus, when scaling by this is above , but when scaling by this is below . This matches the simulation results of Omukai et al. (2010) and Dopcke et al. (2013).. It follows that either this type of dust is not an accurate model of dust in the early universe, or that the presence of such dust in early gas clouds was subject to stochastic events (e.g., individual supernovae), only rarely leading to the cooling required for star formation to occur.
5. Two pathways for early low-mass star formation?
In Section 4, and assuming the suppression of carbon-based dust, we found that some stars apparently cannot form from gas cooled by only silicon-based dust. In a broader context, it is then interesting to consider the relative importance of dust thermal cooling and carbon/oxygen fine structure line cooling. We can derive new constraints on a star’s formation process by considering its silicon abundance in conjunction with from Frebel et al. (2007). Hence, we calculate for our star sample with the updated formula from Frebel & Norris (2013):
| (17) |
To emphasize our notation, note the difference between which represents a dust-to-gas ratio, and which is the transition discriminant of Frebel et al. (2007).
In Figure 6, we show as a function of the silicon abundance. Stars that have both carbon and oxygen abundances available are plotted in black. Following Frebel & Norris (2013), stars missing either carbon or oxygen are plotted in red, with a vertical bar denoting the range corresponding to [C/O].
The four stars with the lowest silicon abundances appear to all have large carbon abundances, placing them above the critical value of . SDSS J1029151+1729 however has a relatively high silicon abundance (at ) and a low carbon abundance placing it below the critical level. This combination of low Si/high C and high Si/low C abundances is an interesting finding which warrants further exploration in future work. However, if dust in the early universe is silicon-based, then the currently available data suggest a bifurcation in the dominant cooling mechanisms of the gas clouds that produced these low-mass stars. This lends support to the arguments made by Norris et al. (2013) who suggest different paths of star formation for carbon-enhanced metal-poor stars () and those that do not show such a significant overabundance of carbon relative to iron. After all, nearly a quarter of extremely metal-poor stars with are carbon-enhanced (e.g., Beers & Christlieb 2005), with the carbon-rich fraction increasing with decreasing [Fe/H].

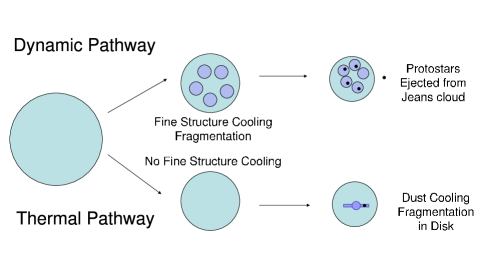
We thus further examine the physics driving these two potential pathways, which may guide future work towards clarifying emerging bimodal picture of first low-mass star formation. We start by considering gas collapse within an atomic cooling halo (Wise & Abel, 2007; Greif et al., 2008). Here, a bifurcation occurs into two different pathways depending on the fragmentation properties of the gas. A schematic view of these two pathways is shown in Figure 7.
In the first pathway, a large collapsing gas cloud undergoes vigorous fragmentation into many medium-mass clumps (Bromm et al., 2001; Safranek-Shrader et al., 2013). The presence of a LW background from the first stars (e.g., Ciardi et al. 2000) prevents molecular hydrogen from dominating the cooling rate, and thus fine structure cooling is required to enable fragmentation at these intermediate densities (Safranek-Shrader et al., 2013). The result is a strongly clustered star formation mode, where typical stars may grow to masses , but also leading to a retinue of lower-mass cluster members. Specifically, many-body gravitational interactions may eject some of these protostars from their parent clouds, thus shutting-off further accretion, so that they remain at low masses. We call this mode the “dynamic pathway”, which could be reflected in the carbon-enhanced metal-poor stars. Alternatively, the atomic carbon may condense into dust grains at high densities, inducing gas fragmentation (Chiaki et al., 2013a).
The second pathway involves monolithic collapse of a Jeans-unstable gas cloud. In the absence of significant fine-structure cooling, the gas just continues to collapse until a protostellar disk forms at the center of the cloud (e.g., Clark et al. 2008). The LW background prevents fragmentation at intermediate densities from molecular hydrogen cooling (Safranek-Shrader et al., 2013). In the disk, the density is high enough for dust cooling to be significant, and the disk fragments into low-mass clumps (Dopcke et al., 2013). We call this the “thermal pathway” and note that rotation support is critical for providing an environment that is stable for longer than the gravitational free fall time (Tohline, 1980; Clark et al., 2008). Although the LW background inhibits fragmentation from molecular cooling, it is possible that other processes could cause additional fragmentation away from the center of the halo. For example, a shell instability in a supernova shock may cause fragmentation, creating additional star clusters in the atomic cooling halo (e.g., Salvaterra et al. 2004; Nagakura et al. 2009; Chiaki et al. 2013b).
While our two-pathway interpretation is still largely qualitative at this stage, the current body of metal-poor stellar abundance data can only be satisfactorily explained with such different star formation processes occuring in the early universe. Future modeling of gas cooling and metal mixing processes will shed more light on the matter. Additional discoveries of metal-poor stars with iron, carbon, oxygen, and silicon abundance measurements and upper limits will greatly help to confirm or refute this two-pathway theory by populating the parameter space presented in Figure 6.
6. Damped Lyman- Hosts
Chemical abundances of Damped Lyman- (DLA) systems have potential to help us understand the star formation environment that may have hosted these early metal-poor stars. DLA’s have indeed been hypothesized to be observational probes of the environment where metal-poor Population II stars may form (e.g., Cooke et al. 2011 and references within). They may also be able to constrain the Population III initial mass function (Kulkarni et al., 2013). Most DLAs observed to date have (Cooke et al., 2011), but recently a high-redshift DLA candidate has been discovered with only upper limits on metal abundances (Simcoe et al., 2012). There has also been evidence that gas may remain very pristine at lower redshifts as well (Fumagalli et al., 2011).
We show the chemical abundances of the three most iron-poor DLAs from Cooke et al. (2011) and the upper limits from Simcoe et al. (2012) as blue hexagons in Figures 5 and 6. The three DLAs from Cooke et al. (2011) have abundances that fall within the scatter of the more metal-rich stars of our sample, which is consistent with the interpretation that these DLAs could be the formation sites of the metal-poor stars in our halo. The DLA candidate from Simcoe et al. (2012) has abundance limits at the critical values of both the fine structure and dust cooling criteria. This could be interpreted such that neither dust nor fine-structure line cooling have operated in this system, leading to no low-mass star formation. However, the nature of this DLA remains somewhat ambiguous (Simcoe et al., 2012), so this interpretation may need to be revised. Future observations of metal-poor DLAs will show whether additional systems can be found with such low abundances, and whether any will be below the critical silicon and carbon/oxygen abundances as presented in this paper. In fact, more metal-poor DLA’s would greatly help to further constrain the formation environment of the most metal-poor stars in the Milky Way halo.
7. Caveats
7.1. Impact of Carbon Dust
The most important assumption in our work is that dust in the early universe is largely silicon-based. If large amounts of non-silicate dust is produced, then the critical silicon abundance may not be suitable for testing dust cooling with the most metal-poor stars. In particular, as mentioned in Section 2.2 and discussed in Cherchneff & Dwek (2010), significant amounts of carbon dust may form if carbon-rich regions are not microscopically mixed with helium ions in the supernova ejecta. Cherchneff & Dwek (2010) calculate an upper limit on carbon dust produced in this situation by assuming no mixing between the carbon and helium layers. 95% of the carbon-rich/oxygen-poor layer is depleted for a total of of carbon dust, or about 10% of the final dust mass in dust models 1 and 2.
The level of mixing, and thus how much carbon dust is produced, depends on many variables including the nature of the supernova. Thus, we recompute for our dust models after adding different amounts of carbon dust directly to the dust models in Table 1. The results are shown in Figure 8. The general shape is logarithmic, corresponding to the silicon mass term in Equation 16. Changes in affect mostly at low carbon fractions.
When 20% of the dust mass is in carbon, there is a 0.2 dex shift down in (see Figure 8). This does not significantly affect our conclusions from Section 4. However, it complicates our interpretation in Section 5 (see Figure 6) as the carbon cannot be directly associated with fine structure cooling. Above 50% dust mass in carbon, shifts down by 0.5 dex. As a consequence, silicon is no longer a useful element for empirically evaluating the role of dust.
In principle, the methodology described in Section 3.3 could be applied to derive critical abundances for carbon dust. An upper limit on the critical carbon abundance can be found by assuming pure carbon dust. We find for the standard size distribution and for the shock size distribution. These thresholds are so low that falsifying a carbon dust theory is observationally intractable at the present time. We estimate that could be measured for a suitable bright, cool (K) giant if the signal-to-noise is over 300. This is at the edge of current telescope capabilities, but spectrographs on the next generation of extremely large telescopes (e.g., GCLEF on GMT) should enable observations of extremely low carbon abundances. Thus, although testing carbon dust with a critical carbon criterion is currently impractical, it may be accessible in the future.

7.2. Other Considerations
Unlike Schneider et al. (2012b), we do not fit separate supernovae yields to individual stellar abundance patterns. However, we have verified that the supernovae abundances fall within the abundance range of known metal-poor stars (Frebel, 2010). Different supernova yields would affect the dust compositions computed by the Cherchneff & Dwek (2010) models. In particular, if the ejecta were to be very abundant in carbon, regions of unmixed carbon are more probable and thus larger amounts of carbon dust would form.
We chose two simple grain size distributions to derive our critical silicon abundances instead of calculating them specifically for our dust models. In doing so, we made the simplifying assumption that all types of dust follow the same size distribution. This assumption is likely not accurate as different chemical species condense to different initial sizes and undergo different amounts of destruction in a supernova reverse shock (e.g., Todini & Ferrara 2001; Bianchi & Schneider 2007; Nozawa et al. 2007; Silvia et al. 2010). Since different grain chemical species may not be in thermal equilibrium with each other due to their low density, it may be important to treat grain types separately instead of lumping them together into a single dust model as is typically done in the literature as well as in this paper. We also note that although smaller dust grains lead to more efficient gas cooling, the supernova reverse shocks generally responsible for breaking up dust grains also completely destroy a significant fraction of the dust (Bianchi & Schneider, 2007; Silvia et al., 2010).
We did not consider grain growth, which can create significantly more dust (Chiaki et al., 2013a). However, at low metallicities, this is not important for our fiducial density of cm-3 (Hirashita & Omukai, 2009). We also neglected the effect of increased H2 formation on the surfaces of dust grains. However, the increased H2 cooling should be roughly balanced by the heat released in forming H2 (e.g., Omukai et al. 2010; Glover 2013; Dopcke et al. 2013). We do not expect that including this effect would significantly change the critical silicon abundances, but it may be relevant for causing additional fragmentation in the thermal pathway (Safranek-Shrader et al., 2013).
8. Conclusion
We have computed critical silicon abundances using the silicon-based dust models in Cherchneff & Dwek (2010). We found that different dust chemical compositions introduce only small variations ( dex) in the critical silicon abundance, but assumptions about the size distribution can produce an order of magnitude difference, with smaller grains being much more effective at cooling the gas (Figure 3). At the densities and temperatures associated with protostellar disks, the critical silicon abundance is for a standard Milky Way grain size distribution and for a shocked grain size distribution. Other Population II star forming environments are not likely to be influenced by dust because their densities are too low.
We then compare our critical silicon abundances to chemical abundances of metal-poor stars. For the standard Milky Way grain size distribution, four of the nine stars with and three of the four stars with have silicon abundances too low to be explained by silicon-based dust cooling. All stars that cannot form through silicon-based dust cooling satisfy the criterion, with the possible exception of HE 14240241. (Figures 5 and 6).
In fact, two stars have silicon abundances below even the critical silicon abundances for the shocked size distribution, suggesting that silicon-based dust may not have played a dominant role in their formation. With the caution required in interpreting a small sample of stars, we thus see hints of two distinct pathways for the formation of low-mass metal-poor stars in the early universe. One pathway depends on fine structure cooling, and the other depends on dust cooling (Figure 7).
The most important uncertainty in this analysis is the production of carbon dust, which can occur if carbon-rich regions of supernova ejecta are not microscopically mixed with helium ions. If significant amounts of carbon dust can form, the critical silicon abundance will decrease (Figure 8). If carbon dust is less than 20% of the total dust mass, the critical silicon abundances shift by less than 0.2 dex and our comparison with data is not significantly affected. However, if more of the dust is in carbon, the critical silicon abundance may not be a good criterion to evaluate dust cooling and our interpretation of Figures 5 and 6 may need revisiting. A more complete understanding of microscopic mixing and dust formation in Population III supernova ejecta may allow us to better determine a carbon dust fraction.
Given these results, we note that many potentially interesting metal-poor stars in the literature do not have silicon abundances measured. We encourage observers to consider measurements of silicon abundances or upper limits, both in future data and in currently available spectra. Additional discoveries of metal-poor DLAs may furthermore help to understand the birth clouds of metal-poor stars in the early universe. Only with more data can we observationally evaluate this and other potential models for the formation of the most metal-poor stars.
Acknowledgements
We thank an anonymous referee for improving the manuscript, especially regarding our treatment of the dust models. We thank Ralf Klessen and Naoki Yoshida for conversations regarding dust properties, Chalence Safranek-Shrader and Gen Chiaki for clarifying many points regarding their work, and John Norris and Norbert Christlieb for providing us with spectra of HE 05574840 and HE 01075240. A.J and A.F. are supported by NSF grant AST-1255160. V.B. is supported by NSF grant AST-1009928 and by NASA ATFP grant NNX09-AJ33G.
References
- Abel et al. (2002) Abel, T., Bryan, G. L., & Norman, M. L. 2002, Science, 295, 93
- Asplund et al. (2009) Asplund, M., Grevesse, N., Sauval, A. J., & Scott, P. 2009, ARA&A, 47, 481
- Beers & Christlieb (2005) Beers, T. C., & Christlieb, N. 2005, ARA&A, 43, 531
- Bessell et al. (2004) Bessell, M. S., Christlieb, N., & Gustafsson, B. 2004, ApJ, 612, L61
- Bianchi & Schneider (2007) Bianchi, S., & Schneider, R. 2007, MNRAS, 378, 973
- Bromm (2013) Bromm, V. 2013, Reports on Progress in Physics, 76, 112901
- Bromm et al. (2002) Bromm, V., Coppi, P. S., & Larson, R. B. 2002, ApJ, 564, 23
- Bromm et al. (2001) Bromm, V., Ferrara, A., Coppi, P. S., & Larson, R. B. 2001, MNRAS, 328, 969
- Bromm & Loeb (2003) Bromm, V., & Loeb, A. 2003, Nature, 425, 812
- Bromm et al. (2009) Bromm, V., Yoshida, N., Hernquist, L., & McKee, C. F. 2009, Nature, 459, 49
- Caffau et al. (2011) Caffau, E., Bonifacio, P., François, P., et al. 2011, Nature, 477, 67
- Cherchneff & Dwek (2009) Cherchneff, I., & Dwek, E. 2009, ApJ, 703, 642
- Cherchneff & Dwek (2010) —. 2010, ApJ, 713, 1
- Cherchneff & Lilly (2008) Cherchneff, I., & Lilly, S. 2008, ApJ, 683, L123
- Chiaki et al. (2013a) Chiaki, G., Nozawa, T., & Yoshida, N. 2013a, ApJ, 765, L3
- Chiaki et al. (2013b) Chiaki, G., Yoshida, N., & Kitayama, T. 2013b, ApJ, 762, 50
- Christlieb et al. (2002) Christlieb, N., Bessell, M. S., Beers, T. C., et al. 2002, Nature, 419, 904
- Christlieb et al. (2004) Christlieb, N., Gustafsson, B., Korn, A. J., et al. 2004, ApJ, 603, 708
- Ciardi et al. (2000) Ciardi, B., Ferrara, A., & Abel, T. 2000, ApJ, 533, 594
- Clark et al. (2008) Clark, P. C., Glover, S. C. O., & Klessen, R. S. 2008, ApJ, 672, 757
- Clark et al. (2011) Clark, P. C., Glover, S. C. O., Smith, R. J., et al. 2011, Science, 331, 1040
- Cohen et al. (2008) Cohen, J. G., Christlieb, N., McWilliam, A., et al. 2008, ApJ, 672, 320
- Collet et al. (2006) Collet, R., Asplund, M., & Trampedach, R. 2006, ApJ, 644, L121
- Cooke et al. (2011) Cooke, R., Pettini, M., Steidel, C. C., Rudie, G. C., & Nissen, P. E. 2011, MNRAS, 417, 1534
- Couchman & Rees (1986) Couchman, H. M. P., & Rees, M. J. 1986, MNRAS, 221, 53
- Donn & Nuth (1985) Donn, B., & Nuth, J. A. 1985, ApJ, 288, 187
- Dopcke et al. (2013) Dopcke, G., Glover, S. C. O., Clark, P. C., & Klessen, R. S. 2013, ApJ, 766, 103
- Draine (2011) Draine, B. T. 2011, Physics of the Interstellar and Intergalactic Medium (Princeton University Press)
- Draine & Li (2001) Draine, B. T., & Li, A. 2001, ApJ, 551, 807
- Fabian et al. (2001) Fabian, D., Henning, T., Jäger, C., et al. 2001, A&A, 378, 228
- Frebel (2010) Frebel, A. 2010, Astronomische Nachrichten, 331, 474
- Frebel et al. (2005) Frebel, A., Aoki, W., Christlieb, N., et al. 2005, Nature, 434, 871
- Frebel et al. (2006) Frebel, A., Christlieb, N., Norris, J. E., Aoki, W., & Asplund, M. 2006, ApJ, 638, L17
- Frebel et al. (2008) Frebel, A., Collet, R., Eriksson, K., Christlieb, N., & Aoki, W. 2008, ApJ, 684, 588
- Frebel et al. (2007) Frebel, A., Johnson, J. L., & Bromm, V. 2007, MNRAS, 380, L40
- Frebel & Norris (2013) Frebel, A., & Norris, J. E. 2013, Metal-Poor Stars and the Chemical Enrichment of the Universe, ed. T. D. Oswalt & G. Gilmore, 55
- Fumagalli et al. (2011) Fumagalli, M., O’Meara, J. M., & Prochaska, J. X. 2011, Science, 334, 1245
- Gall et al. (2011) Gall, C., Hjorth, J., & Andersen, A. C. 2011, A&A Rev., 19, 43
- Glover (2013) Glover, S. 2013, in Astrophysics and Space Science Library, Vol. 396, Astrophysics and Space Science Library, ed. T. Wiklind, B. Mobasher, & V. Bromm, 103
- Greif et al. (2010) Greif, T. H., Glover, S. C. O., Bromm, V., & Klessen, R. S. 2010, ApJ, 716, 510
- Greif et al. (2008) Greif, T. H., Johnson, J. L., Klessen, R. S., & Bromm, V. 2008, MNRAS, 387, 1021
- Greif et al. (2011) Greif, T. H., Springel, V., White, S. D. M., et al. 2011, ApJ, 737, 75
- Haiman et al. (1996) Haiman, Z., Thoul, A. A., & Loeb, A. 1996, ApJ, 464, 523
- Hirashita & Omukai (2009) Hirashita, H., & Omukai, K. 2009, MNRAS, 399, 1795
- Hollenbach & McKee (1979) Hollenbach, D., & McKee, C. F. 1979, ApJS, 41, 555
- Hosokawa et al. (2011) Hosokawa, T., Omukai, K., Yoshida, N., & Yorke, H. W. 2011, Science, 334, 1250
- Jappsen et al. (2009a) Jappsen, A.-K., Klessen, R. S., Glover, S. C. O., & Mac Low, M.-M. 2009a, ApJ, 696, 1065
- Jappsen et al. (2009b) Jappsen, A.-K., Mac Low, M.-M., Glover, S. C. O., Klessen, R. S., & Kitsionas, S. 2009b, ApJ, 694, 1161
- Karlsson et al. (2013) Karlsson, T., Bromm, V., & Bland-Hawthorn, J. 2013, Reviews of Modern Physics, 85, 809
- Klessen et al. (2012) Klessen, R. S., Glover, S. C. O., & Clark, P. C. 2012, MNRAS, 421, 3217
- Kulkarni et al. (2013) Kulkarni, G., Rollinde, E., Hennawi, J. F., & Vangioni, E. 2013, arXiv:1301.4201
- Larson (1969) Larson, R. B. 1969, MNRAS, 145, 271
- Lynch & Hunter (1998) Lynch, D. W., & Hunter, W. R. 1998, Handbook of Optical Constants of Solids III, ed. E. D. Palik (Academic Press, New York), 233
- Mackey et al. (2003) Mackey, J., Bromm, V., & Hernquist, L. 2003, ApJ, 586, 1
- Mayer & Duschl (2005) Mayer, M., & Duschl, W. J. 2005, MNRAS, 358, 614
- Nagakura et al. (2009) Nagakura, T., Hosokawa, T., & Omukai, K. 2009, MNRAS, 399, 2183
- Norris et al. (2012) Norris, J. E., Christlieb, N., Bessell, M. S., et al. 2012, ApJ, 753, 150
- Norris et al. (2007) Norris, J. E., Christlieb, N., Korn, A. J., et al. 2007, ApJ, 670, 774
- Norris et al. (2013) Norris, J. E., Yong, D., Bessell, M. S., et al. 2013, ApJ, 762, 28
- Nozawa & Kozasa (2013) Nozawa, T., & Kozasa, T. 2013, ApJ, 776, 24
- Nozawa et al. (2007) Nozawa, T., Kozasa, T., Habe, A., et al. 2007, ApJ, 666, 955
- Nozawa et al. (2003) Nozawa, T., Kozasa, T., Umeda, H., Maeda, K., & Nomoto, K. 2003, ApJ, 598, 785
- Oh & Haiman (2002) Oh, S. P., & Haiman, Z. 2002, ApJ, 569, 558
- Omukai (2000) Omukai, K. 2000, ApJ, 534, 809
- Omukai et al. (2010) Omukai, K., Hosokawa, T., & Yoshida, N. 2010, ApJ, 722, 1793
- Omukai et al. (2005) Omukai, K., Tsuribe, T., Schneider, R., & Ferrara, A. 2005, ApJ, 626, 627
- Paquette & Nuth (2011) Paquette, J. A., & Nuth, III, J. A. 2011, ApJ, 737, L6
- Patnaik (2003) Patnaik, P. 2003, Handbook of Inorganic Chemical Compounds, McGraw-Hill Handbooks (McGraw-Hill Professional Publishing)
- Philipp (1985) Philipp, H. R. 1985, Handbook of Optical Constants of Solids, ed. E. D. Palik (Academic Press, New York), 719
- Piller (1985) Piller, H. 1985, Handbook of Optical Constants of Solids, ed. E. D. Palik (Academic Press, New York), 571
- Pollack et al. (1994) Pollack, J. B., Hollenbach, D., Beckwith, S., et al. 1994, ApJ, 421, 615
- Roessler & Hunter (1991) Roessler, D. M., & Hunter, D. R. 1991, Handbook of Optical Constants of Solids II, ed. E. D. Palik (Academic Press, New York), 919
- Safranek-Shrader et al. (2012) Safranek-Shrader, C., Agarwal, M., Federrath, C., et al. 2012, MNRAS, 426, 1159
- Safranek-Shrader et al. (2010) Safranek-Shrader, C., Bromm, V., & Milosavljević, M. 2010, ApJ, 723, 1568
- Safranek-Shrader et al. (2013) Safranek-Shrader, C., Milosavljevic, M., & Bromm, V. 2013, arXiv:1307.1982
- Salvaterra et al. (2004) Salvaterra, R., Ferrara, A., & Schneider, R. 2004, New Astronomy, 10, 113
- Santoro & Shull (2006) Santoro, F., & Shull, J. M. 2006, ApJ, 643, 26
- Schneider et al. (2002) Schneider, R., Ferrara, A., Natarajan, P., & Omukai, K. 2002, ApJ, 571, 30
- Schneider et al. (2004) Schneider, R., Ferrara, A., & Salvaterra, R. 2004, MNRAS, 351, 1379
- Schneider & Omukai (2010) Schneider, R., & Omukai, K. 2010, MNRAS, 402, 429
- Schneider et al. (2012a) Schneider, R., Omukai, K., Bianchi, S., & Valiante, R. 2012a, MNRAS, 419, 1566
- Schneider et al. (2006) Schneider, R., Omukai, K., Inoue, A. K., & Ferrara, A. 2006, MNRAS, 369, 1437
- Schneider et al. (2012b) Schneider, R., Omukai, K., Limongi, M., et al. 2012b, MNRAS, 423, L60
- Semenov et al. (2003) Semenov, D., Henning, T., Helling, C., Ilgner, M., & Sedlmayr, E. 2003, A&A, 410, 611
- Shi et al. (2009) Shi, J. R., Gehren, T., Mashonkina, L., & Zhao, G. 2009, A&A, 503, 533
- Silvia et al. (2010) Silvia, D. W., Smith, B. D., & Shull, J. M. 2010, ApJ, 715, 1575
- Simcoe et al. (2012) Simcoe, R. A., Sullivan, P. W., Cooksey, K. L., et al. 2012, Nature, 492, 79
- Smith et al. (2009) Smith, B. D., Turk, M. J., Sigurdsson, S., O’Shea, B. W., & Norman, M. L. 2009, ApJ, 691, 441
- Stacy et al. (2010) Stacy, A., Greif, T. H., & Bromm, V. 2010, MNRAS, 403, 45
- Stacy et al. (2012) —. 2012, MNRAS, 422, 290
- Suda et al. (2008) Suda, T., Katsuta, Y., Yamada, S., et al. 2008, PASJ, 60, 1159
- Tegmark et al. (1997) Tegmark, M., Silk, J., Rees, M. J., et al. 1997, ApJ, 474, 1
- Todini & Ferrara (2001) Todini, P., & Ferrara, A. 2001, MNRAS, 325, 726
- Tohline (1980) Tohline, J. E. 1980, ApJ, 239, 417
- Toon et al. (1976) Toon, O. B., Pollack, J. B., & Khare, B. N. 1976, J. Geophys. Res., 81, 5733
- Tsuribe & Omukai (2006) Tsuribe, T., & Omukai, K. 2006, ApJ, 642, L61
- Tumlinson (2006) Tumlinson, J. 2006, ApJ, 641, 1
- Whalen et al. (2008) Whalen, D., van Veelen, B., O’Shea, B. W., & Norman, M. L. 2008, ApJ, 682, 49
- Wise & Abel (2007) Wise, J. H., & Abel, T. 2007, ApJ, 665, 899
- Yong et al. (2013) Yong, D., Norris, J. E., Bessell, M. S., et al. 2013, ApJ, 762, 26
- Yoshida et al. (2003) Yoshida, N., Abel, T., Hernquist, L., & Sugiyama, N. 2003, ApJ, 592, 645
- Zeidler et al. (2011) Zeidler, S., Posch, T., Mutschke, H., Richter, H., & Wehrhan, O. 2011, A&A, 526, A68
- Zhang et al. (2011) Zhang, L., Karlsson, T., Christlieb, N., et al. 2011, A&A, 528, A92
- Zubko et al. (1996) Zubko, V. G., Mennella, V., Colangeli, L., & Bussoletti, E. 1996, MNRAS, 282, 1321
| ID | Model Name | SiO2 | Fe2SiO4 | Mg2SiO4 | Si | Fe | FeS | Mg | MgO | Al2O3 | M/M | ||
|---|---|---|---|---|---|---|---|---|---|---|---|---|---|
| 1 | UM ND 20aaTrace amounts of carbon dust | 0.039 | 0 | 0 | 0.030 | 4.6 | 0.033 | 3.9 | 3.9 | 8.6 | 0.469 | -4.51 | -5.27 |
| 2 | UM D 20aaTrace amounts of carbon dust | 0 | 0 | 0.089 | 0.030 | 4.6 | 0.033 | 3.9 | 3.9 | 8.6 | 0.312 | -4.62 | -5.30 |
| 3 | M ND 20 | 0.105 | 0 | 0 | 0.049 | 4.3 | 0 | 1.4 | 0 | 8.8 | 0.625 | -4.45 | -5.26 |
| 4 | M D 20 | 0 | 0.125 | 0.160 | 0.049 | 0 | 0 | 0 | 0 | 8.8 | 0.293 | -4.63 | -5.37 |
| 5 | UM ND 170aaTrace amounts of carbon dust | 3.638 | 0 | 0 | 1.963 | 6.7 | 0.011 | 8.02 | 2.5 | 0.0297 | 0.648 | -4.39 | -5.17 |
| 6 | UM D 170aaTrace amounts of carbon dust | 2.577 | 0 | 2.474 | 1.963 | 6.7 | 0.011 | 2.5 | 2.5 | 0.0296 | 0.519 | -4.53 | -5.33 |
| 7 | M ND 170 | 17.3 | 0 | 0 | 8.1 | 0.004 | 0 | 0 | 0 | 0.003 | 0.637 | -4.44 | -5.25 |
| 8 | M D 170 | 12.9 | 6.6 | 5.7 | 8.1 | 0.004 | 0 | 0 | 0 | 0.003 | 0.486 | -4.50 | -5.29 |
Note. — Dust masses are in . Model names refer to the type of dust model from Cherchneff & Dwek (2010). UM = unmixed, M = mixed; ND = nondepleted, D = depleted. Optical constant references: SiO2, Philipp (1985); Fe2SiO4, Fabian et al. (2001), Zeidler et al. (2011); Mg2SiO4, Semenov et al. (2003); Si, Piller (1985); Fe, Semenov et al. (2003); FeS, Semenov et al. (2003); Mg, Lynch & Hunter (1998); MgO, Roessler & Hunter (1991); Al2O3, Toon et al. (1976); C, Zubko et al. (1996).