The effect of episodic accretion on the phase transition of CO and CO2 in low-mass star formation
We study the evaporation and condensation of CO and CO2 during the embedded stages of low-mass star formation by using numerical simulations. We focus on the effect of luminosity bursts, similar in magnitude to FUors and EXors, on the gas-phase abundance of CO and CO2 in the protostellar disk and infalling envelope. The evolution of a young protostar and its environment is followed based on hydrodynamical models using the thin-disk approximation, coupled with a stellar evolution code and phase transformations of CO and CO2. The accretion and associated luminosity bursts in our model are caused by disk gravitational fragmentation followed by quick migration of the fragments onto the forming protostar. We found that bursts with luminosity on the order of 100–200 can evaporate CO ices in part of the envelope. The typical freeze-out time of the gas-phase CO onto dust grains in the envelope (a few kyr) is much longer than the burst duration (100–200 yr). This results in an increased abundance of the gas-phase CO in the envelope long after the system has returned into a quiescent stage. In contrast, luminosity bursts can evaporate CO2 ices only in the disk, where the freeze-out time of the gas-phase CO2 is comparable to the burst duration. We thus confirm that luminosity bursts can leave long-lasting traces in the abundance of gas-phase CO in the infalling envelope, enabling the detection of recent bursts as suggested by previous semi-analytical studies.
Key Words.:
stars: formation — stars: low-mass — accretion, accretion disks — protoplanetary disks1 Introduction
Low-mass stars are born as a result of the gravitational collapse of dense and cold cores composed mainly of molecular hydrogen, which in turn are formed in giant molecular clouds from the combination of turbulent, gravitational and magnetic processes (e.g McKee & Ostriker, 2012). Despite many observational and theoretical efforts, how a low-mass star accumulates its final mass remains an open question. In the classic model of inside-out collapse (Shu, 1977), the mass accretion rate onto the protostar is proportional to the cube of the sound speed, , implying a rather narrow spread of accretion rates yr-1 for typical conditions in pre-stellar cores. These values of are in stark disagreement with those inferred for young protostars, exhibiting a variety of accretion rates from yr-1 to yr-1 (Dunham et al., 2006; Evans et al., 2009). In particular, the fraction of objects with yr-1 amounts to 50% in Perseus, Serpens, and Ophiuchus star-forming regions (Enoch et al., 2009). FU-Orionis-type objects (FUors) with accretion rates sometimes exceeding yr-1 and very-low-luminosity objects (e.g Bourke et al., 2006) with accretion rates most certainly below yr-1 also do not fit into the classic model.
It is becoming evident that the simplified model of Shu (1977) cannot explain the whole variety of inferred accretion rates and the concept of variable accretion with episodic bursts, based on the original idea of Kenyon et al. (1990), is currently gaining theoretical and observational support. According to this concept, the mass accretion onto the forming protostar is characterized by short ( yr) bursts approximately with yr-1 alternated with longer (– yr) quiescent periods with yr-1.
Numerous mechanisms that can produce variable accretion with episodic bursts have been proposed in the past. They include models explaining the origin of FUor accretion bursts by means of viscous-thermal instabilities in the inner disk (Lin & Papaloizou, 1986; Bell & Lin, 1991), thermal instabilities induced by density perturbations due to, e.g., a massive planet in the disk (Lodato & Clarke, 2004), and tidal effects from close encounters in binary systems or stellar clusters (Bonnell & Bastien, 1992; Pfalzner et al., 2008). Recently, several promising accretion burst mechanisms have emerged or received further refinement, such as a combination of gravitational instability and the triggering of the magnetorotational instability (Armitage et al., 2001; Zhu et al., 2010), accretion of dense clumps in a gravitationally fragmenting disk (Vorobyov & Basu, 2006, 2010), perturbations caused by a planetary or sub-stellar object on an eccentric orbit (Machida et al., 2011a; Vorobyov, 2012), or instability when an accretion disk is truncated by the star’s strong magnetic field close to the corotation radius (D’Angelo & Spruit, 2010).
Episodic accretion may have important consequences for the evolution of stars and planets. It provides an explanation for the long-standing luminosity problem in young protostars (Dunham & Vorobyov, 2012), explains the luminosity spread in young stellar clusters without invoking any significant age spread (Baraffe et al., 2009, 2012), and can account for unexpected lithium and beryllium depletion in some young stars (Baraffe & Chabrier, 2010; Viallet & Baraffe, 2012). In addition, quiescent periods between the accretion bursts can promote disk fragmentation, which might in turn promote planet formation (Stamatellos et al., 2011).
Episodic accretion may also have important implications for the chemical evolution of protostellar disks and envelopes. Using simplified core collapse calculations with prescribed accretion bursts, Lee (2007) and Visser & Bergin (2012) showed that the bursts can lead to evaporation of CO, CO2, and some other ices in protostellar envelopes. The freeze-out timescale of these species is expected to be longer than the typical duration of the burst ( yr), so that the chemical signatures of the bursts can linger through the quiescent phase of accretion. Kim et al. (2011, 2012) found evidence for pure CO2 ice in about 50% of the observed low-luminosity sources, implying that the dust temperature must have been higher in the past presumably due to recent accretion bursts.
In this paper, we employ numerical hydrodynamics simulations coupled with a stellar evolution code, as done in Baraffe et al. (2012), and a simplified chemical model, to explore the effect of episodic accretion onto the evaporation and freeze-out of CO and CO2 during the early stages of star formation. The coupling between hydrodynamical simulations and the evolution of the central, accreting object provides a consistent value of the protostar luminosity, which is relevant for the estimate of the radiative feedback from the protostar in the disk and the envelope. This feedback impacts the gas/dust temperatures which are required for the calculations of CO and CO2 abundances. In the present hydrodynamical calculations, estimate of the gas/dust temperatures relies on the diffusion approximation for the treatment of radiative transfer and additional approximations regarding the geometry of the disk and of the surrounding material. We analyse the uncertainties of temperatures based on such approximations, by comparing them with temperatures obtained from improved radiative transfer calculations based on the TORUS code (Harries et al. 2004; Harries 2011). We will also discuss (§3) the impact of our approximation on the predicted CO and CO2 abundances.
2 Model description
2.1 Basic equations
Our numerical hydrodynamics model for the formation and evolution of a young stellar object is described in detail in Vorobyov & Basu (2010). Here, we briefly review the main concepts and describe latest modifications. The model in the most general case includes a forming protostar, described by a stellar evolution code, and a protostellar disk plus infalling envelope, both described by numerical hydrodynamics equations. We use the thin-disk approximation, which is an excellent means to calculate the evolution for many orbital periods and many model parameters and its justification is discussed in Vorobyov & Basu (2010). The thin-disk approximation is complemented by a calculation of the vertical scale height in both the disk and envelope determined in each computational cell using an assumption of local hydrostatic equilibrium. The resulting model has a flared structure with the vertical scale height increasing with radial distance according to the law . Both the disk and envelope receive a fraction of the irradiation energy from the central protostar described by equation (7) (see below). The main physical processes taken into account when computing the evolution of the disk and envelope include viscous and shock heating, irradiation by the forming star, background irradiation, radiative cooling from the disk surface and self-gravity. The corresponding equations of mass, momentum, and energy transport are
| (1) |
| (3) |
where subscripts and refers to the planar components in polar coordinates, is the mass surface density, is the internal energy per surface area, is the vertically integrated gas pressure calculated via the ideal equation of state as with , is the velocity in the disk plane, and is the gradient along the planar coordinates of the disk. The gravitational acceleration in the disk plane, , takes into account self-gravity of the disk, found by solving for the Poisson integral (see details in Vorobyov & Basu, 2010), and the gravity of the central protostar when formed.
Turbulent viscosity due to sources other than gravity is taken into account via the viscous stress tensor , the expression for which is provided in Vorobyov & Basu (2010). We parameterize the magnitude of kinematic viscosity using the -prescription with a spatially and temporally uniform .
The radiative cooling in equation (2.1) is determined using the diffusion approximation of the vertical radiation transport in a one-zone model of the vertical disk structure (Johnson & Gammie, 2003)
| (4) |
where is the Stefan-Boltzmann constant, is the midplane temperature of gas111This definition of the midplane temperature is accurate within a factor of order unity (Zhu et al., 2012), is the mean molecular weight, is the universal gas constant, and is a function that secures a correct transition between the optically thick and optically thin regimes. We use frequency-integrated opacities of Bell & Lin (1991). The heating function is expressed as
| (5) |
where is the irradiation temperature at the disk surface determined by the stellar and background black-body irradiation as
| (6) |
where is the uniform background temperature (in our model set to the initial temperature of the natal cloud core) and is the radiation flux (energy per unit time per unit surface area) absorbed by the disk surface at radial distance from the central star. The latter quantity is calculated as
| (7) |
where is the incidence angle of radiation arriving at the disk surface at radial distance . The incidence angle is calculated using the disk surface curvature inferred from the radial profile of the disk vertical scale height (see Vorobyov & Basu, 2010, for more details).
The central object’s luminosity is the sum of the accretion luminosity arising from the gravitational energy of accreted gas and the photospheric luminosity due to gravitational contraction and deuterium burning in the protostar interior. The stellar mass and accretion rate onto the star are determined self-consistently during numerical simulations using the amount of gas passing through the sink cell. The evolution of the accreting protostar is based on the Lyon stellar evolution code with input physics described in Chabrier & Baraffe (1997) and including accretion processes as described in Baraffe et al. (2009) and Baraffe et al. (2012). The accretion rates are derived from the hydrodynamic calculations above described. As in Baraffe et al. (2012), we assume that a fraction of the accretion energy is absorbed by the protostar, while the fraction (1-) is radiated away and contributes to in equation (7)222As in Baraffe et al. (2009), we assume a value =1/2 characteristic of accretion from a thin disk.. In the present calculations, we adopt a ”hybrid” scheme to describe the contribution of the accreted matter to the protostar’s internal energy, with ”cold” accretion, i.e , when accretion rates remain smaller than a critical value , and ”hot” accretion, i.e , when . In this paper we adopt yr-1 and (see discussion in Baraffe et al., 2012). For the initial mass of the protostar, corresponding to the second Larson core mass, we adopt a value of 1.0 with an initial radius .
The input parameters provided by the hydrodynamic calculations to the coupled stellar evolution code are the age of the protostar and the accretion rate onto the stellar surface , while the output are the radius and the photospheric luminosity of the protostar. The stellar evolution code is called to update the properties of the protostar every 5 yr of the physical time. For comparison, the global hydrodynamical timestep may be as small as a few weeks and the whole cycle of numerical simulations may exceed 1.0 Myr. This coupling of the disk and protostar evolution allows for a self-consistent determination of the radiative input of the protostar into the disk thermal balance, which is important for the accurate study of disk instability and fragmentation.
The dynamics of carbon monoxide (CO) and carbon dioxide (CO2) including absorption onto and desorption from dust grains is computed using the modified equations of continuity for the surface densities of solid () and gaseous () phases
| (8) | |||||
| (9) |
where index corresponds to either CO or CO2, is the absorption rate (s-1) and is the desorption velocity from dust grains in units of g cm-2 s-1. The expressions for and were taken from Charnley et al. (2001) and Visser et al. (2009) assuming a zero-order desorption for thick ice mantles
| (10) |
| (11) |
where is the gas midplane temperature333We neglect possible vertical variations in the gas temperature. A more accurate approach involving the reconstruction of the vertical structure is currently in development., and are the molecular weight and mass (in gram), respectively, and is the number density of dust grains. The values of the binding energy for CO and CO2 ( and K) and vibrational frequency ( cm-2 s-1 and cm-2 s-1) were taken from Bisschop et al. (2006) and Noble et al. (2012). In this paper, we make a simplifying assumption of and discuss possible consequences in Section 4.
In the limit of a constant radius of dust grains , the expression in brackets in equation (10) can be written in the following simplified form
| (12) |
where is the dust to gas mass ratio, is the mass of a dust grain and g cm-3 is the density of dust grains. The radius of dust grains is set in this study to m.
When writing equations (8) and (9) for the surface densities of CO and CO2 we assumed that dust is passively transported with gas and neglected the dust radial drift caused by the dust–gas drag force. The latter simplification is of little consequence for the dynamics of dust grains with sizes on timescales of Myr (Takeuchi & Lin, 2002). We also do not take into account chemical reactions that may change the abundance of CO and CO2, and consider only phase transformations of these species. Chemical transformations will be taken into account in a follow-up study.
We start our numerical simulations from the gravitational collapse of a starless cloud core, continue into the embedded phase of star formation, during which a star, disk, and envelope are formed, and terminate our simulations in the T Tauri phase, when most of the envelope has accreted onto the forming star plus disk system. The protostellar disk, when present, is located in the inner part of the numerical polar grid, while the collapsing envelope occupies the rest of the grid. As a result, the disk is not isolated but is exposed to intense mass loading from the envelope. In addition, the mass accretion rate onto the disk is not a free parameter of the model but is self-consistently determined by the gas dynamics in the envelope.
To avoid too small time steps, we introduce a “sink cell” at AU and impose a free inflow inner boundary condition and free outflow outer boundary condition so that the matter is allowed to flow out of the computational domain but is prevented from flowing in. The sink cell is dynamically inactive; it contributes only to the total gravitational potential and secures a smooth behaviour of the gravity force down to the stellar surface. During the early stages of the core collapse, we monitor the gas surface density in the sink cell and when its value exceeds a critical value for the transition from isothermal to adiabatic evolution, we introduce a central point-mass object. In the subsequent evolution, 90% of the gas that crosses the inner boundary is assumed to land onto the protostar. A small fraction of this mass (a few per cent) remains in the sink cell to guarantee a smooth transition of the gas surface density across the inner boundary. The other 10% of the accreted gas is assumed to be carried away with protostellar jets.
The numerical resolution is grid points and the numerical procedure to solve hydrodynamics equations (1)-(2.1) is described in detail in Vorobyov & Basu (2010). The modified continuity equations (8) and (9) are solved using a two-step procedure. First, the advection part (zero r.h.s.) is solved using the same piecewise parabolic advection scheme as for the gas surface density. Then, the surface densities of CO and CO2 are updated to take into account the phase transformations using a first-order backward Euler scheme. This scheme is implicit and in principle does not require a time-step limiter. However, too big timesteps can result in the loss of accuracy. Therefore, if the relative change of and/or exceeds 10% over one global hydro step, the local integration timestep for equations (8) and (9) is reduced by a factor of 2 and the solution is sought once again. This subcycling procedure is repeated until the desired accuracy is achieved.
2.2 Initial setup
For the gas surface density and angular velocity radial distributions we take those typical of pre-stellar cores formed as a result of the slow expulsion of magnetic field due to ambipolar diffusion, with the angular momentum remaining constant during axially-symmetric core compression (Basu, 1997)
| (13) |
| (14) |
Here, and are the angular velocity and gas surface density at the center of the core and is the radius of the central plateau, where is the initial sound speed in the core. The gas surface density distribution described by equation (13) can be obtained (to within a factor of order unity) by integrating the three-dimensional gas density distribution characteristic of Bonnor-Ebert spheres with a positive density-perturbation amplitude A (Dapp & Basu, 2009). The value of is set to 1.2 and the initial gas temperature is set to 10 K.
In order to form a gravitationally unstable core, we set the ratio of the outer radius to the radius of the central plateau to 6.0. For the outer radius of the core AU, the resulting central surface density is g cm-2 and the total mass of the core is . The central angular velocity is set to 1.0 km s-1 pc-1, which yields the ratio of rotational to gravitational energy . Our previous numerical simulations indicate that pre-stellar cores with similar and produce disks that are gravitationally unstable. Mass accretion rates onto the protostar in these models often exhibit episodic accretion bursts caused by disk fragmentation and migration of the fragments onto the protostar (Vorobyov & Basu, 2010).
The abundances of CO and CO2 (relative to the number density of molecular hydrogen) are set to , typical for pre-stellar gravitationally unstable cores444The adopted abundances are not expected to influence our results because we do not take into account chemical transformations in this study. (Charnley et al., 2001; Pontoppidan et al., 2008). We assume that initially 10% of CO and CO2 is in the solid phase in order to be consistent with previous works of Visser et al. (2009) and Visser & Bergin (2012).
3 Results of numerical simulations
3.1 Main characteristics of the model
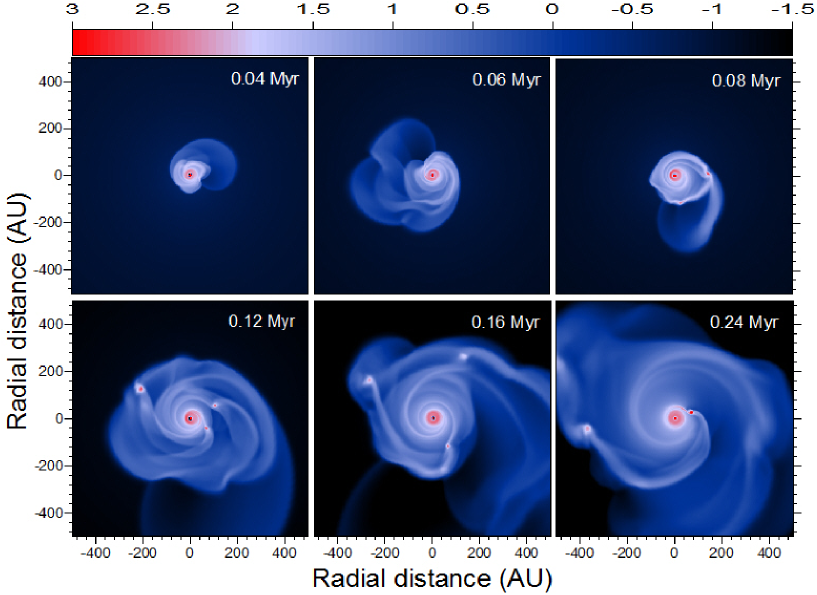
We start by describing the main properties of the forming protostar, disk and envelope. Figure 1 shows the gas surface density maps in the inner AU box at six consecutive times after formation of the central protostar. The disk forms at Myr, grows in mass and size due to continuing mass loading from the infalling envelope, and becomes gravitationally unstable (as manifested by a weak spiral structure) as early as at Myr. The first episode of disk fragmentation occurs at Myr. In the subsequent evolution, multiple fragments emerge in the disk at distances AU but most migrate into the inner regions and through the sink cell due to the loss of angular momentum via gravitational interaction with the spiral arms and other fragments in the disk. This phenomenon is studied in detail by Vorobyov & Basu (2006, 2010) and is confirmed by independent fully three-dimensional studies (e.g. Machida et al., 2011a). The ultimate fate of the migrating fragments depends on how quickly they can contract to stellar or planetary-sized objects. If the contraction timescale is longer than the migration/tidal destruction timescale, then the fragments will be completely destroyed when approaching the protostar, releasing their gravitational energy in the form of luminosity outbursts comparable to magnitude to FU Orionis and EX Lupi objects. This scenario is assumed in the present work.
Figure 2 presents the time evolution of a) the mass accretion rate onto the star , b) the photospheric (dashed line) and total (solid line) luminosities, c) the masses of the protostar (solid line), protostellar disk (dashed line), and envelope (dash-dotted line), and d) the radius of the disk. The partition between the disk and infalling envelope is based on a threshold density of g cm-2 and the corresponding algorithm is described in detail in Dunham & Vorobyov (2012). The time is counted from the formation of the central protostar.
Two luminosity outbursts exceeding in magnitude , along with a number of smaller bursts (), are evident against the background luminosity of a few . The photospheric luminosity provides a negligible input into the total flux in the early evolution ( Myr) because the accretion rate does not exceed yr-1 and the accretion process is essentially cold, depositing little entropy to the protostar The first episode of hot accretion occurs at Myr, when the mass accretion rate exceeds yr -1. Thereafter, the photospheric luminosity is slowly varying around .
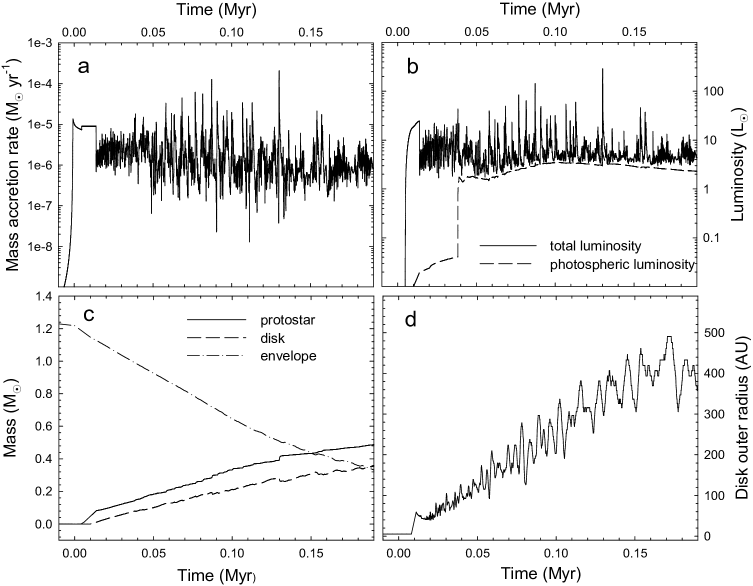
Panels c) and d) in Figure 2 illustrate the time evolution of other global characteristics of our model. The disk mass steadily grows during the initial evolution and reaches a value of at 0.2 Myr. In the subsequent evolution, the disk mass saturates and starts to decline slowly. The mass of the protostar exceeds that of the disk and shows episodic sharp increases caused by massive fragments spiralling in onto the protostar. The envelope mass steadily decreases and the model enters the class I stage of stellar evolution, defined as the time when approximately half of the initial mass reservoir is left in the envelope, at Myr. The disk radius increases with time but also shows significant radial pulsations. These contractions/expansions are caused by migration of the fragments and the corresponding redistribution of angular momentum within the disk, when the fragment’s angular momentum is transferred to the spiral arms causing them to unwind and expand radially outward. Overall, the considered model produces a rather massive and extended disk. Theoretically, such disks are not unexpected in the embedded stage of star formation characterized by high rates of mass infall onto the young disk. However, it must be kept in mind that we have not taken into account magnetic fields and the effect of the external environment, which can significantly decrease the mass and size of protostellar disks (see e.g. Hennebelle & Teyssier, 2008). Therefore, although the qualitative picture issued from the present calculations should be rather robust, the quantitative results must be considered with due caution.
3.2 Spatial distribution of CO and CO2
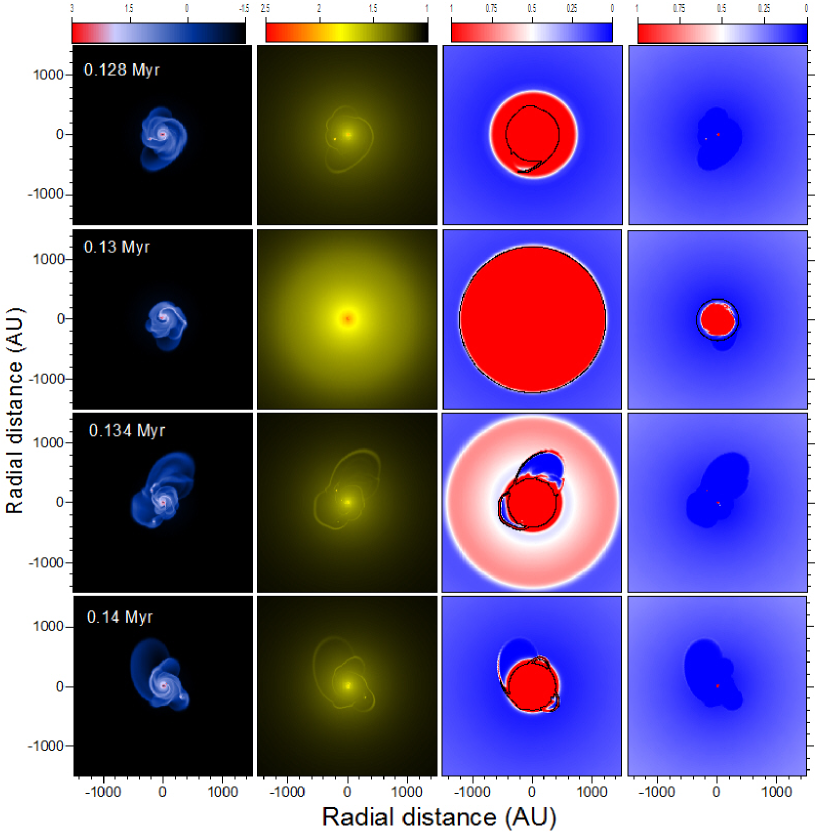
Figure 3 presents (from left to right) the gas surface density (first column), the gas temperature (second column), the CO gas-phase fraction (third column) and the CO2 gas-phase fraction (fourth column) in the inner AU region, at four distinct time instances. The first row (from top to bottom) highlights the evolution stage soon after a moderate luminosity burst with ( yr-1) that occurred at Myr. The second row presents the model during a strong luminosity burst with ( yr-1) at Myr. The third row shows the model at t=0.134 Myr, i.e., 4.0 kyr after the strong burst. Finally, the fourth row represents the quiescent stage at Myr with . The black lines delineate isotemperature contours with K (third column) and K (fourth column). These values correspond to the evaporation temperatures of CO and CO2 ices from dust grains (Noble et al., 2012).
A visual inspection of Figure 3 indicates that the protostellar disk (localized in the inner 300-350 AU) is characterized by almost complete evaporation of CO from dust grains (), a result consistent with the recent study of molecular abundances in gravitationally unstable disks by Ilee et al. (2011). This holds for both the burst and quiescent stages of disk evolution. A moderate burst at Myr () can also evaporate CO in the innermost parts of the envelope up to AU (first row) and the CO evaporation region can extend beyond 1000 AU for a strong burst with (second row).
The burst duration is usually limited to 100–200 yr (defined as the period of time during which the mass accretion rate constantly exceeds yr-1) but the effect of the burst is lingering in the envelope for a significantly longer time. For instance, the duration of the burst at Myr is about 0.2 kyr, but a significant amount of gas-phase CO is seen in the envelope at Myr, i.e., almost 4.0 kyr after the burst (third row in Figure 3). The gas temperature in the envelope at this stage drops below 20 K (as indicated by the isotemperature contour), which means that the presence of gas-phase CO is truly related to a recent luminosity burst. Two lobe-like features that are almost completely devoid of gas-phase CO are evident in the third row. The spiral arms have dynamically swept through the lobe regions prior to the snapshot, and during this passage the CO gas has frozen out onto the grains in the high-density wake of the arms. At the same time, the leading edge of the arms is shock compressed to a sufficiently high temperature to evaporate CO. Finally, we note that CO freezes out onto dust grains during the quiescent stage if its duration is comparable to or longer than 10 kyr (fourth row in Figure 3).
The effect of a recent luminosity burst on the gas-phase CO in the envelope can be understood from the following simple analysis. The -folding time of freeze-out onto dust grains can be expressed as
| (15) |
where is the gas volume density. For the typical conditions in the inner envelope at AU ( K and cm-3), the resulting e-folding time for CO freeze-out onto dust grains is approximately 2500 yr. The fact that for carbon monoxide can be much longer than the burst duration opens up a possibility for the observational detection of recent bursts, as suggested by Lee (2007) and Visser & Bergin (2012) on the basis of simplified core collapse calculations. Equation (15) also indicates that increases linearly with the radius of dust grains , suggesting that this phenomenon may become even more pronounced if dust grains have enough time to coagulate and grow to sizes greater than adopted in the present study, m.
In contrast, the phase transformations of CO2 during the bursts are much less pronounced. Most of the disk and all of the envelope in Figure 3 are characterized by CO2 frozen out onto grains. CO2 has an evaporation temperature of 35–40 K and in the quiescent stage the gas-phase CO2 is present only in the inner 25–30 AU. During the strong burst with (second row in Figure 3), the temperature may rise above the CO2 evaporation limit in the inner 200–300 AU, transforming most of CO2 into the gas phase. However, the gas density in this region of the disk ( cm-3) is considerably higher than in the envelope and the -folding time for the CO2 freeze-out onto dust grains ( yr) is significantly shorter than that of carbon monoxide ( yr). As a result, the gas-phase CO2 quickly returns into the solid phase after the burst and no gas-phase CO2 is seen at Myr at radial distances beyond 25–30 AU. We conclude that the phase transitions of CO2, and in particular the abundance of gas-phase CO2, are less convenient for monitoring the recent burst activity. We note, however, that the abundance of solid CO2 appears to be sensitive to the past accretion history and can be a good episodic accretion tracer, as recently demonstrated by Kim et al. (2011).
3.3 Time variations of the gas-phase CO and CO2 in the envelope
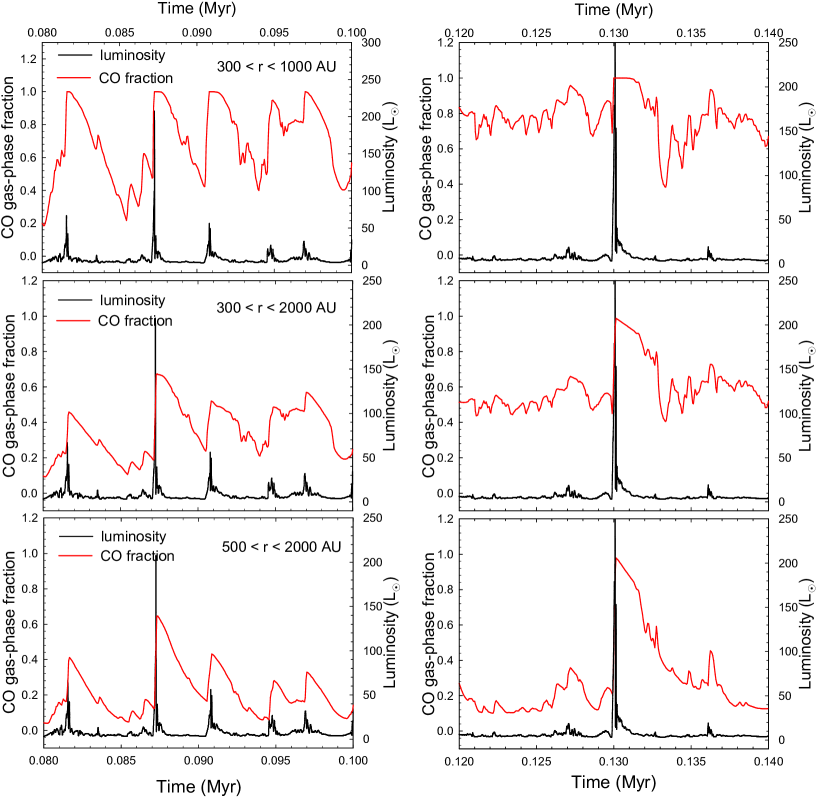
In Figure 4 we consider the time evolution of the gas-phase CO fraction () during two time intervals: 0.08–0.1 Myr (left column) and 0.12–0.14 Myr (right column). These time intervals were chosen so as to capture two most intense and several moderate luminosity bursts. The red lines present averaged over three radial bins: AU (top row), AU (middle row), and AU (bottom row). The first two bins cover the outer parts of the disk and the inner parts of the infalling envelope, while the last bin covers only the inner envelope (the disk radius is less than 500 AU, see Figure 2). The time is counted from the formation of the central protostar. The black lines show the total protostellar luminosity vs. time.
The general correlation between and is evident in Figure 4. The CO gas-phase fraction steeply rises during the burst to a maximum value and gradually declines to a minimum value after the burst. The relaxation time to the pre-burst stage is notably longer than the burst duration, in agreement with analytic estimates performed in the previous section. This pattern of behaviour—periodic steep rises during the bursts followed by gradual declines—is most pronounced in the envelope. Carbon monoxide in the disk is mostly in the gas phase and the bursts have little effect on the CO gas-phase fraction there. The top-right panel in Figure 4 illustrates such an example. The CO gas-phase fraction is averaged over the AU radial bin, which covers part of the disk (with radius 350–400 AU at this time instant). Evidently, the correlation between and is less pronounced. It is therefore important to filter out the disk contribution when calculating .
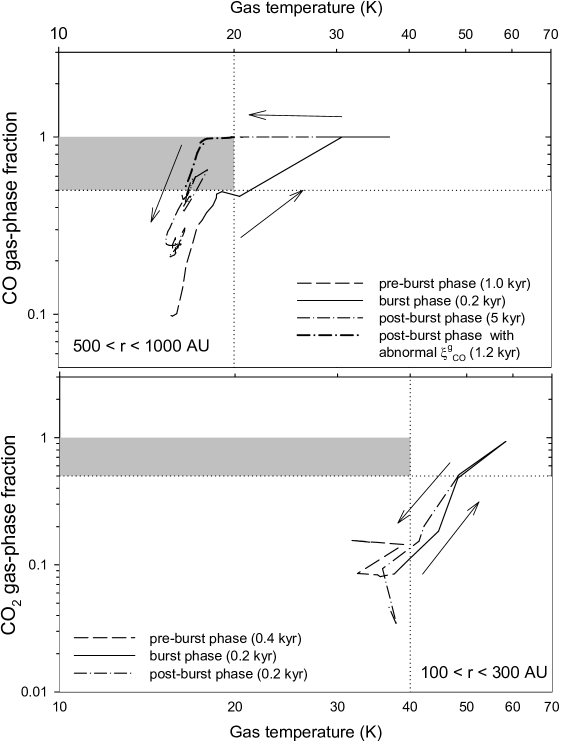
The delayed adsorption of CO onto dust grains after a strong luminosity burst is illustrated in the top panel of Figure 5 showing the gas-phase CO fraction vs. gas temperature in the AU radial annulus. A short time period covering the burst at Myr is shown including 1.0 kyr immediately before the burst (dashed line), 0.2 kyr during the burst (solid line), and 5 kyr after the burst (dash-dotted line). The vertical and horizontal dotted lines mark the CO fraction of 0.5 and the gas temperature above which CO evaporates. It is evident that the evolution tracks of the CO gas-phase fraction are different in the pre- and post-burst phases. Before the burst CO is found mostly in the solid phase, as expected for K. During the burst, increases with the rising gas temperature and reaches a maximum value of . However, after the burst the gas temperature quickly drops below 20 K, but remains abnormally high. The corresponding region in the diagram is filled with a grey shade and the model track in this region is highlighted by the thick dash-dotted line. The time spent in this abnormal region (with and K) is 1.2 kyr555This value does not take into account the time spent at and K. The full time needed for the gas-phase fraction of CO to go back down to 0.5 following the burst is about 2–3 kyr. The resulting mismatch between the gas temperature and the CO gas-phase content in the post-burst phase can be used to detect recent luminosity outbursts. Objects that are found in the grey-shaded area of the diagram are likely to be in the post-burst phase; objects in the quiescent and pre-burst phases are unlikely to fall into this region.
On the contrary, the phase transformation of CO2 lacks such a characteristic feature. The bottom panel in Figure 5 presents the gas-phase CO2 fraction vs. gas temperature in the AU radial annulus during a short time period covering the burst at Myr. The dotted vertical line marks the critical gas temperature above/below which CO2 is supposed to be mostly in the gas/solid phase. During the burst rises to a maximum value of and returns to a small value of during just 0.2 kyr in the post-burst phase. There is no evolution stage when the gas temperature is below the condensation temperature of CO2, but the gas-phase CO2 fraction is abnormally high. The evolution tracks of the CO2 gas-phase fraction in the pre- and post-burst phases follow a similar path in the diagram and do not pass through the shaded region. This makes CO2 ineffective in detecting recent luminosity bursts.
4 Model uncertainties
Our model has a few assumptions that may affect the abundance of CO and CO2 ices in the disk and envelope. In this section, we discuss the model caveats and their impact on our main results.
Uncertainties in the gas/dust temperature. In our model we assumed that the gas and dust temperatures are equal. This is usually correct for the gas densities typical for a protostellar disk ( cm-3), where frequent collisions between the gas and dust particles lead to fast thermalization between these species. In the envelope, however, the gas temperature may differ from that of the dust. A more accurate approach with a separate treatment of dust and gas thermodynamics is needed to assess the possible effect of the gas to dust temperature imbalance.
The lack of vertical structure. The use of the thin-disk approximation implies that all quantities are averaged over the scale height and there are no variations in the gas volume density and temperature with the distance from the midplane. This may affect the adsorption and desorption rates of ices if strong vertical variations in the thermodynamical properties are present. Work is in progress to reconstruct the vertical structure based on the coupled solution of the radiation transfer and hydrostatic equilibrium equations. Preliminary results indicate that notable vertical variations in the gas temperature and density may be present in the inner disk regions but they are diminishing in the envelope (Vorobyov et al. 2013, in prep.).
Simplified treatment of gas thermodynamics. Present results are based on a simplified form of diffusion approximation to calculate the thermal balance in the disk and envelope. We test our approach by comparing our derived gas/dust temperatures with those obtained with an improved treatment of radiative transfer using the TORUS code (Harries et al., 2004; Harries, 2011). The later employs the Monte-Carlo algorithm described by Lucy (1999). We assume silicate dust grains with a dust-to-gas ratio of 0.01, and adopt a canonical ISM grain-size distribution (Mathis et al., 1977). The grain opacities and Mie phase matrices were calculated from the refractive indices of astronomical silicates (Draine and Lee 1984). Note that TORUS also assumes that dust and gas temperatures are the same.
The post-processed radiative transfer calculations with TORUS require the knowledge of the density distribution. We explore two different cases with axisymmetric (case 1) and spherically symmetric (case 2) distributions, respectively. Case 1 provides information on the temperature uncertainty resulting from the simplified treatment of radiative transfer in the hydrodynamical model. Case 2 corresponds to a spherically symmetric envelope and provides a limiting case which helps estimating the temperature uncertainty in the envelope due to imposed thin-disk limit (see below and Fig. 6). The combination of both cases can thus provides a rough estimate of the error on temperatures determined in the hydrodynamical model.
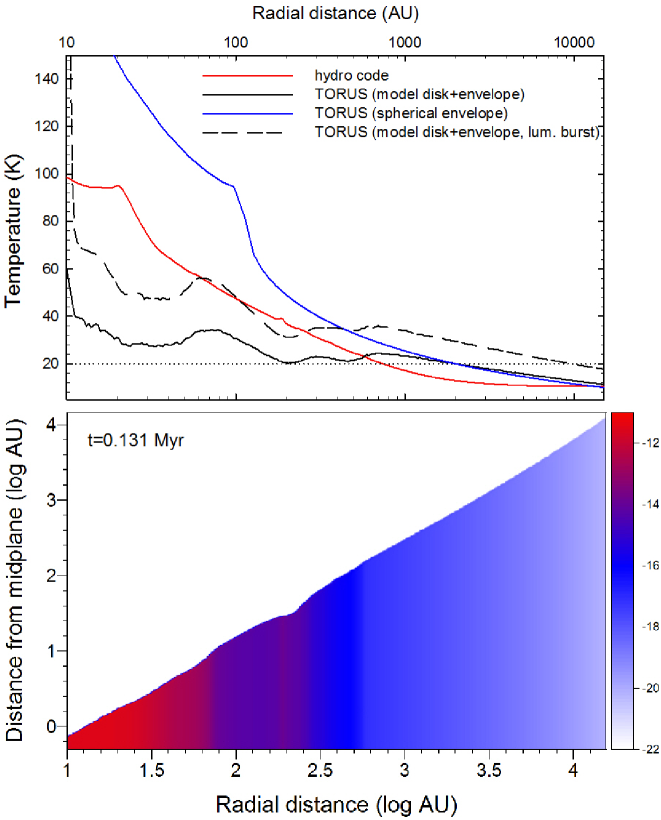
The top panel in Figure 6 presents the gas temperature vs. radial distance calculated using both our hydrodynamical model (providing the so-called midplane gas temperature ) and the TORUS code. In particular, the red line shows the azimuthally averaged in our model in the post-burst stage at Myr when the luminosity of the central protostar has dropped to approximately 9.0 . The solid black line (case 1) is the gas midplane temperature calculated using the TORUS code for the same gas density distribution and the same stellar luminosity as in our hydrodynamical model at Myr. A mass-weighted vertical mean temperature differs from the midplane temperature in the TORUS calculation by a factor of order unity. We convert the model surface densities into volume densities (needed in TORUS) using the following simple formula: , where and are the azimuthally averaged gas surface density and vertical scale height. The resulting gas density distribution has a flared form as shown in the bottom panel of Figure 6, with the vertical scale height increasing with distance. The color shaded area represents the disk plus envelope, while the white area is filled with a rarefied gas representing an outflow cavity.
The dashed black line (case 1) in top panel of Fig. 6 corresponds to the TORUS calculation of the gas temperature for the same model gas density distribution but for a higher luminosity of the central source during the burst, namely . A comparison between those different temperatures is mostly relevant for the envelope (i.e AU), since the radiative equilibrium calculations with TORUS only include heating from the central protostar and no dynamical effects of the gas (e.g viscous heating or compression), which are more important in the disk than in the envelope. This explains the significantly lower temperature obtained in the inner region ( AU) with TORUS compared to , for similar gas density distribution and protostar luminosity. The coupling of the hydrodynamical model with TORUS, providing a more consistent description of heating and cooling processes, is left for future work.
In the outer regions ( AU) the temperature differences between the TORUS temperature (case 1, solid black line) and is less than 30%. Though small, such temperature uncertainty may be relevant if temperatures are close to condensation temperatures, as indicated by the horizontal dotted line for CO condensation in the upper panel of Fig. 6. Reassuringly enough, case 1 with a higher protostar luminosity (dashed black line) shows the overall temperature increase expected during a burst. Such a temperature increase will push regions where CO may condense much further out ( 1000 AU), giving some confidence in the abundance estimate of the gas-phase CO in the envelope derived in §2.3. Moreover, an overall decrease in the gas density with radial distance implies that the typical freeze-out time of gas-phase CO onto dust grains will increase at larger distances, enabling the detection of earlier bursts.
Finally, the blue line in the top panel of Fig. 6 shows the gas temperature calculated by the TORUS code for a spherically symmetric gas density distribution (case 2) representing an infalling spherical envelope with mass equal to the envelope mass in our hydrodynamic model (). The gas density profile in the envelope follows the relation , characteristic for collapsing truncated cores of finite size (Vorobyov & Basu, 2005). The inner and outer radii of the envelope are set to 100 AU and 15000 AU. The temperature difference resulting from different envelope geometries (TORUS case 1 versus TORUS case 2) can be large at 100 AU (about a factor three), but rapidly decreases as a function of radial distance. A spherical envelope is an extreme case, since outflows are expected to create a cavity which can extend as far as several thousand AU or more (Commerçon et al., 2010; Machida et al., 2011b). The spherical case is however interesting since it provides an upper limit to the expected temperature in the envelope. Current assumptions made in the hydrodynamical model are thus not expected to alter the conclusions derived from the predicted gas-phase abundances of CO during and after a burst (§2.3). But the spherical case shows that taking into account the vertical structure of the disk and the envelope is important for a better estimate of the temperature.
The lack of chemical reactions. In the present work, we neglect reactions that can alter the chemical composition of protostellar disks and collapsing envelopes. In particular, Kim et al. (2011) suggest that CO turns into CO2 during the quiescent accretion stage when CO freezes out onto dust grains. They found that up to 80% of the original CO content can be converted into CO2 in the envelope during the main accretion phase. We note, however, that the abundance of the gas-phase CO in the quiescent stage is non-negligible (see Figure 4), owing to a long characteristic freeze-out time, and this may reduce the efficiency of CO to CO2 conversion on the surface of dust grains. Detailed calculations using the grain-surface reactions are needed to estimate the CO depletion due to this effect.
The hybrid cold/hot accretion scheme. In this study, we assumed that a fraction of the accretion energy is absorbed by the protostar when the accretion rate exceeds a critical value of yr-1. Below this value, accretion onto the protostar proceeds in the cold regime, with all accretion energy radiated away. The choice of was motivated by fitting of the spectral energy distribution of FU Orionis by Hartmann et al. (2011), who argued that these eruptive stars undergo expansion during the burst, which in turn indicates that some accretion energy is absorbed by the star. Accretion rates during FU-Orionis-type bursts typically lie in the – yr-1 range. Varying the value of in these limits, will affect the stellar radius and the resulting accretion and photospheric luminosities. However, the total stellar luminosity is not expected to vary significantly because the increase in the accretion luminosity due to, say, decrease in the stellar radius, will be at least partly compensated by the corresponding decrease in the photospheric luminosity.
5 Conclusions
In this paper, we studied the phase transformations of CO and CO2 during the early stages of low-mass star formation characterized by strong luminosity outbursts resulting from accretion bursts. We used numerical hydrodynamics modeling in the thin-disk limit to describe the gravitational collapse of a rotating pre-stellar core, extending our calculations into the disk formation stage and terminating the calculations when most of the initial pre-stellar core has accreted onto the disk plus protostar system. In the early accretion phase, the system experiences repetitive accretion and luminosity bursts caused by disk gravitational fragmentation and quick inward migration of the fragments onto the protostar (Vorobyov & Basu, 2010). The basic hydrodynamics equations were complemented with the continuity equations describing the adsorption and desorption of CO and CO2 onto and from dust grains. We calculated the gas-phase fractions of CO and CO2 ( and ) in the protostellar disk and infalling envelope in the pre-burst, burst, and post-burst phases. We found the following.
-
•
In the quiescent phase characterized by total stellar luminosity of the order of a few , CO in the disk is found mostly in the gas phase, while in the envelope CO has mostly frozen out onto dust grains. CO2 is found in the gas-phase only in the inner 20–30 AU, while in the rest of the disk and envelope CO2 freezes out onto dust.
-
•
During strong luminosity bursts characterized by a total luminosity from a few tens to a few hundreds , CO ice evaporates from dust grains in part of the envelope, while CO2 ice turns into the gas phase only in the inner several hundred AU of the disk.
-
•
The typical time for freeze-out of the gas-phase CO onto dust grains in the envelope (a few kyr) is considerably longer than the typical duration of a luminosity burst (0.1–0.2 kyr). As a result, a significant amount of the gas-phase CO can still be present in the envelope long after the system has returned into the quiescent phase. This phenomenon can be used to infer recent luminosity bursts with magnitudes typical of EX-Lupi and FU-Orionis-type outbursts, as suggested by recent semi-analytical studies by Lee (2007) and Visser & Bergin (2012).
-
•
In contrast, the typical freeze-out time of the gas-phase CO2 is comparable to the burst duration, owing to significantly higher gas densities in the disk. We thus conclude that CO2 is probably not a good tracer for recent burst activity in young protostars.
Regarding uncertainties of the present model, the heating due to stellar irradiation is crucial to derive temperatures in the disk and the envelope. In this work, we tried to estimate uncertainties resulting from approximate treatment of radiative transfer in the hydrodynamical model by comparing temperatures obtained from an improved treatment of irradiation effects based on a radiative transfer code. The results of this comparison indicate that the uncertainty on the predicted temperatures depends on the radial distance from the protostar and the structure of the envelope. However, this uncertainty does not alter our conclusions regarding the abundance of gas-phase CO in the envelope and the possibility to use it as a tracer of recent accretion burst activity. Our short-term plans to reduce the present uncertainties involving (i) the improvement of radiative transfer calculations, based on the coupling between the hydrodynamical model and a radiative transfer code, like e.g TORUS, (ii) the reconstruction of the vertical structure of the disk, in order to improve over the thin disk approximation and (iii) the implementation of a chemical model, which is more challenging but would provide more robust predictions. Finally, an important weakness of our model is the absence of magnetic fields, which are expected to alter the properties of the collapse, the disk (e.g the size) and the accretion process onto the protostar. Inclusion of magnetic field, with the improvement above-mentioned, is a major challenge that will provide the state-of-the-art on a longer term. Three-dimensional non-ideal MHD simulations including radiation hydrodynamics are now underway to explore the second collapse (Masson et al. 2012). The work presented here already provides consistent predictions that can be tested against observations. The increased sophistication on the MHD, thermal and chemical treatments we propose will further improve our understanding of embedded phases and episodic accretion.
6 Acknowledgments
The authors are thankful to Ruud Visser, the referee, for suggestions that helped to improve the manuscript and to Shu-ichiro Inutsuka for stimulating discussions. This work is supported by Royal Society awards WM090065 and RFBR Cost shared application with Russia (JP101297 and 11-02-92601). It was also partly supported by the European Research Council under the European Community s Seventh Framework Programme (FP7/2007-2013 Grant Agreement No. 247060) and by the Consolidated STFC grant ST/J001627/1. The simulations were performed on the Shared Hierarchical Academic Research Computing Network (SHARCNET), on the Atlantic Computational Excellence Network (ACEnet), and on the Vienna Scientific Cluster (VSC-2).
References
- Armitage et al. (2001) Armitage, P. J., Livio, M., & Pringle, J. E. 2001, MNRAS, 324, 705
- Baraffe et al. (2002) Baraffe, I., Chabrier, G., Allard, F. & Hauschildt P. H. 2002, A&A, 382, 563
- Baraffe et al. (2009) Baraffe, I., Chabrier, G., & Gallardo, J. 2009, ApJ, 702, L27
- Baraffe & Chabrier (2010) Baraffe, I., & Chabrier, G. 2010, A&A, 521, 44
- Baraffe et al. (2012) Baraffe, I., Vorobyov, E. I., & Chabrier, G. 2012, ApJ, 756, 118
- Basu & Mouschovias (1994) Basu, S., & Mouschovias, T. Ch. 1994, ApJ, 432, 720
- Basu (1997) Basu S., 1997, ApJ, 485, 240
- Bell & Lin (1991) Bell, K. R., & Lin, D. N. C., 1994, ApJ, 427, 987
- Bisschop et al. (2006) Bisschop, S. E., Fraser, H. J., Oberg, K. I., van Dishoeck, E. F., & Schlemmer, S. 2006, A&A, 449, 1297
- Bonnell & Bastien (1992) Bonnell, I., & Bastien, P. 1992, ApJ, 401, L31
- Bourke et al. (2006) Bourke, T. L., Myers, P. C., Evans, N. J., II, et al. 2006, ApJ, 649, L37
- Chabrier & Baraffe (1997) Chabrier, G., & Baraffe I. 1997, A&A, 327, 1039
- Chabrier & Baraffe (2000) Chabrier, G., & Baraffe I. 2000, ARA&A, 38, 337
- Charnley et al. (2001) Charnley, S. B., Rodgers, S. D., & Ehrenfreund, P. 2001, A&A, 378, 1024
- Commerçon et al. (2010) Commerçon, B., Hennebelle, P., Audit, E., Chabrier, G., & Teyssier, R. 2010, A&A, 510, 3
- D’Angelo & Spruit (2010) D’Angelo, C. R., & Spruit, H. C. 2010, MNRAS, 406, 1208
- Dapp & Basu (2009) Dapp, W. B., & Basu, S. 2009, MNRAS, 395, 1092
- Draine et al. (1984) Draine, B. T., & Lee, H. M. 1984, ApJ, 285, 89
- Dunham et al. (2006) Dunham, M. M., Evans, N. J., II, Bourke, T. L., et al., 2006, ApJ, 65, 945
- Dunham et al. (2010) Dunham, M. M., Evans II, N. J., Terebey, S., Dullemond, C. P., & Young, C. H. 2010, ApJ, 710, 470
- Dunham & Vorobyov (2012) Dunham, M. M., & Vorobyov, E. I. 2012, ApJ, 747, 52
- Enoch et al. (2009) Enoch, M. L., Evans II, N. J., Sargent, A. I., & Glenn, J. 2009, ApJ, 692, 973
- Evans et al. (2009) Evans, N. J., II, Dunham, M. M., Jorgensen, J. K., et al., 2009, ApJSS, 181, 32
- Harries et al. (2004) Harries, T., Monnier, J. D., Symington, N., & Kurosawa, R. 2004, MNRAS, 350, 565
- Harries (2011) Harries, T. 2011, MNRAS, 411, 1500
- Hartmann et al. (2011) Hartmann L., Zhu Z., & Calvet N., 2011, preprint (arXiv:1106.3343)
- Hennebelle & Teyssier (2008) Hennebelle, P., & Teyssier, R. 2008, A&A, 477, 25
- Ilee et al. (2011) Ilee, J. D., Boley, A. C., Caselli, P., Durisen, R. H., Hartquist, T. W., & Rawlings, J. M. C. 2011, MNRAS, 417, 2950
- Johnson & Gammie (2003) Johnson, B. M., & Gammie C. F. 2003, ApJ, 597, 131
- Kenyon et al. (1990) Kenyon, S. J., Hartmann, L. W., Strom, K. M., & Strom, S. E. 1990, ApJ, 99, 869
- Kim et al. (2011) Kim, H. J., Evans, II, N. J., Dunham, M. M., et al. 2011, ApJ, 729, 84
- Kim et al. (2012) Kim, H. J., Evans, N. J., II, Dunham, M. M., Lee, J.-E., & Pontoppidan, K. M. 2012, ApJ, 758, 38
- Lee (2007) Lee, J.-E. 2007, J. Korean Astron. Soc., 40, 83
- Lin & Papaloizou (1986) Lin D. N. C., & Papaloizou J. 1986, ApJ, 309, 846
- Lodato & Clarke (2004) Lodato, G., & Clarke, C. J. 2004, MNRAS, 353, 841
- Lucy (1999) Lucy, L. B. 1999, A&A, 344, L282
- Masson et al. (2012) Masson, J., Teyssier, R., Mulet-Marquis, C., Hennebelle, P., & Chabrier, G. 2012, ApJS, 201, 24
- Machida et al. (2011a) Machida, M. N., Inutsuka, S., & Matsumoto, T. 2011a, ApJ, 729, 42
- Machida et al. (2011b) Machida, M., Inutsuka, S-I., & Matsumoto, T., 2011b, PASJ, 65, 555
- Mathis et al. (1977) Mathis, J. S., Rumpl, W., & Nordsieck, K. H. 1977, ApJ, 217, 425
- McKee & Ostriker (2012) McKee, C., & Ostriker, ARA&A, 45, 565
- Noble et al. (2012) Noble, J. A., Congiu, E., Dulieu, F., & Fraser, H. J. 2012, MNRAS, 421, 768
- Pfalzner et al. (2008) Pfalzner, S., Tackenberg, J., & Steinhausen, M. 2008, A&A, 487, L45
- Pontoppidan et al. (2008) Pontoppidan, K. M., Boogert, A. C. A., Fraser, H. J., et al. 2008, ApJ, 678, 1005
- Shu (1977) Shu, F. S. 1977, ApJ, 214, 488
- Stamatellos et al. (2011) Stamatellos, D., Whitworth, A. P., & Hubber, D. A. 2011, ApJ, 730, 32
- Takeuchi & Lin (2002) Takeuchi, T., & Lin, D. N. C. 2002, ApJ, 581, 134
- Viallet & Baraffe (2012) Viallet, M., & Baraffe, I. 2012, A&A, 546, 113
- Visser et al. (2009) Visser, R., van Dishoeck, E. F., Doty, S. D., & Dullemond S. P. 2009, A&A, 495, 881
- Visser & Bergin (2012) Visser, R., & Bergin, E. A. 2012, ApJ, 754, 18
- Vorobyov & Basu (2005) Vorobyov, E. I., & Basu, S. 2005, MNRAS, 360, 675
- Vorobyov & Basu (2006) Vorobyov, E. I., & Basu, S., 2006, ApJ, 650, 956
- Vorobyov & Basu (2010) Vorobyov, E. I., & Basu, S. 2010, ApJ, 719, 1896
- Vorobyov (2012) Vorobyov, E. I. 2012, Astron. Reports, 56, 179
- Zhu et al. (2010) Zhu, Z., Hartmann, L., Gammie, C., Laura, G. B., Jacob, B. S., & Eric, E. 2010, ApJ, 713, 1134
- Zhu et al. (2012) Zhu, Z., Hartmann, L., Nelson, R. P., & Gammie, C. F. 2012, ApJ, 746, 110