The hybrid solution for the Fundamental Plane
Abstract
By exploiting the database of early-type galaxies (ETGs) members of the survey of nearby clusters, we address here the long debated question of the origin and shape of the Fundamental Plane (FP). Our data suggest that different physical mechanisms concur in shaping and ’tilting’ the FP with respect to the virial plane (VP) expectation. In particular, an “hybrid solution” in which the structure of galaxies and their stellar population are the main contributors to the FP tilt seems to be favoured.
We find that the bulk of the tilt should be attributed to structural non-homology, while stellar population effects play an important but less crucial role. In addition, our data indicate that the differential FP tilt between the - and -band is due to a sort of entanglement between structural and stellar population effects, for which the inward steepening of color profiles () tends to increase at increasing the stellar mass of ETGs.
The same kind of analysis applied to the and data in common with ( throughout the paper) confirms our results, the only remarkable difference being the less important role that our data attribute to the stellar mass-to-light-ratio (stellar populations) in determining the FP tilt. The data also suggest that the FP tilt depends as well on the dark matter (DM) fraction and on the rotational contribution to the kinetic energy (), thus again pointing towards the above mentioned “hybrid solution”.
We show that the global properties of the FP, i.e. its tilt and tightness, can be understood in terms of the underlying correlation among mass, structure and stellar population of ETGs, for which, at increasing the stellar mass, ETGs become (on average) ’older’ and more centrally concentrated.
Finally, we show that a Malmquist-like selection effect may mimic a differential evolution of the mass-to-light ratio for galaxies of different masses. This should be taken into account in the studies investigating the amount of the so called “downsizing” phenomenon.
keywords:
Galaxies: early-types – Galaxies: structures and dynamics – Galaxies: photometry (Visible and Infrared) – Fundamental Plane.1 Introduction
Since its discovery, due to Djorgovski & Davis (1987) and Dressler et al. (1987), the Fundamental Plane (FP), i.e. the relation linking the effective radius (), the central velocity dispersion () and the average effective surface brightness () of early-type galaxies (ETGs):
| (1) |
has been considered a key tool for investigating the physical mechanisms driving their formation and evolution. In fact, the observed tilt of the FP with respect to the virial plane (VP) and its tightness imply a peculiar connection between the structure of the galaxies, their history of star formation and their dark matter (DM) content, offering useful constraints for the theoretical models.
The tilt problem arose from the observation that, under the assumption of homology and constant , the FP coefficients (, ) deviate significantly from the virial expectation (, ). The typical observed values are in fact and in the band, with small variations mainly depending on the adopted waveband (see e.g. Scodeggio et al., 1998; La Barbera et al., 2010).
Since ETGs were considered for a long time “homologous” stellar systems, the FP tilt was originally attributed to stellar population effects, on the basis of the argument that its very existence, under virial equilibrium conditions (and assuming homology) implies a correlation between the dynamical mass-to-light ratio and the galaxy mass: . Faber et al. (1987) found and later, independent analyses found similar values of (see e.g. Pahre et al., 1998b; Gerhard et al., 2001; Borriello et al., 2001; Treu et al., 2005).
Among the factors potentially causing the variation of the mass-to-light ratio along the FP, the stellar metallicity, age and initial mass function (IMF), as well as the DM fraction were first considered. The trend in the mean metallicity seemed a viable option (see e.g. Gerhard et al., 2001), but its effect was estimated to produce only a small fraction of the tilt (see e.g. Djorgovski & Davis, 1987; Djorgovski & Santiago, 1993). Stellar population synthesis models failed to reproduce the tilt (Renzini, 1995), but Chiosi et al. (1998) and Chiosi & Carraro (2002), in the context of a “monolithic” scenario of galaxy formation, were able to explain it using a varying IMF and a different SFH for galaxies of different masses. The existence of a variable IMF is now supported by several papers (see e.g. for a review Kroupa, 2012; Cappellari et al., 2012). However, a drastic IMF variation seems required to produce the observed tilt (see e.g. Renzini & Ciotti, 1993), while a SFH that smoothly varies with mass is more difficult to reconcile with the widely accepted “hierarchical” merging paradigm of the CDM cosmology. A significant contribution of the DM to the FP tilt was excluded by Ciotti, Lanzoni & Renzini (1996, hereafter, C96) on the basis of a fine-tuning argument, but Tortora et al. (2009), estimating the total ratio from simple Jeans dynamical models, found that the DM fraction within the effective radius is roughly constant for galaxies fainter than and turns out to increase for brighter galaxies, thus implying a systematic variation of the dark-to-bright matter ratio along the FP. Padmanabhan et al. (2004) and Hyde & Bernardi (2009) also found evidence that the DM fraction () increases with mass.
The finding by Pahre et al. (1998b) that the tilt is still substantial in the -band, where the luminosity maps the bulk of stellar mass, prompted the search for new explanations of its origin, not directly related to stellar population effects. Many works proposed the alternative scenario in which the “broken structural and dynamical homology” of ETGs is at the origin of the tilt (Hjorth & Madsen, 1995; Prugniel & Simien, 1997; Busarello et al., 1997; Graham & Colless, 1997; Pahre et al., 1998b; Bertin et al., 2002; Trujillo et al., 2004; Nipoti et al., 2006; La Barbera et al., 2010). This interpretation was supported by the observation that ETGs are “non-homologous” stellar systems in both their structure and dynamics (Capaccioli, 1987; de Carvalho & da Costa, 1988; Capaccioli, 1989; Burkert, 1993; Michard, 1985; Schombert, 1986; Caon et al., 1993; Young & Currie, 1994; Prugniel & Simien, 1997). However, C96 claimed that again a strong fine–tuning between stellar mass-to-light ratio and structure (Sersic index ) is required to explain with just structural non-homology both the tilt of the FP and the small scatter around it. The role of non-homology was also excluded by Cappellari et al. (2006) and Cappellari et al. (2012) using integral models of the ETGs mass distribution based on 2D kinematic maps. Along the same vein, Bolton et al. (2008), using the galaxies masses estimated from the gravitational lensing, claimed that structural non-homology does not have a significant role in tilting the FP.
The tightness of the FP relation is particularly important because it provides the strongest constraints on the SFH of galaxies. The origin of the FP scatter was investigated by Forbes et al. (1998) and Terlevich & Forbes (2002), who found a correlation between the residuals of the FP and the age of the galaxies (ETGs with higher/lower surface brightness have younger/older ages). Gargiulo et al. (2009) found that the FP residuals anti-correlate with the mean stellar Age, while a strong correlation exists with . In this case, the distribution of galaxies around the FP is tightly related to enrichment, and hence to the timescale of star-formation. Graves et al. (2009) found that the stellar population variations contribute at most 50% of the total thickness and that correlated variations in the IMF or in the central DM fraction make up the rest. Recently, Magoulas et al. (2012), using a sample of ETGs extracted from the 6dF Galaxy Survey, found that the residuals about the FP show significant trends with environment, morphology and stellar population, the strongest trend being with age.
This short review of the FP problem makes it clear that a general consensus about the origin of its properties is still lacking. In particular the role played by non-homology is far from being fully understood.
In D’Onofrio et al. (2008, Paper-I), we studied the FP of a sample of 1550 ETGs, obtained cross-matching the -band, surface photometry dataset of ETGs from (Fasano et al., 2006; Varela et al., 2009, Wide-field Imaging of Nearby Galaxy-clusters Survey) with velocity dispersions from literature data (Smith et al., 2004; Bernardi et al., 2003). Our main conclusions were the following: 1) the FP coefficients depend on the luminosity range of the ETGs sample under analysis, as well as on the fitting strategy; 2) the FP coefficients do depend on the local density, while they do not depend on the global cluster properties (such as e.g. X-ray emission); 3) the stellar mass-to-light ratio () does not correlate with the -band luminosity, so that a possible role of non-homology in causing the FP tilt should be considered.
In this paper we exploit the spectroscopic and photometric, -band database of ETGs in the survey (Fritz et al., 2007; Valentinuzzi et al., 2009) to complete the analysis of the FP problem.
The paper is organized as follows: in Sec. 2 we present the main equations defining the FP problem. In Sec. 3 we describe the data samples used in this work. In Sec. 4 we derive the FP coefficients for the - and -band. In Sec. 5 we discuss the origin of the bulk of the FP tilt and compare our results with those obtained using the and databases. In Sec. 6 we investigate the origin of the differential tilt observed between the and wavebands. In Sec. 7 we address the problem of the thickness of the FP and its connection with the non-homology of ETGs through the structure–stellar population conspiracy. In Sec. 8 we discuss the variation of the relation with redshift and the occurrence of selection effects. Our conclusions are summarized in Sec. 9, where we also try to probe our findings against the present theoretical models of galaxy formation and evolution.
In this paper we use km sec-1 Mpc-1, and .
2 The FP problem in a nutshell
We assume that ETGs are gravitationally bound stellar systems which satisfy the virial theorem equation:
| (2) |
where is the total galaxy mass, is a proxy for the gravitational radius, and the mean kinetic energy per unit mass. Ideally, all virialized systems should be placed onto the VP in the space defined by the variables , and . Unfortunately, these are not observable quantities. Therefore, in the case of ETGs, the virial equation (2) is usually written as follows:
| (3) |
where is the central velocity dispersion within a fixed aperture, is the equivalent radius of the isophote enclosing half the total galaxy luminosity and takes into account projection effects, density distribution and stellar orbits distribution. The term parametrizes our ignorance about orientation, 3D structure and dynamics of ETGs. The formal expression of assumes and .
Introducing the mean effective surface brightness , one gets:
| (4) |
or, in log units and after some algebra:
| (5) |
where and is the absolute magnitude of the Sun in the given band. In the equation (5), we have replaced the total mass with (stellar mass) and with , where parametrizes our ignorance about the DM content.
This formulation of the Virial theorem is directly comparable with the FP equation (1) empirically derived from observations. It formally illustrates the problem of the FP tilt, given that, in all photometric bands, the observed coefficients of and turn out to be remarkably different from the virial expectation. Since we assume that ETGs are in virial equilibrium, the reason for the observed deviation of the FP coefficients from the virial expectation must reside in the term:
| (6) |
In fact, any systematic dependence of this expression on the position along the FP would produce a displacement (tilt) of the FP from the VP.
According to eq. (6), besides the stellar populations (), the structural and dynamical non-homology ( and , respectively), as well as the dark matter fraction () might contribute to the FP tilt. The relative importance of each factor can be in principle estimated by determining how strongly it correlates with the position along the FP.
In order to parametrize such position, we note that, since each galaxy must simultaneously lie onto the FP and on its proper VP, the right terms of equations (1) and (5) can be equated, thus giving:
| (7) |
The left side of this equation can be computed for each galaxy and represents, for the proper values of and , the difference between the observed FP and a fixed, reference VP [that for which ]. In Section 5 we use such a difference:
| (8) |
to parametrize the position of galaxies onto the FP and we examine how correlates with the observed proxies of the physical factors to which the FP tilt could be ascribed.
3 The WINGS dataset
The present work is based on two data samples extracted from the database. The first one (Sample I) cross-matches the sample of 1550 ETGs used in Paper-I to study the FP in the V-band with the galaxies in a subsample of 26 clusters for which we obtained -band surface photometry (Valentinuzzi et al., 2009; Bindoni et al., 2013). In total we got 620 ETGs. The second dataset (Sample II) contains 214 ETGs and is obtained cross-matching the Sample I with the catalogues of galaxy masses provided by Fritz et al. (2011).
Likewise the -band, the -band surface photometry was obtained using the purposely devised automatic software GASPHOT (Pignatelli et al., 2006), which measured the total luminosity, the effective radii, the mean effective surface brightness and the Sersic index of each galaxy in the clusters. These quantities were derived from a simultaneous best-fit of the major and minor axes growth curves with a Sersic law ( ; Sersic 1968) convolved with the local . The quality of the GASPHOT surface photometry is discussed in Bindoni et al. (2013), but several tests of its robustness can be found in the papers already published by the team (see e.g. Valentinuzzi et al. 2010; Varela et al. 2009; Vulcani et al. 2011). The average uncertainties in the surface photometry parameters are , and for the luminosity, the effective radius and the Sersic index, respectively. It is worth mentioning that the previously defined samples do not include the galaxies for which the uncertainties of the best-fit parameters exceeded three times the upper quartiles of the corresponding distributions (, and for the luminosity, the effective radius and the Sersic index, respectively).
The procedure used to determine the stellar masses of galaxies from the spectra database (Cava et al., 2009) has been exhaustively discussed by Fritz et al. (2007, 2011) and Vulcani et al. (2011). Here we recall that it is based on a spectrophotometric model that reproduces the main features of observed spectra by summing the theoretical spectra of simple stellar populations of different ages. Besides the stellar masses, the tool is able to derive star formation histories, average age and dust attenuation of galaxies. The models rely onto the Padova evolutionary tracks (Bertelli et al., 1994) and use the standard Salpeter (Salpeter, 1955) IMF, with masses in the range 0.15-120 . Besides the stars which still are in the nuclear-burning phase, the stellar mass includes remnants, such as white dwarves, neutron stars and stellar black holes (for details see Fritz et al. 2007). The stellar mass values relative to the whole galaxy bodies are computed by rescaling to the total V-band magnitudes the masses obtained by fitting the optical spectra, which are calibrated on the V-band fiber magnitudes. Since this procedure implicitly assumes there are no color gradients, we correct the stellar masses following the prescriptions of Bell&DeJong (2001) and using the colors measured within the fiber aperture and at a fixed aperture of 5 kpc. In Fritz et al. (2011) it is shown that the (total) stellar masses computed in this way are in fairly good agreement with other independent estimates, leading to an estimated accuracy of dex.
The galaxies were classified as early-types (Ellipticals or S0s) using the automatic tool MORPHOT (Fasano et al., 2012), purposely built for the project. For details about MORPHOT and about the accuracy achieved for our morphological classification we refer to Fasano et al. (2012), where an average of 1.7 is reported for the difference between automatic and visual estimates of the Revised Hubble Type (de Vaucouleurs et al. 1991).
4 The FP in the and bands
In Paper-I we studied the -band FP of the ETGs members of the clusters. Here we exploit the -band extension of the database to derive a -band solution for the FP coefficients. We remind that, according to D’Onofrio et al. (2008), the FP coefficients do depend on the wavelength of observations (see also Scodeggio et al. 1998; La Barbera et al. 2010), on the selection criteria of the galaxy sample and on the environment (see also Desroches et al., 2007; La Barbera et al., 2010).
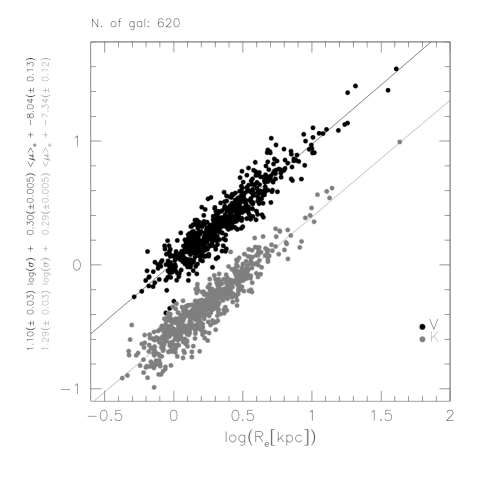
In comparing the - and -band FPs, we are allowed to ignore the selection and environmental effects, since the same galaxies are used in both wavebands. The fitting tool adopted in this work is the same used in Paper-I, i.e. the software MIST, kindly provided by La Barbera et al. (2000). We refer to their paper for any detail about the fitting strategy adopted by MIST. We obtain the following best-fit FPs for our Sample I in the - and -bands:
| (9) |
In our formulation of the FP, is defined as the equivalent (circularized) effective radius in , is the velocity dispersion at in km s-1 and is the mean effective surface brightness in mag arcsec-2. Note that, in spite of the different samples used, the coefficients obtained here for the -band FP are quite close to the values found in Paper-I (, , ; see that paper for a discussion about the FP coefficients obtained using different data samples). Note also that the FP slopes we find are a bit shallower than those generally found in the literature. This systematic difference, already discussed in Paper-I, is likely due to the fitting procedure and to the magnitude limit of the data sample.
The FPs in the - and -band are shown in Figure 1 (see eq. 9 and 4). The scatter around the FP looks very similar in the two bands ( 0.092 and 0.088 for the - and -band, respectively). Taking into account the individual uncertainties of the three observed quantities ( and ), together with the covariance term involving the and uncertainties, we estimated the intrinsic scatter around the - and -band FP to be 0.078 and 0.062, respectively, i.e. nearly half of the total observed scatter.
¿From equations (9) and (4) the FP tilt increases going from the - to the -band. In particular, the gap between the coefficients in the - and -band turns out to be , larger than the estimated fitting uncertainty and in agreement with the value found by Pahre et al. (1998b).
It is worth noticing that, if we assume as independent variable, we obtain the following best-fit in the two bands:
| (10) |
Again, the gap between the coefficients (relative to in this case) in the - and -band turns out to be larger than the estimated fitting uncertainty, thus implying that the difference has a physical meaning.
5 Origin of the FP tilt
¿From now on, unless warning of the contrary, the analysis of the data will be based on Sample II.
Following the logical thread outlined in Section 2, we adopt the difference [see eq. (8)] between the FP and the reference VP defined therein, to parametrize the position of the galaxy in the FP. Then, we analyze the systematic variation along the FP of the different physical factors that might originate the FP tilt.
5.1 Structural non-homology and stellar population effects
| V BAND DATA ( Sample II) = + | ||||||
| r.m.s. | Pearson CC | Spearman CC | Significance | Sample | ||
| -0.335 | 0.088 | -0.800 | -0.800 | e-58 | ALL | |
| -0.196 | 0.138 | -0.225 | -0.241 | e-03 | ALL | |
| -0.585 | 0.122 | -0.541 | -0.530 | e-18 | ALL | |
| 0.239 | 0.134 | 0.330 | 0.325 | e-06 | ALL | |
| -0.325 | 0.072 | -0.886 | -0.880 | e-38 | Es | |
| -0.365 | 0.141 | -0.400 | -0.409 | e-04 | Es | |
| -0.946 | 0.134 | -0.579 | -0.563 | e-09 | Es | |
| 0.477 | 0.153 | 0.214 | 0.140 | 0.100 | Es | |
| -0.307 | 0.085 | -0.731 | -0.758 | e-27 | S0s | |
| -0.074 | 0.119 | -0.105 | -0.136 | 0.180 | S0s | |
| -0.375 | 0.108 | -0.454 | -0.416 | e-07 | S0s | |
| 0.113 | 0.118 | 0.152 | 0.107 | 0.160 | S0s | |
In this subsection, by exploiting our homogeneous sample of ETGs, we examine how correlates with (a proxy of the stellar population) and with Sersic index and ellipticity ( and ). While the Sersic index is commonly considered a robust proxy of the structural (non)homology, the role of the ellipticity in this sense is more controversial. We think that, at least in a statistical sense, the ellipticity should be considered, to all intents and purposes, a crucial ingredient of the galaxy structure, thus being also deeply linked to the structural (non)homology issue. In fact, is well known that different (intrinsic) flattenings usually correspond in ETGs to different shapes (oblateness vs. triaxiality) and luminosity profiles, even leaving aside the obvious prevalence of the composite (bulge+disk) profiles at increasing the ellipticity, due to the increasing fraction of S0 galaxies. In addition, since more flattened ETGs are preferentially fast rotators (Binney, 1978; Cappellari et al., 2007; McCarthy et al., 2012; Emsellem et al., 2011), again in a statistical sense, should be linked to the amount of rotational contribution to the total kinetic energy (). On the other hand, it is hard to deny that a different amount of rotation, by itself, is likely indicative of a different dynamical structure. Therefore, roughly speaking, we might also consider as a sort of indirect proxy of dynamical (non)homology.
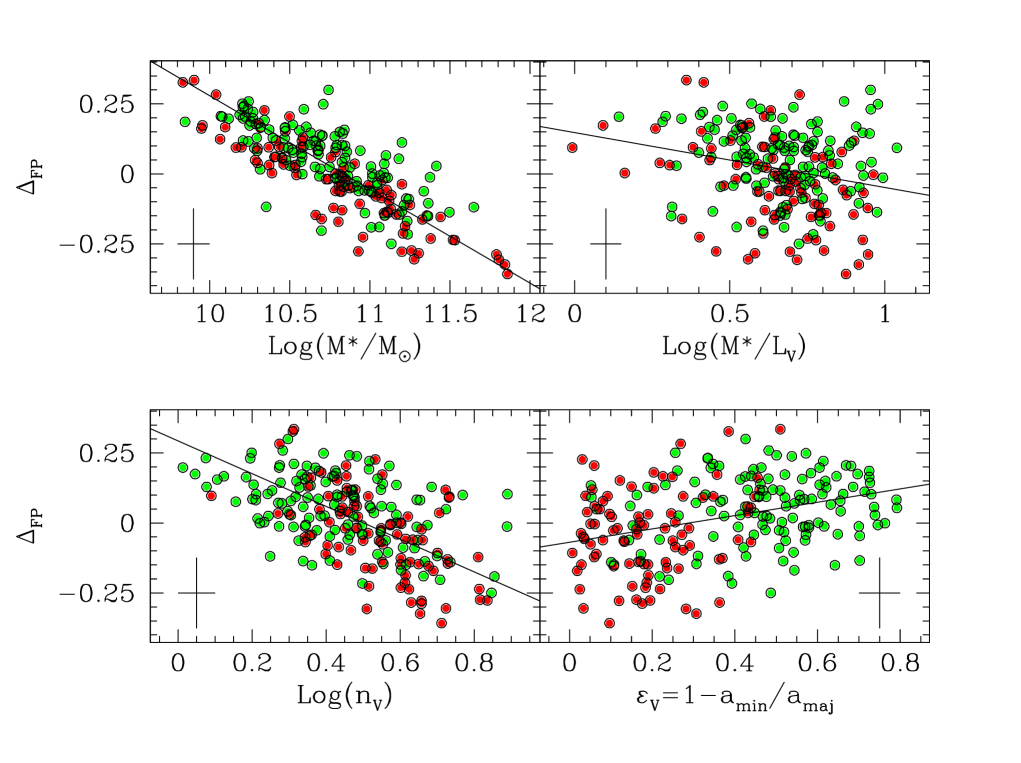
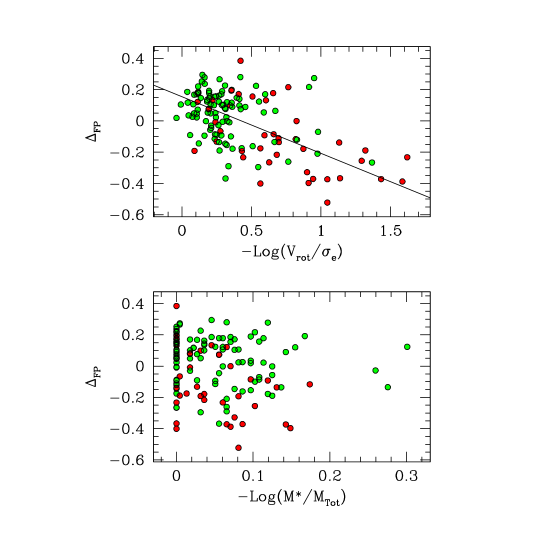
Figure 2 illustrates how , computed from eq. (8) in the -band, correlates with stellar mass and mass-to-light ratio (), Sersic index () and ellipticity (). Ellipticals and S0 galaxies are represented in the figure by red and green dots, respectively. The linear best-fits reported in the plots have been computed through standard least square regression analysis taking into account the individual uncertainties on both variables (the crosses located aside in the plots outline the median uncertainties). Table 1 lists the parameters of both the linear fits and the correlations in Figure 2 for the whole Sample II and for Es and S0 galaxies separately.
Apart from the expected, strong correlation with the stellar mass, the plots in this figure (see also Table 1) show that, among the three quantities we tested for the FP tilt, the Sersic index is the most strongly correlated with (i.e. with the position along the FP), the correlations involving the ellipticity and the stellar mass to light ratio (stellar populations) turning out to be significantly weaker. This holds in both the - and the -band (not reported here), at least for the ETGs sample as a whole.
Besides the slopes and the correlation coefficients (both Pearson’s and Spearman’s ), what enforces the above conclusion are the significances associated to the (see Table 1). These are computed according to Press et al. (1992) and express the probability that the null hypothesis of zero correlation is happening (small values indicate significant correlations). Looking at the and significances reported in Table 1, we note that, for the Es alone, the – correlation is much more significant than for the S0 galaxies alone. We also note in Table 1 that, likely because of the reduced base-line, the correlation between and looks rather weak for Es and S0s separately.
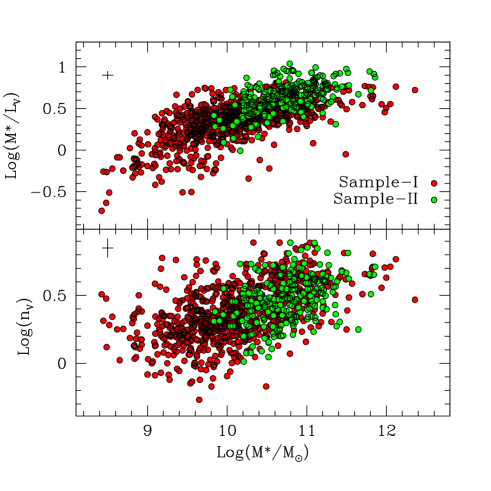
Since many studies have found stellar population properties (e.g. age and metallicity) to increase with galaxy stellar mass, it could look surprising that turns out to be strongly correlated with , while the correlation between and is weak. Does this mean that in our galaxy sample and do not correlate? Furthermore, is there any internal correlation among the four tested parameters (, , and )? Which is the relevant correlation in Figure 2 ?
Figure 3 shows that, for our galaxy sample too, the correlation between and is actually in place, being even slightly more significant than that between and (0.66 vs. 0.55 of ). In Figure 4 it is shown that such a correlation does not translate into a strong correlation between and . This figure shows face-on views of the V-band FP for our Sample II (left panel) and for the subsamples of ellipticals and S0 galaxies (central and right panels, respectively). In each plot, the horizontal straight line marked with VPFP represents the intersection between the FP (coefficients: and ) and an arbitrary, reference VP (coefficients: 2 and 0.4). Thus, the components of the direction vector of such stright line turn out to be: -0.4, 2-, +2. The red arrows in the figure lie onto the FP and, for each tested quantity (, , , and b/a=1-), identify the direction along which it turns to show the strongest correlation. More precisely, spanning the whole round corner (0 to 2), we rotate the coordinate axis along the FP and, for each angle, we compute the correlation coefficients of the various quantities, recording the directions which maximize them. The length of each arrow is proportional to the corresponding maximum value of and the dotted curves correspond to and . In this schematic picture, the arrow relative to must be perpendicular to the straight line VPFP and must have size one by definition.
In Figure 4 both the stellar mass and the luminosity appear to be strongly correlated with the position along the FP, the direction of maximum correlation being in both cases almost coincident, although with opposite direction, with that relative to (upwards arrow with =1 by definition). Also the Sersic index () appears quite well correlated with the position along the FP (especially for Es) and substancially aligned with . The axial ratio (b/a) is generally correlated as well with the position along the FP, but its behaviour depends on the morphological type. In fact, while for Es there is a fair alignment with and a weak correlation, for S0s there is a good correlation, but along a direction almost orthogonal to (this is the reason why the in Table 1 are small in both cases). In general, the stellar mass-to-light-ratio () turns out to be less strongly correlated with the position along the FP and, again, it shows a morphology dependent behaviour. In this case, however, the correlation and the alignment are coupled, both being stronger for Es than for S0s.
The Figure 4 should also help to clarify the question of which are the truly important physical factors originating the FP tilt. The stellar mass is clearly the main driver of the FP tilt and drags the luminosity together. However, this is in some sense an obvious thing, since we would like actually identify the ’mass-driven’ physical quantities which mainly contribute to shape the FP through their influence on the observed parameters (, and ). To this concern, we checked that the residuals relative to the relation do correlate with both the Sersic index () and the ellipticity (), the significance being very high in both cases ().
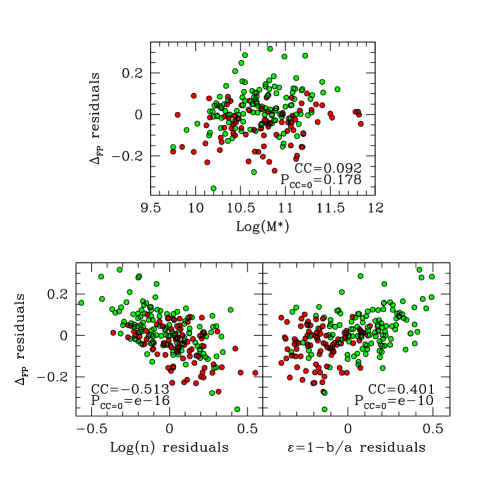
However, since all physical quantities strongly depend on the stellar mass, the above mentioned correlations could be due to the possible (spurious) correlation between residuals and itself. Thus, in order to properly check the existence of additional (mass-free) dependences of , we must look at the correlations between residuals and the residuals of the and correlations. The lower panels of Figure 5 illustrate these correlations, while in the upper panel of the same figure the correlation between residuals and it is shown. From the correlation coefficients and significances reported in the figure, it is clear that residuals do not correlate with , while the correlations with both the Sersic index and the ellipticity residuals are even stronger than previously found for the corresponding, mass-dependent quantities. This led us to conclude that both the Sersic index and the ellipticity are physical factors actively driving the FP tilt.
| value | P() | |||
|---|---|---|---|---|
| -0.115 | 0.041 | -2.793 | 0.0057 | |
| -0.430 | 0.052 | -8.294 | e-14 | |
| -0.108 | 0.042 | -2.540 | 0.0118 |
Further support to this conclusion comes from both the Multi-Variate Regression and the Principal Component Analyses (MVRA and PCA, respectively). Table 2 reports the estimated MVRA coefficients of the relation: =+++, together with the proper standard errors, the relative Student’s statistics and the probabilities that the values are exceeded. Table 2 indicates that the coefficients of all three variables are significant within the errors. A similar indication comes from the PCA, which is not able to reduce the number of significant variables of the previous relation (including of course ), all the four eigenvectors turning out to provide a significant contribution to the total energy content of the relation (49.4%, 23.3%, 17.0% and 10.3%, in descending order).
It is worth mentioning that all the results illustrated in this Section remain unchanged when computing from the coefficients of eq. 10 rather than those of eq. 9, i.e.when using the velocity dispersion (instead of the effective radius) as independent variable in the fit of the FP. The only noticeable difference with respect to the previous finding turns out to be the almost absent correlation between and , with and [P() and ] for the global, elliptical and S0 samples, respectively. This might indicate that the role of stellar populations in determining the FP tilt is marginal, as the strength of the correlation between and seems to depend on the fitting procedure.
We believe that the above findings strongly enough support the conclusion that various physical quantities concur in shaping the FP. Still, in Section 7 we show evidences suggesting that the FP properties (tilt and thickness) altogether could be interpreted as due to the existence of a connection between stellar mass, structure and stellar populations in ETGs (nMML relation; D’Onofrio et al., 2011). In this framework, it would be misleading to attribute the FP properties to the mere summing of the influences of the individual physical quantities, since they are actually entangled through the nMML relation.
5.2 Comparison with ATLAS3D and SDSS data
In order to check the robustness of the results obtained in the previous section from the analysis of the data sample, we perform here a similar analysis using the Project data (Cappellari et al., 2011, C11 hereafter) and a subsample of the and follow-up data (Abazajian et al., 2009). This will allow us to compare with our results and to speculate about the influence of dynamical non-homology and dark matter fraction on the FP tilt. Both the and the magnitudes are corrected for galactic extinction and are given in the -band, AB system.
Among the 260 galaxies of the sample, we selected 232 galaxies classified as early-type (Es and S0s) by C11. For these galaxies, we took from Krajn13 the Sersic index (), derived fitting the -band luminosity profiles with a single Sersic law, and from Cappellari et al. (2013) the dynamical mass-to-light-ratio (), the FP parameters (, and ) and the ellipticity (). All these quantities are derived using the JAM dynamical model (Cappellari, 2008) and the MGE surface photometry tool (Emsellem et al., 1994). To improve the robustness of the analysis, we decided to remove from the sample those galaxies for which the effective radius and the Sersic index uncertainties exceed 2.5 of the relative distributions, as well as the galaxies with extremely faint surface brightness or very small velocity dispersion. We also remove from the sample those galaxies for which the quality flag of the JAM fitting given by Cappellari et al. (2013) is zero (bad fitting). In particular, we kept in the final sample just those galaxies obeying the following conditions: 8, 1.6, 24, 1.5, 0.4, 0.3 and 0, where and are the uncertainties of and , respectively.
For the remaining sample of 137 galaxies, we took from Cappellari et al. (2012) the JAM model stellar mass-to-light-ratio () and from Emsellem et al. (2011) the ratio between the rotation speed and the velocity dispersion. The distances of the galaxies are taken from C11 and are always less than 45 Mpc.
The sample of 817 galaxies we use here ( hereafter) is obtained cross-matching the whole galaxy sample with the galaxies classified as early-type (Es and S0s) in the database. The surface photometry parameters in the (AB)-band, including the Sersic index , , and are taken from Blanton et al. (2003) and are derived fitting the azimuthally averaged radial luminosity profiles of galaxies with a single component Sersic law. The central velocity dispersions () and the ellipticities () come from the database (Abazajian et al., 2009). The stellar masses are taken from the MPA-JHU DR7 release of spectrum measurements () and are obtained by fitting the population synthesis model of Bruzual and Charlot (2003) to the broad bands magnitudes adopting the universal initial mass function (IMF) as parametrized by Kroupa (2001). The total luminosities in th V-band have been obtained from the - and -band total magnitudes from Blanton et al. (2003) using the recipe of Lupton (2005). After conversion to the Vega-mag system, they have been used to compute the mass-to-light ratios . Finally, the distance moduli and the morphological types are taken from the database.
For both the and the samples, we have obtained the best fitting of the FP in the -band using the same fitting algorithm used for the data (MIST). We obtained the following equations:
| (11) |
| (12) |
for the and the samples, respectively.
While the FP coefficients relative to the sample fairly agree with , they turn out to be significantly different from those relative to the sample. Apart from the different wavebands (V for and for ) and luminosity functions of the two galaxy samples, this difference might originate from the different methods used to measure the quantities involved in the FP (, and ). Since it is well known (see for instance Kelson et al., 2000) that the correlated variation of and from different fitting methods has negligible effects on the FP coefficients, we guess the differences we found in this case are caused by differences in the methods used to measure velocity dispersions. Actually, while the of the galaxies are normalized according to the canonical rule proposed by Jorgensen et al. (1996) (), those given in are averaged within the effective radius.
As in the case of the data, through the eq. (8), we computed the quantities for the galaxies of the two samples and correlated them with the various physical parameters supposed to be responsible of the FP tilt. The results are illustrated in the Figures 6 and 7 and in the Tables 3 and 4. Note that, in order to compare with our results about the stellar mass-to-light-ratio, we converted the stellar masses from Kroupa to Salpeter IMF adding 0.13 dex and reported in Fig 7 the in the -band. For the conversion from the (AB)- to the -band we used the equations given in Blanton and Roweis (2007) and the and magnitudes from . For the 41 galaxies not included in the database, we used the (V-R) colors from NED.
| ATLAS3D data sample = + | ||||||
| r.m.s. | Pearson CC | Spearman CC | Significance | Sample | ||
| -0.406 | 0.114 | -0.813 | -0.804 | e-39 | ALL | |
| -0.799 | 0.171 | -0.629 | -0.622 | e-09 | ALL | |
| -0.930 | 0.147 | -0.664 | -0.689 | e-22 | ALL | |
| 0.616 | 0.171 | 0.444 | 0.433 | e-08 | ALL | |
| -0.362 | 0.157 | -0.546 | -0.429 | e-10 | ALL | |
| 0.008 | 0.184 | 0.170 | 0.178 | 0.040 | ALL | |
| -0.406 | 0.100 | -0.891 | -0.889 | e-19 | Es | |
| -1.390 | 0.209 | -0.512 | -0.535 | e-04 | Es | |
| -1.660 | 0.218 | -0.565 | -0.566 | e-06 | Es | |
| -0.364 | 0.229 | 0.161 | 0.159 | 0.310 | Es | |
| -0.376 | 0.176 | -0.585 | -0.594 | e-05 | Es | |
| -0.358 | 0.216 | -0.401 | -0.417 | 0.006 | Es | |
| -0.386 | 0.116 | -0.694 | -0.716 | e-18 | S0s | |
| -0.418 | 0.138 | -0.384 | -0.399 | e-04 | S0s | |
| -0.702 | 0.116 | -0.655 | -0.665 | e-14 | S0s | |
| 0.399 | 0.135 | 0.426 | 0.394 | e-05 | S0s | |
| -0.271 | 0.145 | -0.285 | -0.237 | 0.011 | S0s | |
| 0.137 | 0.148 | 0.140 | 0.141 | 0.167 | S0s | |
| (DR7) data = + | ||||||
| r.m.s. | Pearson CC | Spearman CC | Significance | Sample | ||
| -0.367 | 0.080 | -0.848 | -0.833 | 0.000 | ALL | |
| -1.230 | 0.118 | -0.603 | -0.664 | e-90 | ALL | |
| -0.880 | 0.144 | -0.441 | -0.468 | e-45 | ALL | |
| 0.249 | 0.141 | 0.286 | 0.287 | e-16 | ALL | |
| -0.363 | 0.077 | -0.888 | -0.873 | 0.000 | Es | |
| -1.950 | 0.124 | -0.681 | -0.658 | e-47 | Es | |
| -1.450 | 0.190 | -0.409 | -0.486 | e-18 | Es | |
| 0.561 | 0.173 | 0.104 | 0.095 | 0.077 | Es | |
| -0.359 | 0.076 | -0.828 | -0.834 | 0.000 | S0s | |
| -0.914 | 0.107 | -0.575 | -0.668 | e-60 | S0s | |
| -0.675 | 0.124 | -0.432 | -0.426 | e-24 | S0s | |
| 0.257 | 0.124 | 0.320 | 0.308 | e-12 | S0s | |
Figure 7 and Tables 3 and 4 allow a direct comparison with the results obtained for the sample (see Fig. 2 and Table 1). From this comparison, we draw the following general conclusions: (i) for the stellar mass and the structural parameters and , both relative to the whole samples (Es+S0s) and to the Es and S0s samples separately, the and data produce correlations very similar to the corresponding ones we found for the galaxy sample. Actually, for both and , the from are intermediate between those obtained from the two comparison samples; (ii) the correlation between and turns out to be much stronger for the and samples than for the sample, although for the Es alone the correlation is quite significant as well.
One could speculate that such discrepancy is because the origin of the tilt and scatter of the FP might be not the same for galaxies residing in different environments (i.e. vs. and samples). However, even though the dependence of the FP coefficients on the environment still is a controversial issue (Bernardi et al., 2003; La Barbera et al., 2010), many works have shown the FP tilt and scatter to be nearly the same in different environments (Jorgensen et al., 1996; Pahre et al., 1998a, b; Kochanek et al., 2000; de la Rosa et al., 2001; Magoulas et al., 2012). Since it is hard to believe that different physical mechanisms operating in different environments produce the same FP shape, we are inclined to believe that the origin of the above discrepancy lies in the different recipes adopted to calculate the total stellar mass of the galaxies. We do not enter here in the ample literature debate concerning the theoretical models which better reproduce the properties of the stellar population. We only note that: a) the range of values found with the data is smaller than those provided by and (see Fig. 7); b) the ratios are measured within 1, so they cannot be directly compared with those of and , in particular if one recognizes that strong color gradients exist in ETGs of high mass (see below Fig. 13). Taking into account that the masses are obtained from the analysis of the whole SED of our galaxies and are corrected for color gradients, at variance with those derived by that are based on the line strength index of (Cappellari et al., 2013), we are confident that our masses and measurements are quite robust; c) the observed discrepancy will remain an open problem until new more reliable stellar mass measurements will be available for galaxies.
¿From Figure 6 and Table 3 (just data), we conclude that: (iii) significantly correlates with just for the Es sample; (iv) the correlation between and turns out to be very significant for Es and, to a lesser extent, for S0 galaxies.
Concerning the last point, in the first paragraph of Sec. 5.1 we briefly discussed the role played by both and in the structural and dynamical (non)homology issue. We argued that, at least in a statistical sense, the ellipticity is likely involved in both the luminous and dynamical structure of ETGs. We also argued that, even if specifically indicating the rotational contribution to the kinetic energy, the quantity could also be thought as a rough diagnostic (proxy) of the dynamical structure of ETGs. Here, the similarity of the correlations linking with and for the sample (see left panels of Figure 7 and upper panel of Figure 6), suggests to conclude that, in some sense, and could be though as tokens of the same physical phenomenon. Indeed, in Figure 8 it is shown that a strong correlation exists between and . A question could be raised: which of the two quantities is driving the correlation with ? We tried to answer this question through the analysis of the residuals, but our attempts were unsuccessful, since the CCs and the significances of the residual correlations turned out to be always inconclusive, although for the Es the residuals of the - regression turn out to be marginally correlated with (significance ). In the last part of this sub-section it is shown that the combined MVRA and PCA results seem to favour as driver quantity of the correlation with .
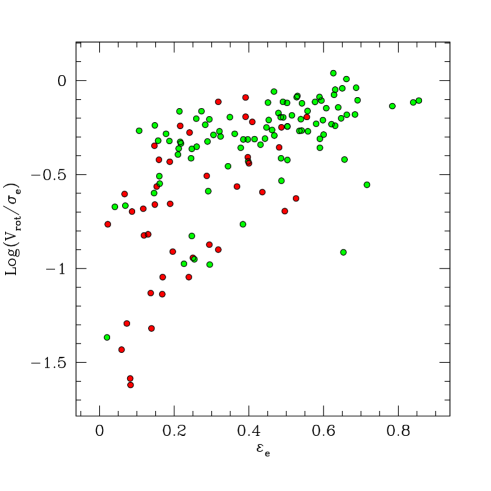
Figure 9 illustrates, for the samples and too, the results of the analysis already performed for the sample about the directions of maximum correlation onto the FP for the various physical parameters possibly involved in its tilt (see Fig. 4). Comparing Fig 9 with Fig. 4, we note that: (v) the arrows relative to and , for all three samples (, and ), are substantially in agreement with each other as far as both the angle and the orientation onto the FP are concerned. The alignment with is pretty good (although with opposite orientation) and the correlation is in general stronger for Es than for S0s; (vi) for the axial ratio (b/a) the agreement among the three samples is less good, but still reasonable if one takes into account the different surface photometry techniques used by the three surveys. In this case the strength of the correlation is greater for S0 than for E galaxies and the alignment with is usually poor.
Finally, from the upper panels of Figure 9 (just sample) we note that: (vi) the arrows relative to both and turn out to be very well aligned with for Es, while there is a substantial lack of alignment for the S0 sample.
¿From the previous points it is clear that the results illustrated in Section 5.1 for the galaxy sample are substantially confirmed by the and galaxies, the main difference being the weaker correlation we found between and for the galaxy sample with respect to the two comparison samples. In general, however, all three data samples support the conclusion that both the stellar populations () and the structural non-homology () are responsible for the FP tilt.
As in the case of the sample, also for the and data, this conclusion is supported by the MVRA (see the first two rows of each sample in Table 5). The conclusions are not so straightforward for the other tested quantities (b/a, and ). In fact, for the and samples, the PCA provides four (marginally five: 46.0%, 22.3%, 12.9%, 9.2%, 6.1% and 3.5%) and three (marginally four: 50.8%, 26.8%, 14.6% and 7.8%) significant eigen-vectors, respectively. The combined inspection of the upper plots in Fig. 9 and of Table 5, seems to indicate that, of the two ’twin’ quantities and (see Fig. 8), the first one might be the most significant (i.e. that driving the correlation with ) for the S0 galaxies, while the last one might be the most significant for elliptical galaxies. Finally, the the dark matter fraction too could be a not negligible ingredient of the FP tilt, at least for Es (see again the upper plots in Fig. 9).
| value | P() | |||
| sample | ||||
| -0.439 | 0.064 | -6.878 | e-10 | |
| -0.456 | 0.059 | -7.692 | e-12 | |
| -0.026 | 0.063 | -0.409 | 0.6830 | |
| -0.119 | 0.037 | -3.228 | 0.0016 | |
| -0.788 | 0.181 | -4.354 | 0.0001 | |
| sample | ||||
| -0.921 | 0.042 | -21.86 | e-16 | |
| -0.341 | 0.028 | -11.86 | e-16 | |
| -0.064 | 0.020 | -3.241 | 0.0012 | |
5.3 The amount of non-homology
The first attempt to estimate the non-homology term defined in eq. 3 for a spherical galaxy can be traced back to Poveda (1968), who derived values around . More recently, Cappellari et al. (2006) compared the virial () and Schwarzschild estimates of obtaining , while Gallazzi et al. (2006) found values between 5 and .
In the previous sub-sections we have found that the dark matter fraction () and the structural and dynamical non-homology (, , ) play a role at least as important as the stellar population effects () in determining the bulk of the FP tilt. These results imply that the term in the expression (6) cannot be constant. This is at variance with the finding of Cappellari et al. (2006) and Cappellari et al. (2012), who claimed that the mass-to-light-ratio has the whole responsibility of the FP tilt, finding an almost constant value of and ruling out the non-homology as a possible driver of the tilt itself.
Trying to clarify this point, we used the data to compute from eq. (6) and from the ralation (see Section 2), where . We also computed (again from eq. 6) for both the and data. In the left panel of Figure 10 we show the distribution of for the sample.
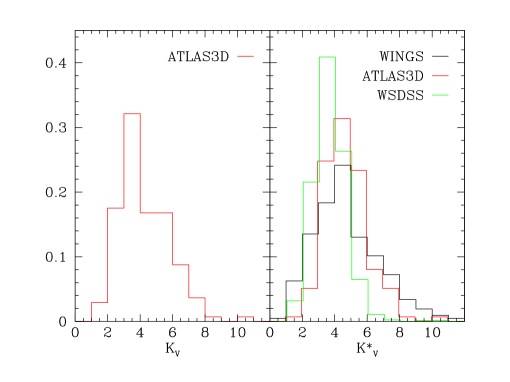
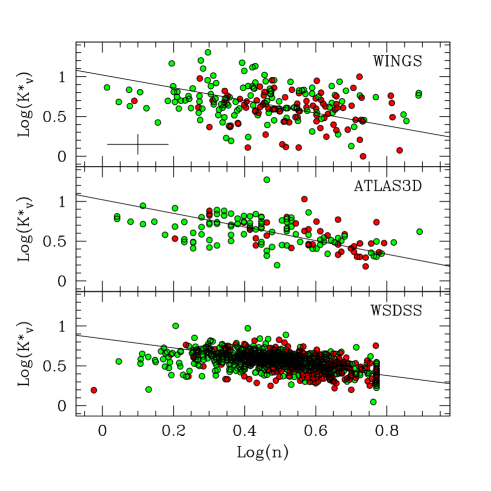
The distribution of the sample looks at variance with the very finding claimed by Cappellari et al. (2006) and Cappellari et al. (2012) about the small scatter of (). We guess that, rather than to the scatter, such a small value actually corresponds to the estimated uncertainty found by Cappellari et al. (2006) for the best-fit slope of the relation between the virial and Schwarzschild estimates (see Fig.13 therein). In the right panel of Figure 10 we compare the distributions of the obtained for all three samples (, and ). We remind that, according to its very definition (see Sec. 2), besides the structural and dynamical non-homology, the term also parametrizes the dark matter contribution (unknown, in the case of the and samples). The distribution for the sample, where the dark matter contribution has been directly estimated, turns out to be in fair agreement with (although narrower then) that of the sample and slightly shifted upwards with respect to that of the sample. Actually, the three distributions are not so different and, in any case, the statement about the constancy of and does not seem to be supported by the observations. This is also illustrated in Figure 11, where is shown to depend on the Sersic index in all three samples.
5.4 The hybrid solution
In this Section we have strongly promoted the so called ‘hybrid solution’ of the FP problem. As already pointed out in the introduction, the idea is actually not new at all. Several previous works have also found that different physical mechanisms might concur in shaping the FP (tilt and thickness; see e.g. Ciotti, Lanzoni & Renzini, 1996; Prugniel & Simien, 1997; Pahre et al., 1998b, among others). In their pioneering paper, C96 first highlighted, from a theoretical point of view, that a fine-tuning is required to explain the FP tilt with single physical effects, such as e.g. structural non-homology or DM distribution. They concluded that: ”…it remains the possibility of a hybrid origin for the tilt, with more than one effect contributing to tilting the FP, for example a small progression of anisotropy, DM concentration, and shape , coupled with a modest increase of .” Prugniel & Simien (1997) suggested that, adding together the contributions of stellar population effects, rotational support, and non-homology, one can fully account for the tilt of the FP. Pahre et al. (1998b) presented a comprehensive model in which stellar population gradients and systematic deviations of the internal dynamical structure of ETGs from the homology, simultaneously explain the differential tilt of the FP among different bandpasses, the slope of the near-infrared FP and the slope of the relation.
Our approach is in the groove of the hybrid solution, but differs from the previous ones since we do not try to attribute the FP properties to the mere addition of several contributors. Instead, supported by our data, we believe that the various physical mechanisms shaping the FP are mutually entangled. In our picture, according to the relation found by (D’Onofrio et al., 2011, see Section 7), at increasing the stellar mass, ETGs become (on average) ’older’ and more centrally concentrated. Such twofold behaviour is due to the fact that the old stellar populations tend to be more centrally concentrated than the young ones (Fig. 13). In the following sections, we show that, besides to easily explain the differential FP tilt between the V- and K-band, this natural fine-tuning mechanism might also drive the main FP properties (tilt and thickness).
To this concern, we note that it would be misleading to believe that, in the hyperspace defined by , , , , , (and possibly and DM fraction), the hybrid solution implies the existence of an hyperplane around which galaxies crowd with a scatter significantly smaller than that around the FP. First of all, if we assume that the scalar Virial Theorem is governing the galaxy structure and dynamics, the only hyperplane around which all galaxies are distributed with a scatter just due to measurement errors is that expressed by the eq. 4. In this equation, besides the observables , and , we have to deal with the unknown quantities and . Since we adopt , , , and the dark matter fraction as proxies of and , the fact that depends on these quantities just tells us that each galaxy contributes to the FP tilt through its own and . Moreover, since the above proxies are only approximately correlated with and , if we use them, together with , and , to form an hyperspace, we introduce the additional (intrinsic) scatter of the correlations between and the quantities , and , as well as that relative to the correlation between and . Thus, we expect that around the hyperplane the scatter is not smaller than that found around the FP. This unfailingly happens. In fact, the scatter of galaxies in our Sample-II around the hyperplane best fitting the quantities , , , , and turns out to be , quite similar to that found in Sec. 4 around the FP in both the V- and K-band.
6 Origin of the differential tilt
Following the same logical thread of Sec. 5 and using our Sample II, we investigate in this section the origin of the differential FP tilt observed between the - and -band. In this case we parametrize the position of galaxies on the FPs through the difference between the planes themselves [eq. (9) and (4)], averaged over the values of in the two bands (the velocity dispersion being the same in both equations). In practice, we assume the analogous of (see eq. 8) to be, in this case, the quantity:
,
where ,, and ,, are the FP coefficients and average surface brightness in the V- and K-band, respectively, while the term parametrizes the band-averaged position of each galaxy along the axis. Then, we look whether such quantity correlates with some proxies of the stellar population and luminosity structure.
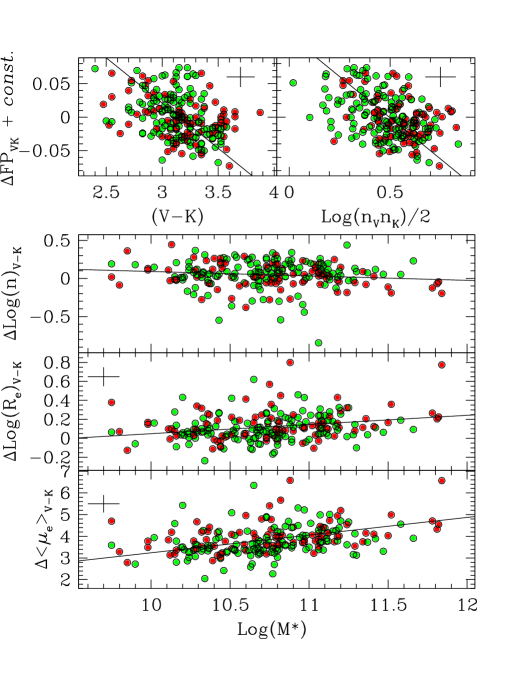
In the two topmost panels of Figure 12 the above correlations are shown for the galaxies in our sample. In particular, the color [] and the band-averaged logarithm of the Sersic index are used as proxies of the stellar population and structure, respectively. In both cases the correlations are clear ( and , respectively, with high significances in both cases), thus indicating that both the stellar population and the luminosity structure contribute to the FP tilt difference between the - and -band. How these factors operate in producing such a result is clarified by the Figure 13 and by the three bottom panels in Figure 12.
Figure 13 shows the average color profiles of ETGs in our sample for different stellar mass intervals. The color profiles are derived from the GASPHOT growth curves, corrected for galactic extinction and K-correction and binned as a function of . Besides confirming the well known inward reddening of ETGs, the Figure 13 shows that their average color gradients are quite shallow for galaxies in the low/intermediate mass regime [], becoming relevant for more massive objects. We do not investigate here the origin of such different gradients (which of course can be related to metallicity effects and to the different star formation histories of ETGs). We just note here that our result is in good agreement with the finding of La Barbera et al. (2010), which is based on a much larger sample (but see Tortora et al., 2010, for a different result). It suggests that the differential FP tilt between the - and -band is originated by the different behaviour of the average luminosity profiles for different ranges of stellar mass in the two wavebands. In fact, Figure 13 shows that, at increasing the stellar mass, the old (red) stellar population tends to be more centrally concentrated, most of the difference concerning massive galaxies []. This color behaviour produces the trends observed in the bottom panels of Figure 12. In fact, it implies that, at increasing the stellar mass, the luminosity profiles of ETGs appear progressively steeper (inward) in the - than in the -band [decreasing and increasing and ]. Since the position of galaxies on the FP also corresponds to a mass sequence (see upper-left panel of Fig. 2; see also Fig. 4), the trends shown in the bottom panels of Figure 12 produce, in turn, the differential tilt between the - and -band. In some sense, saying that the differential FP tilt between the V- and K-band is due to the mass-dependent spatial distribution of stellar populations inside ETGs (i.e. stellar population effects) is equivalent to say that it is due to the different behaviour of the luminosity profiles in the two bands as a function of stellar mass (i.e. structural effects). This means that a sort of entanglement between structural and stellar population effects is at the origin of the differential tilt between the V- and K-band. We note in passing that, if we try to figure out the above reasoning in the viewpoint of the usual vs. non-homology diatribe, the differential FP tilt between the - and -band must be ascribed to both the luminosity structure (different luminosity profiles in the two bands: non-homology) and stellar population () effects, the two contributions being mutually entangled.

As already noted at the end of Sec. 5.1 for the results illustrated therein, the findings in this Section and the related analyses remain unchanged when computing from the coefficients of eqs. 10 and 4 rather than those of eqs. 9 and 4, i.e.when using the velocity dispersion (instead of the effective radius) as independent variable in the fit of the FP. However, similarly to what noted for in Sec. 5.1, the color turns out to be less strongly correlated with than in the usual FP formulation ( vs. ), again suggesting that the influence of the stellar populations on the FP tilt is rather uncertain.
7 The thickness of the FP
In Section 4 we have shown that the thickness of the FP cannot be entirely due to observational errors. These can contribute to nearly half of the observed scatter of . The additional (intrinsic) scatter of the FP implies that ETGs do not deviate from the plane more than . As mentioned in the introduction, this scatter has been mainly attributed to stellar population effects through the age of galaxies.
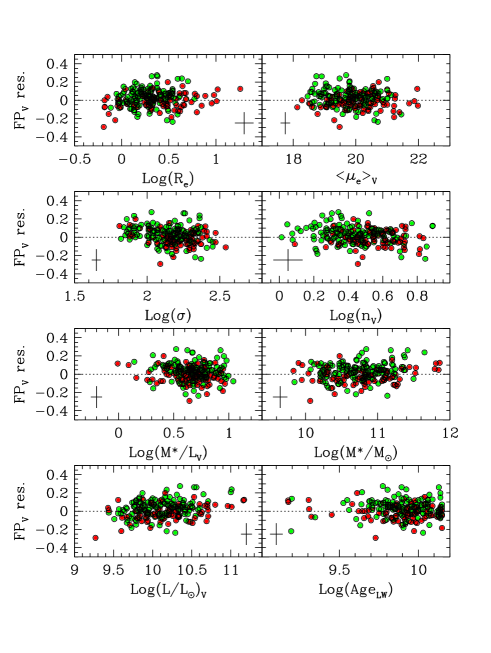
Figure 14 shows the residuals of the best-fit FP in the -band (eq. 9) for the galaxies in our Sample II as a function of some interesting quantities. No significant trends are found, in particular with the luminosity weighted Age. The weak correlations with and is likely indicating that the main driver of the FP residuals is the selection effect connected with the data sample used (i.e. with the range of stellar masses and total luminosities). This would confirm the suggestion given in Paper-I that the FP is likely a bent surface and that a careful choice of the data sample is mandatory before drawing any conclusion about the FP properties (including thickness; see also Section 8).
In lack of any clear indication coming from the analysis of the residuals, we may wonder about whether the observed scatter around the FP is consistent with our finding that the FP tilt is originated by the simultaneous influence of different physical factors (non-homology, mass-to-light-ratio, dark matter fraction).
According to C96, even if the range of Sersic indices spanned by ETGs is in principle able to explain by itself the observed FP tilt, the small scatter around the plane would require in this case an ’ad-hoc’ fine-tuning. Using dynamical, isotropic models of spherical galaxies with Sersic profiles and without DM, C96 found that the observed FP tightness would require a tight correlation between the Sersic index () and the parameter of the -space defined by Bender, Burstein & Faber (1992) []. In particular, if the FP tilt is entirely due to Sersic index variation, the maximum allowed range of at any given should not exceed (Figure 5 therein). Instead, using the small dataset of Virgo galaxies studied by Caon et al. (1993), C96 claim that the observed scatter of the - relation turns out to be nearly 3 times larger (Figure 6 therein).
Here, using the ETGs in our sample, we show that the intrinsic scatter of the relation may be consistent with the required theoretical strip defined by C96.
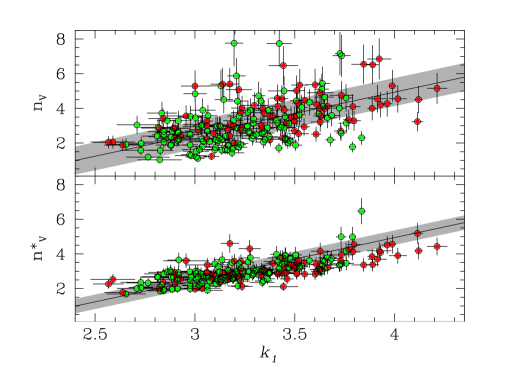
The upper panel of Figure 15 shows the relationship between and for the -band. Once the uncertainties on both coordinates ( and ) are taken into account, the intrinsic scatter of the relation (gray strip in the figure) turns out to be: 1.58. This means that the intrinsic variation of at each is just a factor larger than the theoretical strip. Taking into account that such strip is obtained assuming spherical, isotropic models without DM and that the structural non-homology is likely not the only contributor to the FP tilt (as assumed by C96), we can guess that for our galaxy sample the intrinsic range of variation of at each might be comparable to the theoretical one (). Therefore, the ’ad hoc’ fine-tuning required by models seems to be actually in place and we are lead to conclude that even the structural non-homology alone might simultaneously explain the tilt and the tightness of the FP.
Trying to identify the origin of such fine-tuning, we recall that D’Onofrio et al. (2011) discovered a bi-variate correlation linking , and (nMML relation, hereafter). The best-fit of this relation for our galaxy Sample II in the V-band turns out to be:
| (13) |
with .
The existence of a relationship between structure, mass and stellar populations in ETGs has been claimed in various ways in the literature. Valentinuzzi et al. (2010) (see also Poggianti et al., 2012) found that both in clusters and in the field, at a given galaxy size, more massive objects have older luminosity weighted ages, while at a given mass, larger galaxies have younger luminosity weighted ages, i.e. there is a correlation between compactness and age of ETGs. More recently, Wuyts et al. (2011) confirmed that objects with different Sersic index populate in a different way the SFR-Mass relation, built for the whole Hubble sequence (their Figure 1).
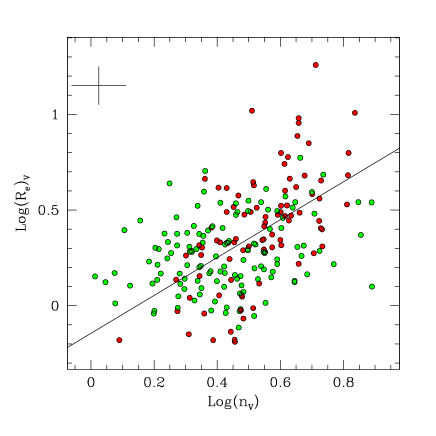
It is worth stressing that the direction of the nMML relation is in agreement with the findings of Valentinuzzi et al. (2010) and Poggianti et al. (2012). In fact, given the well known direct correlation between the Sersic index and the effective radius (see Fig. 16; see also Caon et al., 1993, Fig.5 therein), the equation (13) confirms the above mentioned link between age and compactness. Therefore, the nMML relation coexists with the FP relation and could actually represent the conspiracy between stellar population and structure (fine-tuning) which, according to C96, is required to explain the FP tightness if non-homology is responsible of the FP tilt.
As an exercise, we plot in the lower panel of Figure 15 the same relation shown in the upper panel, but replacing the observed value of the Sersic index () with the one () obtained through eq. (13). The uncertainties in this figure are computed by error propagation. It is interesting to note that the intrinsic scatter of the new relation - () turns out to be fully consistent with the above mentioned, ’theoretical’ one. It is also worth stressing that this very tight relation involves four largely independent quantities, i.e. and for the abscissa, and for the ordinate.
Finally, we note that the nMML relation is someway implicit in the above eq. (6). In fact, using the correlation
| (14) |
shown in the uppermost panel of Figure 11 between and (the last one computed from eq. 6) and the correlation between and shown in the upper-left panel of Figure 2 (see the corresponding linear coefficients in Table 1), the equation (6) takes the form:
| (15) |
which, given the large fitting uncertainties, turns out to be remarkably similar to eq. (13). Thus, the nMML relation seems to simultaneously explain the tilt and the tightness of the FP. In some sense, the very existence of the FP tilt seems to imply the FP tightness, i.e. the two things appear to be entangled through the nMML relation.
8 The mass-to-light ratio of high redshift galaxies
Since structure and stellar population of ETGs seem to be linked each other, the common practice of deriving the total mass-to-light ratio () of ETGs by means of the FP assuming the perfect homology () might be not correct, in particular for high redshift galaxies. It is well known that the FP coefficients are believed to vary with redshift, both in clusters (see e.g. van Dokkum & Stanford, 2003; Di Serego Alighieri et al., 2005; Jorgensen et al., 2006) and in the field (Treu et al., 2005). If one uses the FP relation to derive the dynamical assuming the homology, the above variation implies a progressive change of the mass-to-light ratio with redshift: (see e.g., Treu et al., 2005). This behavior has been commonly explained invoking the “downsizing” phenomenon (see e.g. Di Serego Alighieri et al. 2005; Jorgensen et al. 2006), i.e. the idea that the mass-to-light ratio evolves at different rates for low and high mass galaxies. Actually, while for massive galaxies the FP appears nearly unchanged since , for low-mass galaxies a progressive displacement from the local FP is observed at increasing redshift (van der Wel et al., 2005; Treu et al., 2005).
In this section we indicate two warnings about this kind of reasoning. The first one is that the existence of the nMML relation implies that, besides the stellar populations, the galaxy structure too varies with redshift (see e.g., Chevance et al., 2012). The second one is that a Malmquist bias might mimic the “downsizing” phenomenon. This should advise people to carefully take into account both effects before drawing any conclusion about the evolution of the mass-to-light ratio.
In order to illustrate the above mentioned second warning, we first derived the FP coefficients using the high redshift data of Di Serego Alighieri et al. (2005), obtained from the K20 survey at redshift (Cimatti et al., 2002). We choose these data for our analysis because all the values of the Sersic index , the dynamical masses, and the total luminosities in the band rest frame of the galaxies are given for this sample, allowing a direct comparison with the data. The fit of the FP with our MIST procedure provides the following coefficients for the high redshift dataset:
| (16) |
with errors in the coefficients , and , respectively. In this formulation is given in and in . These values of the FP coefficients are very close to those obtained by Di Serego Alighieri et al. (2005). Comparing these coefficients with those observed in the band rest-frame for Coma by Jorgensen et al. (1996), the authors concluded that the strong tilt difference between low and high redshift FPs implies the existence of a “downsizing” mechanism, i.e. a different time-scale variation of the dynamical ratio for low and high mass galaxies. In addition, they showed that the relation derived from the FP at high redshift is quite different from that derived using a low redshift dataset of ETGs.
In Paper-I, based on a much larger galaxy sample, we found that the FP is likely a bent surface (see also Desroches et al. 2007) and that this produces a systematic variation of the FP coefficients at varying the bright-end cut-off of the galaxy sample.
Trying to check if this effect could result in a sort of Malmquist bias when moving at high redshift, we have obtained, for each galaxy in our sample, a rough estimate of the dynamical mass from the virial eq. (3) using the expression of (as a function of ) proposed by Bertin et al. (2002) for one-component, spherical, non-rotating, isotropic stellar systems:
| (17) |
Figure 17 reports the slopes of the best-fit regressions obtained for different cut-off magnitudes from our galaxy sample in the - and the -bands (black and grey dots, respectively).
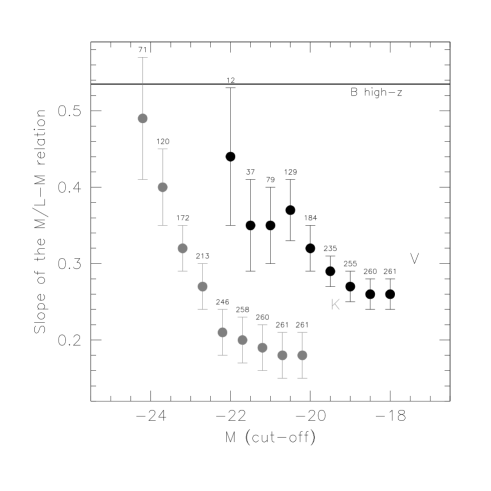
This figure shows that the slope of the relation in the and bands increases when the cut-off luminosity increases (as it occurs for high redshift data sample that progressively loose faint objects). The same result is obtained when the mass-to-light ratio is derived from the combination of the FP and VP equations (eq. 1 and 4, respectively), i.e. taking into account the variation of the FP coefficients with the cut-off luminosity. Using the high redshift data provided by Di Serego Alighieri et al. (2005, Table 2 therein), we derived a slope of 0.51 for the relation at high redshift (see the horizontal line in Figure 17). Note that Figure 8 in Di Serego Alighieri et al. (2005) gives a cut-off magnitude for their high redshift sample at , which roughly corresponds to and (assuming the typical colors of ETGs: and ). It follows that the trends shown in Figure 17 could be (at least in part) due to the observed change in the FP coefficients and in the slopes of the relation that occur when the sample is progressively cut by simulating high redshift observations.
We are aware that many works have shown in different ways that M/L evolves differently as a function of mass (see above references). Here, we just wish to warn that for high redshift samples the selection effects must be carefully taken into account before attributing entirely to the “downsizing” phenomenon the changes of the relation with redshift.
9 Discussion and conclusions
Our analysis strongly suggests that the FP properties can be explained only within an “hybrid” framework, in which several physical mechanisms are at work together. They are: (i) the non homologous structure and dynamics of ETGs; (ii) the stellar population variation along the sequence of galaxy masses; (iii) the increasing DM fraction within at increasing the galaxy mass.
In this work we have shown that the conspiracy between stellar population and galaxy structure, which has been invoked by C96 to explain the FP properties with just non-homology, does actually exist and takes the form of the nMML relation. According to this relation, for a given stellar mass, galaxies with high (low) Sersic index values, have high (low) values of . The coupling of structure and the stellar population variations along the FP seems to be an important physical mechanism behind its properties, since it turns out to simultaneously explain the tilt and the scatter of the FP. The data also suggest that the above mentioned conspiracy between structure and stellar population is not the only mechanism at work. In fact, the DM fraction seems also to play a role in shaping the FP, although both the sign and the strength of the correlation with turn out to be different for Es and S0 galaxies (see Fig. 9 and Tab. 3). This again support the “hybrid” scenario to explain the FP properties.
Although the recent huge progresses of numerical simulations have produced massive ETGs resembling the real ones and obeying the most important scaling relations, at present we are not aware of theoretical models of galaxy formation and evolution able to simultaneously explain the FP, the nMML and the DM variation with stellar mass.
Some interesting numerical simulations have shown that a series of minor merging events (either dry or partially wet), could modify the size of the galaxies and form extended stellar envelopes, while the stellar density and the velocity dispersion decreases with time (see e.g. Nipoti et al., 2009; Bezanson et al., 2009; Naab et al., 2009; Hopkins et al., 2009; Oser et al., 2012). This is the so called inside-out mechanism of galaxy formation, predicting that the oldest and most massive galaxies have very small sizes and are more compact than present day objects. Several observations seem to confirm such hypothesis (Daddi et al., 2005; Trujillo et al., 2006; van Dokkum et al., 2008; Cimatti et al., 2008; van der Wel et al., 2008; Damjanov et al., 2009; Chevance et al., 2012, see e.g.), even if other works found that the size evolution of individual galaxies is modest when the age-size-mass relation is taken into account (Valentinuzzi et al., 2010; Poggianti et al., 2012; Saracco et al., 2012). Unfortunately, the minor merging scenario largely fails to reproduce the numerical evolution of ETGs, given that the number density of ETGs turns out to be 25 times larger today than at z2.5, thus preventing the size evolution of individual galaxies to be responsible of the claimed mass-size evolution.
The semi-analytical models of hierarchical formation (see e.g., De Lucia et al., 2006; Almeida et al., 2007; González et al., 2009; Parry et al., 2009; De Lucia et al., 2011) have also successfully explained several observed features of ETGs, but fail in others. In particular they overestimate the number of faint objects, under predict the sizes of bright ETGs, and fail in reproducing the -enhancement that increases with the mass of the galaxies. Moreover, it is not clear how such models could be connected with the observed nMML relation.
A primordial activity of merging at is not excluded by Merlin & Chiosi (2006, 2007), who suggested that a series of merging of small stellar subunits could lead to the formation of massive objects resembling the real ones in their morphology, density profiles, and metallicity. In their scheme, a first generation of star clumps inside primordial haloes of DM enriched the medium in metals and made up the building blocks of larger systems with masses up to . The hydro-dynamical simulations of Merlin et al. (2012) include radiative cooling, star formation, stellar energy feedback, re-ionization, and chemical enrichment. They reproduce many observed features of ETGs, such as the mass-density profiles, the mass-radius relation, the mass-metallicity relation, etc. In their scheme objects with the same initial mass might have experienced different star formation histories depending on the initial halo over-density: the deeper the perturbation, the more peaked, early and intense the star forming activity. This kind of behavior could provide a viable explanation for the existence of the nMML relation.
According to Nipoti et al. (2006), the dissipationless collapse of initially cold stellar distributions in preexisting DM haloes had an important role in determining the observed weak homology of ETGs. The end-products of their N-body simulations of collapses inside DM halos have significant structural non-homology, with the Sersic index spanning the interval . Remarkably, their parameter correlates with the DM fraction present within , being smaller for larger dark-to-visible mass ratios. Unfortunately, such models do not follow the star formation activity, so we do not know if they are consistent with the nMML relation.
Hopkins et al. (2008) found that also the dissipational collapse following the major merging of gas rich spirals could be usefully employed to interpret the FP properties, the size-mass and velocity dispersion-mass correlations. Their results, however, do not assign to non-homology a key role in tilting the FP, contrary to our finding. It is also not clear whether the major merging hypothesis, coupled with the dissipational collapse, might be in agreement with the nMML relation.
We actually believe that still much theoretical work should be done before the problem of the formation of ETGs will find a robust and definitive solution within the “hybrid” scenario strongly supported by our analysis, whose main conclusions are the following:
-
•
the tilt of the FP in the -band is significantly smaller than in the -band, but still substantial;
-
•
other than to the change of the stellar populations with galaxy mass, the bulk of the tilt in both wavebands can be attributed to a systematic variation of the structure of ETGs as a function of mass. This is proved by the observed dependence of the quantity (difference between the FP and a reference VP) on the Sersic index and on the axis ratios of the galaxies. This “hybrid” interpretation of the FP tilt, based on our WINGS galaxy sample, is also confirmed by the analysis of the and samples, for which the influence of the stellar mass-to-light-ratio on the FP tilt turns out to be greater than for the sample;
-
•
using the data from the project and at variance with their claims, we find that again the “hybrid” interpretation of the FP should be preferred, since dynamical non-homology and DM effects seems also to play a significant role in producing the tilt;
-
•
both the Principal Component and the Multi-Variate Regression Analyses suggest that most of the previously mentioned physical factors significantly contribute to the FP tilt. Again, this points towards an “hybrid” solution of the FP problem;
-
•
the differential tilt in the - and -band should be ascribed to the entangled variation of structure and stellar population between the two bands. This variation reflects the mass dependent color gradients () likely originated by metallicity effects;
-
•
the tilt and the small scatter around the FP are likely originated by the conspiracy between structure and stellar population, through the relation that works as a fine-tuning mechanism preserving the tightness of the FP plane along the whole sequence of masses. According to this relation, at increasing the stellar mass, ETGs become (on average) ’older’ and more centrally concentrated. Such twofold behaviour is due to the fact that the old stellar populations tend to be more centrally concentrated than the young ones, this fact being also responsible of the differential FP tilt between the V- and K-band;
-
•
the different slope of the dynamical relation at low and high redshifts must be used with care to derive the amount of the “downsizing” mechanism, since selection effects acting on the galaxy samples (i.e. the Malmquist bias) mimic a differential rate of the evolution for small and massive ETGs.
Acknowledgments
We warmly thank the anonymous referee for his comments and suggestions that have greatly helped us to improve the paper. We also acknowledge the partial financial support by contract INAF/PRIN 2011 Galaxy Evolution with the VLT Survey Tele- scope (VST) and PRIN-MIUR 2009 ”Nature and evolution of superdense galaxies”. Credits are finally due to the and collaborations for the data used in this work.
References
- Abazajian et al. (2009) Abazajian, K. Adelman-McCarthy, J. K., Agüeros, M. A. et al. 2009, ApJS, 182, 543
- Allen et al. (2006) Allen P.D., Driver S.P., Graham A.W., Cameron E., Liske J., De Propris R., 2006, MNRAS, 371, 2
- Almeida et al. (2007) Almeida C., Baugh C. M., Lacey C. G., 2007, MNRAS, 376, 1711
- Bell&DeJong (2001) Bell, E.F., & de Jong, R.S. 2001, ApJ 550, 212
- Bender, Burstein & Faber (1992) Bender R., Burstein D., Faber S.M., 1992, ApJ 399, 462
- Bernardi et al. (2003) Bernardi M., Sheth R.K., Annis J., Burles S., Eisenstein D.J., et al. 2003, ApJ, 125, 1866
- Bertelli et al. (1994) Bertelli G., Bressan A., Chiosi C., Fagotto F., & Nasi E. 1994, A&AS, 106, 275
- Bertin et al. (2002) Bertin G., Ciotti L., Del Principe M., 2002, MNRAS, 386, 149
- Blanton et al. (2003) Blanton M.R., Lupton R.H., Schlegel D.J., Strauss M.A., Brinkmann J., Fukugita M., Loveday J., 2003, ApJ, 594, 186
- Blanton and Roweis (2007) Blanton M.R., Roweis S., 2007, AJ, 133, 734
- Bezanson et al. (2009) Bezanson R., van Dokkum P.G., Tal T., Marchesini D., Kriek M., Franx M., Coppi P., 2009, ApJ 697, 1290
- Bruzual and Charlot (2003) Bruzual G., Charlot S., 2003, MNRAS, 344, 1000
- Bindoni et al. (2013) Bindoni D., et al., A&A in preparation
- Binney (1978) Binney J., 1978, MNRAS, 183, 501
- Binney and Tremaine (1987) Binney J., Tremaine S.D., 1987, Galactic Dynamics. Princeton Univ. Press, NJ
- Borriello et al. (2001) Borriello A., Salucci P., Danese L., 2003, MNRAS, 341, 1109
- Bolton et al. (2008) Bolton A.S., Treu T,, Koopmans L.V. E., et al., 2008, ApJ, 684, 248
- Bruzual and Charlot (2003) Bruzual, G.; Charlot, S. 2003, MNRAS, 344, 1000
- Burkert (1993) Burkert A., 1993, A&A, 278, 23
- Busarello et al. (1997) Busarello G., Capaccioli M., Longo G., Puddu E., 1997, in: The Second Stromlo Symposium “The nature of Elliptical Galaxies”, ASP Conference Series, 166, 184
- Caon et al. (1993) Caon N., Capaccioli M., D’Onofrio M., 1993, MNRAS, 265, 1013
- Capaccioli (1987) Capaccioli M., 1987, in Structure and dynamics of elliptical galaxies, ed. P.T. de Zeeuw (Reidel, Dordrecht), p. 47
- Capaccioli (1989) Capaccioli M., 1989, in The world of galaxies, ed. H.G. Corwin & L. Bottinelli (Springer-Verlag, Berlin), p. 208
- Cappellari et al. (2006) Cappellari M., Bacon R., Bureau M., et al., 2006, MNRAS, 366, 1126
- Cappellari (2008) Cappellari M., 2008, MNRAS, 390, 71
- Cappellari et al. (2007) Cappellari M., Emsellem E., Bacon R., et al., 2007, MNRAS, 379, 418
- Cappellari et al. (2011) Cappellari M., Emsellem E., Krajnović D., McDermid R.M., Scott N., Verdoes Kleijn G. A., 2011, MNRAS 413, 813
- Cappellari et al. (2012) Cappellari M., McDermid R.M., Alatalo K., et al., 2012, [arXiv:1202.3308v1]
- Cappellari et al. (2012) Cappellari M., McDermid R.M., Alatalo K., et al., 2012, [arXiv:1208.3523]
- Cappellari et al. (2013) Cappellari M., Scott, N., Alatalo K., et al., 2013, [arXiv:1208.3522], in press
- Cava et al. (2009) Cava A., Bettoni D., Poggianti B. M., Couch W. J., et al. 2009, A&A 495, 707
- Chevance et al. (2012) Chevance M., Weijmans A.-M., Damjanov I., Abraham R.G., Simard L., van den Bergh S., Caris E., Glazebrook K., 2012, ApJL 754, L24
- Chiosi et al. (1998) Chiosi C., Bressan A., Portinari L., Tantalo R., 1998, A&A, 339, 355
- Chiosi & Carraro (2002) Chiosi C., Carraro G., 2002, MNRAS, 335, 335
- Cimatti et al. (2002) Cimatti, A., Mignoli M., Daddi E., et al., 2002, A&A, 392, 395
- Cimatti et al. (2008) Cimatti A., Cassata P., Pozzetti L., Kurk J., Mignoli M., Renzini A., Daddi E., 2008, A&A 482, 21
- Ciotti, Lanzoni & Renzini (1996) Ciotti L., Lanzoni B., Renzini A., 1996, MNRAS, 282, 1
- Daddi et al. (2005) Daddi E., Renzini A., Pirzkal N., Cimatti A., Malhotra S., Stiavelli M., Xu C., 2005, ApJ 626, 680
- Damjanov et al. (2009) Damjanov I., McCarthy P.J., Abraham R.G.; Glazebrook K., Yan H., Mentuch E., ApJ 695, 101
- Davies et al. (1983) Davies R.L., Efstathiou G., Fall S.M., Illingworth G., Schechter P. L., 1983, ApJ, 266, 41
- de Carvalho & da Costa (1988) de Carvalho, R.R., da Costa L.N., 1988, ApJS, 68, 173
- de la Rosa et al. (2001) de la Rosa, I.G., de Carvalho, R.R., Zepf, S.E., 2001, AJ 122, 93
- De Lucia et al. (2006) De Lucia G., Springel V., White S. D. M., Croton D., Kau?mann G., 2006, MNRAS, 366, 499
- De Lucia et al. (2011) De Lucia G., Fontanot F., Wilman D., Monaco P., 2011, MNRAS, 414, 1439
- Dekel & Cox (2006) Dekel A., Cox T.J., 2006, MNRAS 370, 1445
- Desroches et al. (2007) Desroches L.B., et al. 2007, MNRAS, 377, 402
- de Vaucouleurs et al. (1991) de Vaucouleurs, G., de Vaucouleurs, A., Corwin, H. G., Jr., Buta, R. J., Paturel, G., & Fouqué, P. 1991, Third Reference Catalogue of Bright Galaxies, Springer, New York, NY (USA)
- Di Serego Alighieri et al. (2005) di Serego Alighieri S., Vernet J., Cimatti A., et al., 2005, A&A, 442, 125
- Djorgovski & Davis (1987) Djorgovski S., Davis M., 1987 ApJ 313, 59
- Djorgovski et al. (1998) Djorgovski S., De Carvalho R., Han S.M., 1988, ASPC, 4, 329
- Djorgovski & Santiago (1993) Djorgovski S., Santiago B.X., 1993, in “Structure, Dynamics, and Chemical Evolution of Early Type Galaxies”, Danziger I.J., Zeilinger W.W., Kjär K., eds. p. 59
- D’Onofrio et al. (2008) D’Onofrio M., Fasano G., Varela J., Bettoni D., Moles M., Kjærgaard P., Pignatelli E., Poggianti B., Dressler A., Cava A., and 3 co-authors, 2008, ApJ 685, 875
- D’Onofrio et al. (2011) D’Onofrio M., Valentinuzzi T., Fasano G., et al., 2011, ApJL 727, 6
- Dressler et al. (1987) Dressler A., Lynden-Bell D., Burstein D., Davies R.L., Faber S.M., Terlevich R.J., Wegner G., 1987, ApJ 313, 42
- Emsellem et al. (1994) Emsellem E., Monnet G., Bacon R., 1994, A&A 285, 723
- Emsellem et al. (2011) Emsellem E., Cappellari M., Krajnović D., Alatalo K., Blitz L., Bois M., et al., 2011, MNRAS 414, 888
- Faber et al. (1987) Faber S.M., Dressler A., Davies R., Burstein D., Lynden-Bell D., 1987, in: Nearly normal galaxies: From the Planck time to the present; Proceedings of the Eighth Santa Cruz Summer Workshop in Astronomy and Astrophysics, Santa Cruz, CA, July 21-Aug. 1, 1986 (A88-18401 05-90). New York, Springer-Verlag, 1987, p. 175-183
- Fasano et al. (2006) Fasano G., Marmo C., Varela J., D’Onofrio M., et al. 2006, A&A 445, 805
- Fasano et al. (2012) Fasano G., Vanzella, E., Dressler A., et al., 2012, MNRAS 420, 926
- Forbes et al. (1998) Forbes D.A., Ponman T.J., Brown R.J.N., 1998, ApJ 508, L43
- Fritz et al. (2007) Fritz J., Poggianti B. M., Bettoni D., et al. 2007, A&A, 470, 137
- Fritz et al. (2011) Fritz J., Poggianti B. M., Cava A., et al. A&A 526, 45
- Gallazzi et al. (2006) Gallazzi A., et al. 2006, MNRAS 370, 1106
- Gargiulo et al. (2009) Gargiulo A., 2009, MNRAS, 397, 75
- Gerhard et al. (2001) Gerhard O., Kronawitter A., Saglia R.P., Bender R., 2001, AJ, 121, 1936
- González et al. (2009) Gonzalez J. E., Lacey C. G., Baugh C. M., Frenk C. S., Benson A. J., 2009, MNRAS, 397, 1254
- Graham & Colless (1997) Graham A., Colless M., 1997, MNRAS, 287, 221
- Graves et al. (2009) Graves G.J., Faber S.M., Schiavon R.P., 2009, ApJ, 698, 1590
- Hansson et al. (2012) Hansson A., et al. 2012, A&A submitted
- Hjorth & Madsen (1995) Hjorth J., Madsen J., 1995, ApJ, 445, 55
- Hyde & Bernardi (2009) Hyde J.B., Bernardi M., 2009, MNRAS, 396, 1171
- Hopkins et al. (2008) Hopkins Ph.F., Cox T.J., Hernquist L., 2008, ApJ, 689, 17
- Hopkins et al. (2009) Hopkins P. F., Hernquist L., Cox T. J., Keres D., Wuyts S., 2009, ApJ, 691, 1424
- Kauffmann et al. (2003) Kauffmann, G., Heckman, T. M., White, S. et al. (2003), MNRAS 341, 33
- Kelson et al. (2000) Kelson, D.D., Illingworth, G.D., van Dokkum, P.G., Franx, M., 2000, ApJ 531, 137
- Kelson et al. (2000) Kelson, D.D., Illingworth, G.D., van Dokkum, P.G., Franx, M., 2000, ApJ 531, 137
- Kochanek et al. (2000) Kochanek, C.S., Falco, E.E., Impey, C.D., Lehár, J., McLeod, B.A., et al. 2000, ApJ 543, 131
- Kroupa (2001) Kroupa P., 2001, MNRAS, 322, 231
- Kroupa (2012) Kroupa P., 2012, [arXiv:1210:1211]
- Jorgensen et al. (1996) Jorgensen Franx, Kjaergaard 1996
- Jorgensen et al. (2006) Jorgensen I., Chiboucas K., Flint K., Bergmann M., Barr J., Davies R., 2006, ApJ, 639, L9
- La Barbera et al. (2000) La Barbera F., Busarello G., Capaccioli M., 2000, A&A, 362, 851
- La Barbera et al. (2010) La Barbera F., de Carvalho R. R., de La Rosa I. G., Lopes P. A. A., 2010 MNRAS 408, 1335
- La Barbera et al. (2010) La Barbera F., De Carvalho R. R., De La Rosa I. G., et al., 2010 ApJ, 140, 1528
- Lupton (2005) Lupton R., 2005, http://www.sdss.org/dr5/algorithms/sdssUBVRITransform.html
- McCarthy et al. (2012) McCarthy I. G., Font A. S., Crain R. A., Deason A. J., Schaye J., Theuns, T., 2012, MNRAS, 420, 2245
- Magoulas et al. (2012) Magoulas C., et al. 2012, MNRAS 427, 245
- Merlin & Chiosi (2006) Merlin E., Chiosi C., 2006, A&A 457, 437
- Merlin & Chiosi (2007) Merlin E., Chiosi C., 2007, A&A 473, 733
- Merlin et al. (2012) Merlin E., Chiosi C., Piovan L., Grassi T., Buonomo U., 2012, MNRAS in press [ArXiv:1204.5118]
- Michard (1985) Michard R., 1985, A&AS, 59, 205
- Naab et al. (2009) Naab T., Johansson P.H., Ostriker J.P., 2009, ApJL 699, 178
- Nipoti et al. (2006) Nipoti C., Londrillo P, Ciotti L., 2006, MNRAS, 370, 681
- Nipoti et al. (2009) Nipoti C., Treu T., Bolton S., 2009, ApJ 703, 1731
- Oñorbe et al. (2005) Oñorbe J., Domínguez-Tenreiro R., Sáiz A., Serna A., Artal H., 2005, ApJ 632, L57
- Oser et al. (2012) Oser L., Naab T., Ostriker J. P., Johansson P. H., 2012, ApJ, 744, 63
- Padmanabhan et al. (2004) Padmanabhan N., Seljak U., Strauss, M.A., et al. 2004, New Astronomy, 9, 329
- Pahre et al. (1998a) Pahre, M.A., Djorgovski, S.G., de Carvalho, R,R., 1998, AJ, 116, 1591
- Pahre et al. (1998b) Pahre M.A., De Carvalho R.R., Djorgovski S.G., 1998, AJ, 116, 1606
- Parry et al. (2009) Parry O. H., Eke V. R., Frenk C. S., 2009, MNRAS, 396, 1972
- Paturel et al. (2003) Paturel G., Petit C., Prugniel P., Theureau G., Rousseau J., Brouty M., Dubois P., Cambrésy L., 2003, A&A, 412, 45
- Pignatelli et al. (2006) Pignatelli E., Fasano G., Cassata P., 2006, A&A, 446, 373
- Poggianti et al. (2012) Poggianti B.M., Calvi R., Bindoni D., D’Onofrio M., Moretti A.,Valentinuzzi T., 2012, ApJ in press [ArXiv:1211.1005]
- Poveda (1968) Poveda A., 1958, Boletín de los Observatorios de Tonantzintla y Tacubaya Vol. 2, Num. 17, pp. 3-7
- Press et al. (1992) Press W.H., Teukolsky S.A., Vetterling W.T., Flannery B.P., 1992, Numerical Recipes in Fortran: the art of scientific computing, Cambridge University Press, Second Edition.
- Prugniel & Simien (1994) Prugniel Ph., Simien F., 1994, A&A, 282, L1
- Prugniel & Simien (1997) Prugniel Ph., Simien F., 1997, A&A, 321, 111
- Renzini & Ciotti (1993) Renzini A., Ciotti L., 1993, ApJ, 416, L49
- Renzini (1995) Renzini A., 1995, in “Stellar Populations”, Gilmore G., van der Kruit P. eds., p. 325
- Robertson et al. (2006) Robertson B., Cox T.J., Hernquist L., et al., 2006, ApJ, 641, 21
- Salim et al. (2007) Salim, S. Rich, R. M,, Charlot, S. et al. (2007), ApJS, 173, 267
- Salpeter (1955) Salpeter E.E., 1955, ApJ 121, 161
- Saracco et al. (2012) Saracco P., Longhetti M., Gargiulo A., 2012, MNRAS 422, 3107
- Schombert (1986) Schombert J.M., 1986, ApJS, 60, 603
- Scodeggio et al. (1998) Scodeggio M., Gavazzi G., Belsole E., Pierini D., Boselli A., 1998, MNRAS, 301, 1001
- Sersic (1968) Sersic J.L., 1968, Atlas de galaxias australes, Observatorio Astronomico de Cordoba
- Smith et al. (2004) Smith R.J., Hudson M.J., Nelan J. E., et al., 2004, AJ, 128, 1558
- Terlevich & Forbes (2002) Terlevich A.I., Forbes D.A., 2002, MNRAS, 330, 547
- Tortora et al. (2009) Tortora C., Napolitano N. R., Romanowsky A. J., Capaccioli M., Covone G., 2009, MNRAS, 396, 1132
- Tortora et al. (2010) Tortora C., Napolitano N. R., Cardone V. F., Capaccioli M., Jetzer Ph., Molinaro R., 2010, MNRAS, 407, 144
- Treu et al. (2005) Treu T., Ellis R.K., Liao T.X., van Dokkum P.G., 2005, ApJ, 622, L5
- Trujillo et al. (2004) Trujillo I., Burkert A., Bell E.F., 2004, ApJ, 127, 1917
- Trujillo et al. (2006) Trujillo I., Feulner G., Goranova Y., Hopp U., Longhetti M., Saracco P., 2006, MNRAS 373, L36
- Valentinuzzi et al. (2009) Valentinuzzi T., Woods D., Fasano G., Riello M., D’Onofrio M., Varela J., Bettoni D., Cava A., Couch W.J., Dressler A., and 5 coauthors, 2009, A&A, 501, 851
- Valentinuzzi et al. (2010) Valentinuzzi T., Poggianti B. M., Saglia, R. P., et al., 2010, ApJ 721, 19
- Valentinuzzi et al. (2010) Valentinuzzi T., Fritz J., Poggianti B. M., et al., 2010, ApJ 712, 226
- van der Wel et al. (2005) van der Wel A., Franx M., van Dokkum P. G., et al., ApJ, 631, 145
- van der Wel et al. (2008) van der Wel A., Holden B.P., Zirm A.W., Franx M., Rettura A., Illingworth G.D., Ford H.C., 2008, ApJ 688, 48
- van Dokkum & Stanford (2003) van Dokkum G., Stanford S.A., 2003, ApJ 585, 78
- van Dokkum et al. (2008) van Dokkum P.G., Franx M., Kriek M., Holden B., Illingworth G.D., Magee D., Bouwens R., 2008, ApJL 677, L5
- Varela et al. (2009) Varela J., D’Onofrio M., Marmo C., et al., 2009, A&A, 497, 667
- Vulcani et al. (2011) Vulcani B., Poggianti B. M., Aragón-Salamanca A., et al. 2011, MNRAS, 412, 246
- Wuyts et al. (2011) Wuyts S., Forster S., Natascha M., et al. 2011, ApJ 742, 96
- Young & Currie (1994) Young C.K. & Currie M.J., 1994, MNRAS, 268, 11