High-Fidelity Coding with Correlated Neurons
Rava Azeredo da Silveira1,2,3,∗, Michael J. Berry
II4,†
1 Department of Physics, Ecole Normale Supérieure, 24 rue
Lhomond, 75005 Paris, France
2 Laboratoire de Physique
Statistique, Centre National de la Recherche Scientifique, Université
Pierre et Marie Curie, Université Denis Diderot, France
3 Princeton Neuroscience Institute, Princeton University, Princeton,
New Jersey 08544, U. S. A.
4 Department of Molecular Biology,
Princeton University, Princeton, New Jersey 08544, U. S. A.
E-mail: rava@ens.fr
E-mail:
berry@princeton.edu
Abstract
Positive correlations in the activity of neurons are widely observed in the brain. Previous studies have shown these correlations to be detrimental to the fidelity of population codes or at best marginally favorable compared to independent codes. Here, we show that positive correlations can enhance coding performance by astronomical factors. Specifically, the probability of discrimination error can be suppressed by many orders of magnitude. Likewise, the number of stimuli encoded—the capacity—can be enhanced by similarly large factors. These effects do not necessitate unrealistic correlation values and can occur for populations with a few tens of neurons. We further show that both effects benefit from heterogeneity commonly seen in population activity. Error suppression and capacity enhancement rest upon a pattern of correlation. In the limit of perfect coding, this pattern leads to a ‘lock-in’ of response probabilities that eliminates variability in the subspace relevant for stimulus discrimination. We discuss the nature of this pattern and suggest experimental tests to identify it.
Author Summary
Traditionally, sensory neuroscience has focused on correlating inputs from the physical world with the response of a single neuron. Two stimuli can be distinguished solely from the response of one neuron if one stimulus elicits a response and the other does not. But as soon as one departs from extremely simple stimuli, single-cell coding becomes less effective because cells often respond weakly and unreliably. High fidelity coding then relies upon populations of cells, and correlation among those cells can greatly affect the neural code. While previous theoretical studies have demonstrated a potential coding advantage of correlation, they allowed only a marginal improvement in coding power. Here, we present a scenario in which a pattern of correlation among neurons in a population yields an improvement in coding performance by several orders of magnitude. By “improvement” we mean that a neural population is much better at both distinguishing stimuli and at encoding a large number of them. The scenario we propose does not invoke unrealistic values of correlation. What is more, it is even effective for small neural populations and in subtle cases in which single-cell coding fails utterly. These results demonstrate a previously unappreciated potential for correlated population coding.
Introduction
Many of the classic studies relating behavior to the activity of neurons, such as studies of single photon counting, have focused on behaviors that are near the threshold of perception [1, 2, 3, 4, 5], where performance is uncertain and can suffer a substantial error rate. One of the great surprises of these studies is that in this limit, the variability of single neurons often matches the variability in performance, such that single neurons can account for the behavior [6, 4, 7]. However, most of our everyday visual experience involves judgments made with great accuracy and certainty. As is illustrated by phrases like “seeing is believing” and Shakespeare’s “ocular proof,” we often dismiss any doubt about an aspect of the world once it is perceived visually. In this ‘high-fidelity’ limit, perception must cope with single neuron variability by relying upon populations of neurons. Our visual system not only yields perception with certainty, but it also allows us to make complex judgments very rapidly—a fact that places additional constraints on the population neural code [8, 9].
In a neural population, correlations in the activity of neurons provide additional variables with which information can be represented. While details may vary from one neural circuit to another, a fairly common pattern of correlation is observed across many brain regions, including the retina, LGN, cerebral cortex, and cerebellum [10, 11, 12, 13, 14, 15, 16, 17]. Correlations vary from pair to pair, with a positive mean and a standard deviation comparable to the mean [18, 19, 20, 21, 22] (but see Ref. [23]).
How do these affect coding? This question has been investigated by a number of authors [24, 25, 26, 27, 28, 29, 30, 31, 32, 33, 34, 35, 36, 37, 38, 39], who find that in many cases positive correlations are detrimental to coding performance; in some cases, however, positive correlations can enhance the coding performance of a neural population. Using specific choices of neural response and correlation properties, this effect was probed quantitatively in models of pairs of neurons, small populations, or large populations. In all these cases, the presence of correlation boosted coding performance to a relatively modest degree: the mutual (Shannon) information or the Fisher information (depending on the study) in the correlated population exceeded that in the equivalent independent population by a factor of . For typical choices of correlation values, the improvement was calculated to be . These results can be translated into the units of capacity used in this study and correspond to an improvement of a fraction of a percent to a few percents (see Discussion below), which in turn correspond to a negligible increase of the information encoded per neuron.
A limited number of experimental results indicate that information about stimuli can be represented by the correlations themselves, but in the more typical case single-cell responses vary with the stimuli while correlation values are stimulus-independent. In this context, all the models which display an improvement in coding in the presence of correlation rely on the same mechanism [24, 26, 27, 40, 29, 30, 31, 37, 38], namely, that correlation relegates the variability of neural response into a non-informative mode. To be more specific, because of variability each stimulus is represented by a distribution of response patterns in the population, and the overlap between neighboring distributions results in coding ambiguity. While positive correlations broaden response distributions overall, in a heterogeneous system the broadening can occur along a non-informative direction while distributions compress along directions that matter in terms of potential ambiguity (Fig. 1B). As a result, correlation can suppress ambiguity and, hence, enhance coding fidelity.
Here, we focus upon the typical case of stimulus-independent correlation. We exploit this same basic mechanism but we apply it to neural populations of any size. Our central result is that, when the true population effect is taken into account, the enhancement in coding performance can be astronomical. In a correlated population, discrimination errors can be suppressed by factors of (or even greater) and the information per neuron can be boosted by factors of (or even greater), as compared with an equivalent independent population. We obtain these results in simple models that assume experimental values of correlations and population size. In fact, astronomical enhancement of coding fidelity occurs in populations as small as neurons and in situations in which independent coding breaks down entirely. We derive these results numerically and analytically, and we discuss then in light of a ‘lock-in’ limit of the basic mechanism: unlike in pairs of neurons, in a larger population correlation is able to compress response distributions into an effectively lower-dimensional object. Furthermore, we demonstrate that physiological heterogeneity, ubiquitous in neural systems, systematically enhances the effect of correlation. Finally, we discuss the statistical plausibility of the occurrence of correlated high-fidelity coding in actual neural populations, and we point to a strategy for testing our predictions experimentally.
Results
Our results amount to the answers to two complementary questions. Given a pair sensory stimuli, how well can a population of correlated neurons discriminate between them? Or, more precisely, what is the discrimination error rate? Conversely, given a discrimination error rate, what is the capacity of a correlated population? That is, how many stimuli can it encode with tolerable error? In natural situations, discrimination errors are exceedingly rare and, hence, neural populations are expected to achieve very low error rates. (See Supplementary Experimental Procedures 1.1 for a layout of the assumptions used in our approach and Supplementary Text 2.1 for a detailed argument and quantitative estimates of low error rates.) All our discussion is set in this low-error regime.
Positive correlations can suppress discrimination error rates by orders of magnitude
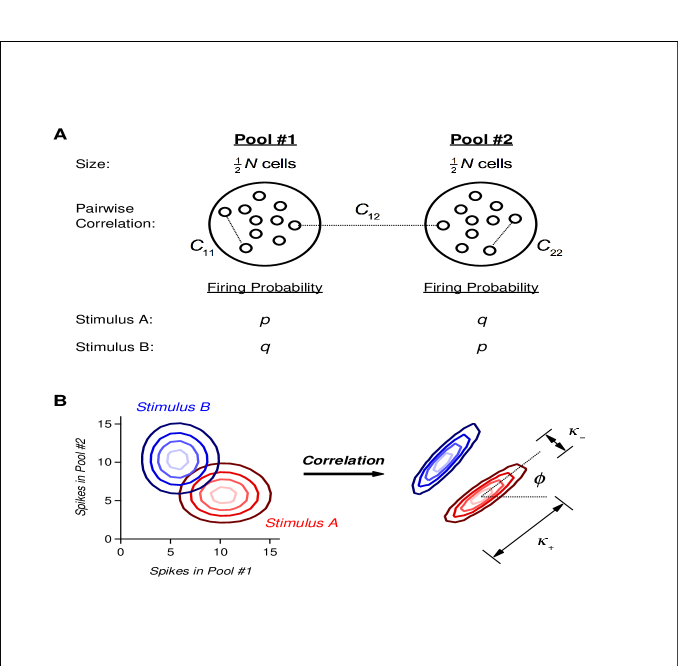
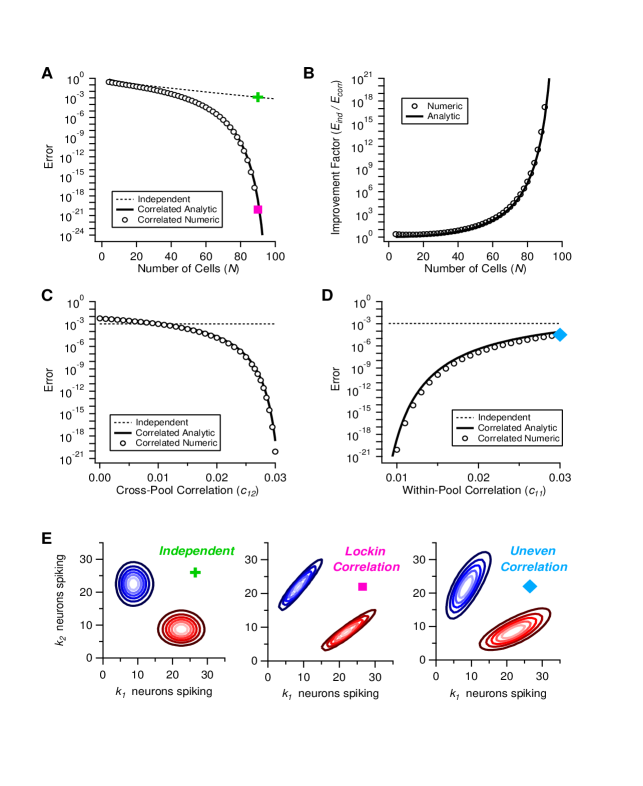
We consider two stimuli or sets of stimuli, which we henceforth refer to as Target and Distracter. These can be two specific stimuli (e.g., a black cat and a tabby cat), a specific stimulus and a stimulus category (e.g., your cat and all other cats), or two stimulus categories (e.g., all black cats and all tabby cats) and they have to be discriminated by the response of a neural population in a short time window during which each neuron fires or spike. Each neuron is bound to respond more vigorously on average either to Target or to Distracter. Thus, it is natural to divide the -neuron population into two pools of neurons (“Pool 1” and “Pool 2”), each more responsive to one of the two stimuli, as it has been done customarily in studies on stimulus discrimination (see, e.g., [4]). For the sake of simplicity, in this 2-Pool model we allocate neurons to each pool (Fig. 1A). We denote by and the number of active neurons in Pools 1 and 2 respectively. We start with a symmetric case: neurons in Pools 1 and 2 respond with firing rates and respectively to the Target and, conversely, with firing rates and respectively to the Distracter. Moreover, correlations in the activity of pairs of neurons may take different values within Pool 1 (), within Pool 2 (), and across pools (). We denote by the bare values of pairwise correlation and by the normalized pairwise correlations. Normalized values are often quoted in the literature and present the advantage of being bounded by and . (See Experimental Procedures for mathematical definitions.) While we shall present most of our quantitative results for symmetric choices of the parameters, our qualitative conclusions hold in general.
If is larger than , Pool 1 consists of the neurons ‘tuned’ to Target while Pool 2 consists of the neurons ‘tuned’ to Distracter. A useful visual representation of the probability distributions of responses to Target and Distracter makes use of contour lines (Fig. 1B). In the case of independent neurons (with ), the principal axes of the two distributions are horizontal and vertical, and their contour lines are nearly circular unless or take extreme values. As a result, the overlap between the two distributions tends to be significant (Fig. 1B), with the consequence of a non-negligible coding error rate. In such a situation, positive correlations can improve coding by causing the distributions to elongate along the diagonal and, conversely, to shrink along the line that connects the two centers (Fig 1B).
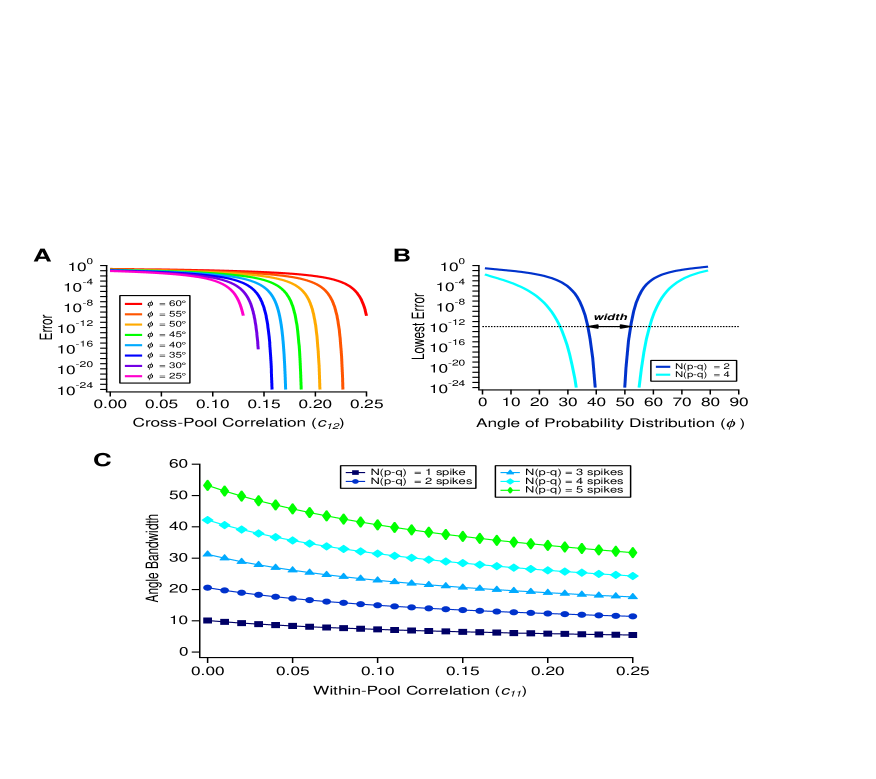
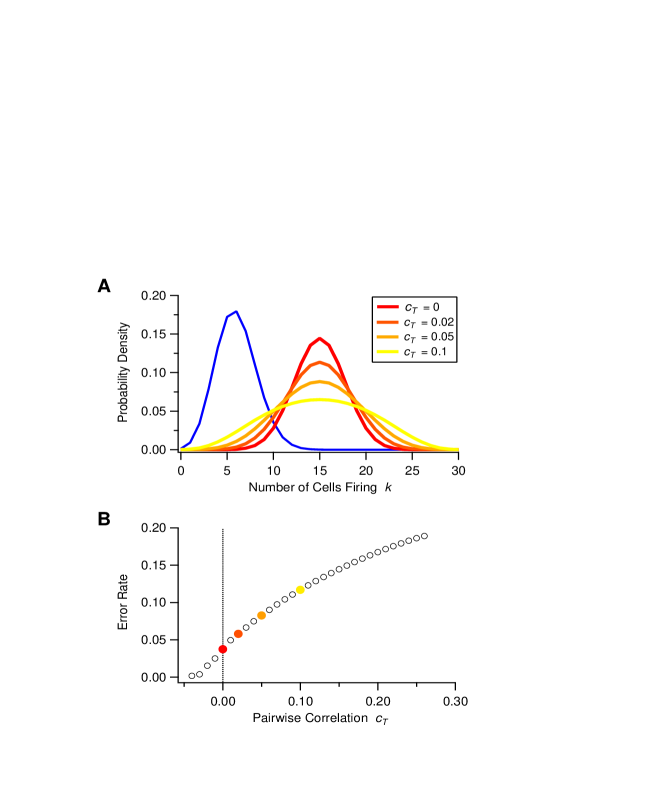
To illustrate this generic mechanism, we have computed the error rate numerically for specific choices of parameters of the firing rates and correlations in the population. (See Supplementary Experimental Procedures 1.2 for a review of the maximum likelihood error and Supplementary Experimental Procedures 1.3 for details on the numerics.) By way of comparison, in an independent population with neurons the error rate drops exponentially as a function of (Fig. 2A). While the error rates for independent and correlated populations start out very similar for small population size, they diverge dramatically as increases to 90 neurons (Fig. 2A). We can define a factor of coding improvement due to correlations as the ratio of the two error rates; this factor exceeds for large populations (Fig. 2B). We can also explore the way in which the error rate changes as we vary the strength of the pairwise correlations at fixed population size. Increasing the strength of correlation across pools, , sharply reduces the error rate, while increasing the strength of correlation within pools, or , enhances the error rate (Figs. 2C and D).
The important point, here, is that improvements by orders of magnitude do not result from growing the population to unrealistically large numbers of neurons or boosting the correlations to limiting values. The massive suppression of error rates occurs in populations of less than a hundred neurons and in the presence of realistic correlations ranging from 0.01 to 0.03. This is because even in populations of relatively modest size, weak correlations can significantly deform the shape of the probability distributions of population responses (Fig. 2E).
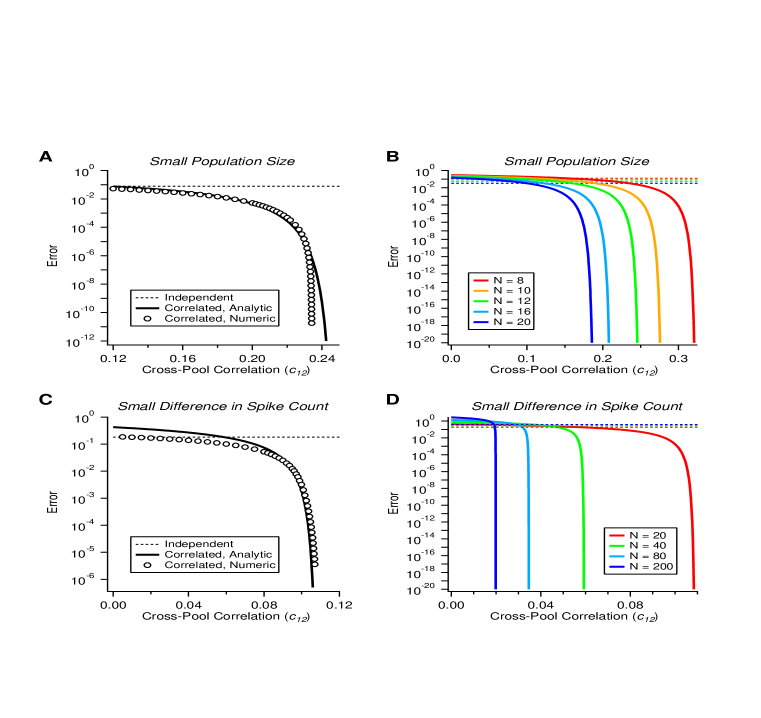
In fact, the suppression of the coding error down to negligible values by positive correlation does not even require populations with as many as neurons. Such suppression can be obtained in much smaller populations, with a total number of neurons, , between 8 and 20 and with values of correlations below or not much higher than (Figs. 3A and B). Such values of correlations are still well within the experimentally measured range. We also explore another case which, naively, prohibits low-error coding: that in which the firing rates in the two neuron pools differ by very little; specifically, when is of order one. This condition implies that the overall activities in a given pool, in response to Target and Distracter respectively, differ by one or a few spikes. In this limiting case, coding with pools of independent neurons fails entirely, with error rates of order one, since the absolute amplitude of fluctuations exceeds unity. In a correlated population, we find, again, a massive suppression of error rates by orders of magnitude, for realistic values of correlation (Figs. 3C and D).
Analysis of Low-Error Coding
In addition to our direct numerical investigations, we have performed analytic calculations using a Gaussian approximation of the probability distribution (see Supplementary Experimental Procedures 1.4 for derivations). The analytic results agree very closely with the numeric results (Figs. 2 and 3, solid line vs. circles) and yield simple expressions for the dependence of the error rate upon the parameters of our model, useful for a more precise understanding of the effect of correlation.
The analytic expression of the error rate, , reads
| (1) |
The numerator in the argument behaves as expected for a population of independent neurons: it yields an exponential decay of the error rate as a function of , with a sharpness that increases with the difference between and . But the denominator,
| (2) |
provides a strong modulation as a function of correlations (Figs. 2 and 3). In the symmetric case with and , this expression simplifies to
| (3) |
This quantity approaches zero when , where . Thus, in a population of tens or hundreds of neurons, it is sufficient that exceed by less than a few percent for the coding error to become vanishingly small.
From Eq. (1), it is apparent that the error rate converges rapidly to zero with decreasing , and has an essential singularity at . For any well-defined probability distribution, remains non-negative, but it can take arbitrarily small values. When correlations are such that is small enough, we are in a regime of high-fidelity coding. The error vanishes for ; in this limit, the probability distributions corresponding to Target and Distracter are both parallel and infinitely thin. The value of alone does not specify the geometry of the probability distributions entirely; even with , there remain free parameters, namely, the angles along which the elongated distributions lie in the plane (denoted in Fig. 1B). In Supplementary Experimental Procedures 1.6, we demonstrate that these additional parameters need not be fine-tuned for high-fidelity coding. In fact, angles can vary by as much as while the error rate remains below .
Neural Diversity Is Favorable to High-Fidelity Coding
The simplest version of the 2-Pool model, discussed hitherto, assigns homogeneous firing rate and correlation values within and across each of the two neural sub-populations. Similar homogeneity assumptions are frequent in modeling and data analysis: while response properties vary from neuron to neuron in data, average values are often chosen to represent a population as a whole and to evaluate coding performances. It is legitimate, however, to ask to what extent error rates are shifted in a more realistic setting which includes neural diversity and, in fact, whether high-fidelity coding survives at all in the presence of neuron-to-neuron heterogeneity. We find that not only does it survive but that, in fact, neural diversity further suppresses the error rate.
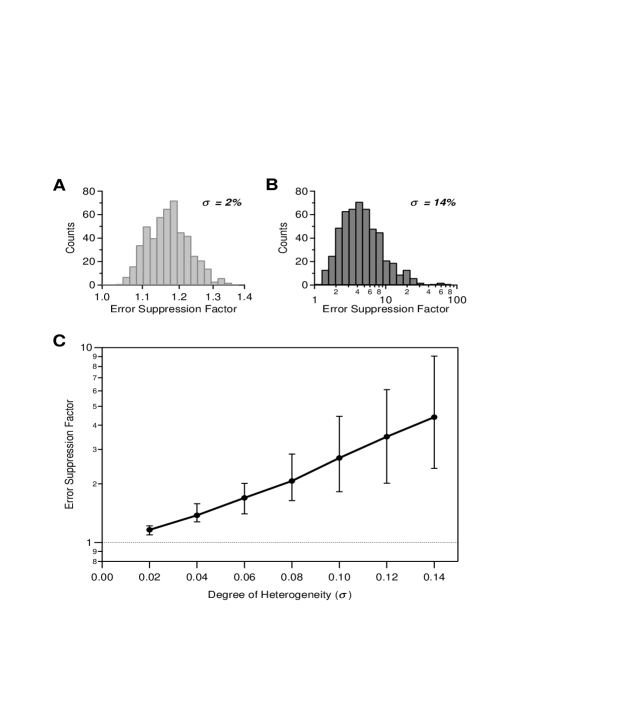
We generalized the 2-Pool model of a correlated population to include neuron-to-neuron diversity, by randomly and independently varying the firing rate and correlation values according to a Gaussian distribution with standard deviation , measured as a fraction of the original value. We then computed the error rate in this generalized model and compared it to the corresponding quantity in the homogeneous 2-Pool model. We found that every single instantiation of neural diversity yielded an improvement in the coding performance (Figs. 4A and B). More diverse neural populations with larger values of display stronger suppressions of the error rate (Fig 4C). As increases, the suppression factor grows both in mean and in skewness, so that a significant fraction of the instantiations of heterogeneity yields a large improvement of the coding performance over the homogeneous case (Figs. 4A vs. B).
The degree of error suppression depends, of course, on how much correlation reduces the error relative to the matched independent population in the first place. For the population shown here, neuron-to-neuron variations on a range commonly seen in experiments lead to a suppression of the error rate by a factor of on average and a factor of for some instantiations of the heterogeneity (Fig. 4B). The coding benefit of heterogeneity appears to be a rather general phenomenon [30, 36, 41].
The Mechanism for High-Fidelity Coding and the ‘Lock-In’ phenomenon
The mechanism of dramatic error suppression from positive correlations may be explained in a general manner that does not invoke a specific model or approximation. A powerful description is given in terms of the ‘macroscopic’ variances and covariances of the spike count within and across the two pools: we call the variance in the spike count, , within Pool 1, the variance in the spike count, , within Pool 2, and the covariance of spike counts across the two pools. (See Fig. 1B for a visual definition of these quantities, Experimental Procedures for mathematical definitions, and Supplementary Experimental Procedures 1.5 for derivations of the results discussed below.)
The variances of the probability distribution of the neural response in the plane take the form
| (4) |
The angles along which these variances are measured can also be computed similarly (see Supplementary Experimental Procedures 1.5). In the case of positive correlation, the angle along which the distribution elongates (i.e., the angle long which extends, denoted in Fig. 1B) lies between and . The small variance, , lies at right angle and governs error rate suppression. The smaller and the more parallel the compressed distributions, the smaller the error rates. The expressions for the variances (above) and the angles (given in the Supplementary Experimental Procedures 1.5) are general—they do not depend upon the shapes of the distributions or the details of the correlation among neurons—and they give a sense of the extent to which probability distributions of the population response are deformed by correlations. In the specific 2-Pool models we treated above, positive correlations induce massive suppressions of the coding error rate. We expect similar high-fidelity coding whenever the tails of probability distributions fall off sufficiently rapidly.
The limiting case of an infinitely thin distribution occurs when
| (5) |
in this case,
| (6) |
and
| (7) |
We refer to Eq. (5) as the ‘lock-in’ condition. When the cross-pool covariance becomes this large, the width of the probability distribution vanishes and the dimensionality of the response space is effectively reduced by one. In the case of homogeneous pools of neurons, we can reformulate this condition using ‘microscopic’ correlations, as
| (8) |
(see Experimental Procedures and Supplementary Experimental Procedures 1.5). If the lock-in condition in Eq. (5) (alternatively, Eq. (8)) is satisfied and and (alternatively, and ) are chosen such as to yield compressed distributions that are parallel, then error rates vanish. (See Supplementary Text 2.4 on the nature of the locked-in state.)
As we have seen above, even if the cross-pool correlation approaches this lock-in limit without achieving it, still the error rate can be suppressed dramatically. Furthermore, the angles of the two distributions need not be precisely equal. Thus, this amounts to a robust mechanism by which coding and discrimination may be achieved with near-perfect reliability. It does not require fine tuning of the parameters such the distribution widths and their tilt angles; in particular, we need not limit ourselves to symmetric choices of parameters, as we have done above for the sake of simplicity.
The general arguments presented here also indicate that the ‘ or spike’ assumption is inessential and, in fact, that relaxing it may lead to even stronger effects. If individual neurons can fire several spikes in a time window of interest, the code can be combinatorial, but a simple spike count code will do at least as well as a more sophisticated combinatorial one. If we stick to the spike count code, the general formulation remains valid. In this situation, allowing many spikes per neurons corresponds effectively to increasing the total number of neurons and, hence, can yield stronger effects for comparable correlation values.
Correlated Populations Can Code for Large Sets of Stimuli with High Fidelity
In most natural situations, the task of organisms is not to tell two stimuli apart but rather to identify an actual stimulus among a wealth of other, possibly occurring stimuli. Visual decoding must be able to assign a given response pattern to one of many probability distributions, with low error. In other words, any pair of probability distributions of neural activity, corresponding to two stimuli among a large set of stimuli, must have little overlap. Thus, the problem of low-error coding of a large set of stimuli amounts to fitting, within the space of neural activity, a large number of probability distributions, while keeping them sufficiently well separated that their overlap be small.
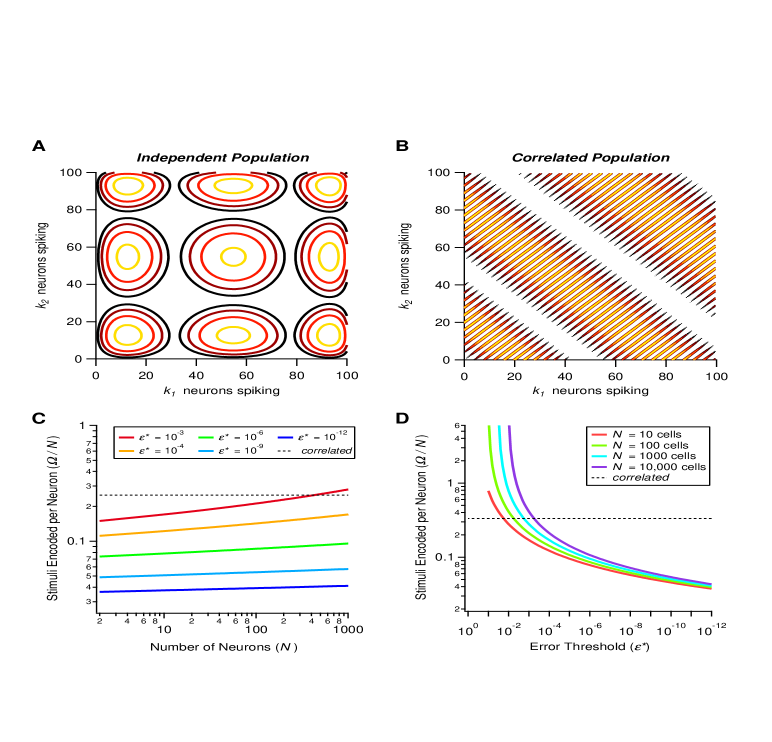
It is easy to see pictorially why the presence of correlation is favorable to the solution of this problem. The state of the 2-Pool model is specified by the number of active neurons in Pools 1 and 2, and respectively. If neurons are independent, probability distributions (corresponding to different stimuli) have a near-circular shape with variances along the horizontal and the vertical axes of order and (Fig. 5A). As a result, the only way to prevent tails from overlapping too much is to separate the peaks of the distributions sufficiently. By contrast, since correlated distributions are elongated, their centers can be placed near each other while their tails overlap very little (Fig. 5B). Thus, many more correlated distributions than independent distributions can be packed in a given region in the space of neural responses (Figs. 5A and B).
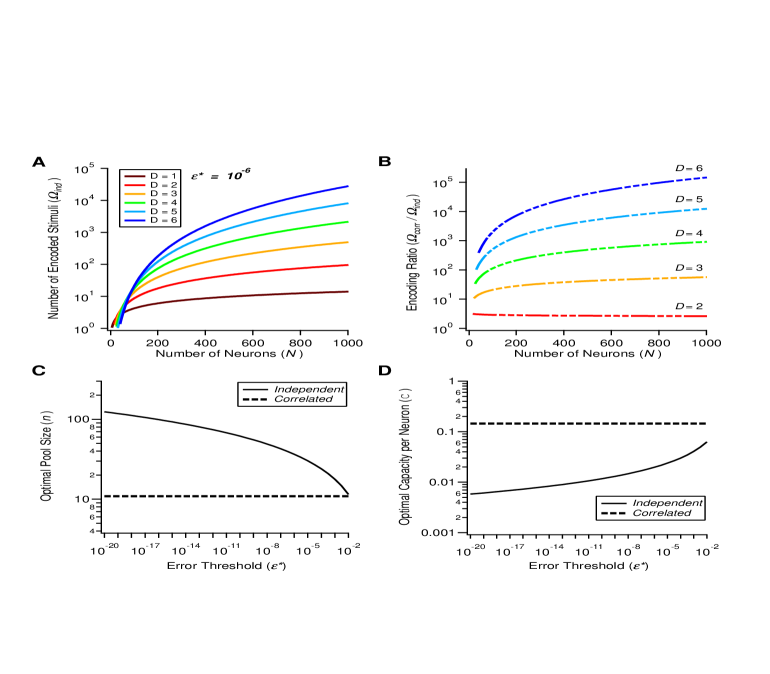
We call the maximum number of stimuli that a population of neurons can code with an error rate less than in the discrimination of any stimulus pair. In the case of independent neurons (Fig. 5A), a simple calculation yields
| (9) |
where we have chosen the value of the error threshold to be small enough that (see Supplementary Experimental Procedures 1.7 for derivations). In the correlated case (Fig. 5B), distributions are elongated and, provided the correlations values are chosen appropriately, error rates become vanishingly small even if the average firing rates of nearby distributions differ by no more than a few, say , spikes. We then obtain
| (10) |
since distribution centers can be arranged along a line that cuts through the space of responses—a square with side in the positive quadrant. (Note that more than one row of distributions may be fitted into the response space of the neural populations if the distributions are not too broad in their elongated direction, with a resulting enhancement of . Figure 5B illustrates a case in which three rows are accommodated. We do not include these extra encoded stimuli in our calculations, thus remaining more conservative in our estimate of coding capacity.) According to our earlier results (Fig. 3D), even in moderately small populations the error rate becomes exceedingly small for realistic choices of the correlation values when the distribution centers are two spikes away from each other. Thus, we can choose the value to obtain an estimate of . Putting all this together, find that for low enough correlated coding always wins over independent coding (Fig. 5C) because depends upon much more strongly than does. Furthermore, in the limit of small error thresholds, increasing the population size yields only a negligible enhancement of capacity in the case of independent neurons, whereas in the correlated case the number of faithfully encoded stimuli grows with population size (Fig. 5D).
Positive Correlations in a Diverse Neural Population Can Enhance Capacity by Orders of Magnitude
Our arguments suggest that we ought to examine the behavior of the capacity of heterogeneous neural populations because a greater degree of heterogeneity amounts to higher dimensional versions of the situations depicted in Figs. 5A and B, as we explain now. We define the -Pool model: a heterogeneous generalization of the 2-Pool model in which the neural population is divided into sub-populations. As before, firing rates and correlations are homogeneous within each pool and across pool pairs. For the sake of simplicity, we consider symmetric pools with neurons each; we also expect this arrangement to be optimal for coding. The state of the model is completely defined by the number of active neurons in each pool.
In order to estimate , we have to examine how probability distributions corresponding to different stimuli can be fitted within a -dimensional box enclosing neural states. And overlaps among distributions have to respect the prescribed error rate threshold. In the case of independent neurons we have to fit in -dimensional near-circular objects, whereas in the case of correlated neurons we have to fit in slender objects. It is intuitive that it is easier to pack cucumbers in a box than to pack melons of a comparable volume, because a greater amount of empty space is wasted in the case of spherical objects such as melons, and indeed we find here that a greater number of correlated distributions, as compared to independent distributions, can be packed in the space of responses. The calculation gives
| (11) |
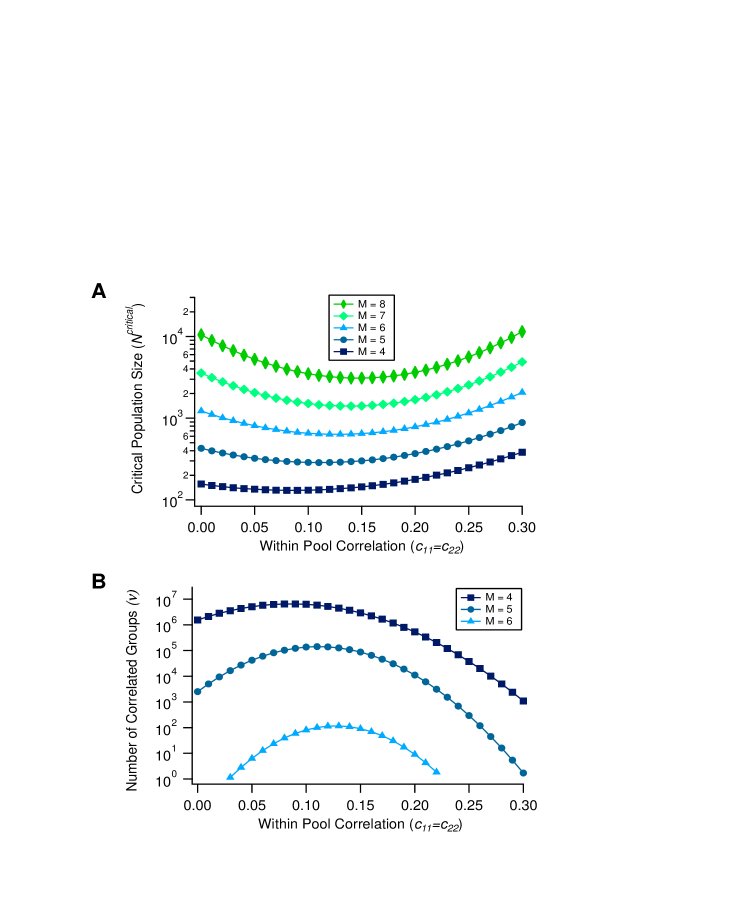
(Fig. 6A, see Supplementary Experimental Procedures 1.7 for derivations). Notice that the number of possible stimuli encoded by the independent population increases for greater heterogeneity (larger ).
In the case of correlated neurons, distributions may be compressed along one, two, …, or directions. In the latter case, indeed the most favorable scenario, we have to pack near-one-dimensional objects. As before in the case of -Pools, we can assume that neighboring distributions centers are separated by spikes, and we obtain
| (12) |
This simple result follows from the observation that distribution centers can be arranged on a hyperplane that cuts through the hypercube of the space of responses (see Supplementary Experimental Procedures 1.8 for a more detailed discussion an a slightly more careful bound). From these expressions we can conclude that the enhancement in capacity due to correlation is significant, and that the enhancement increases with the degree of heterogeneity (Fig. 6B).
The number of stimuli encoded with tolerable error rate, , scales differently with model parameters in the independent and correlated cases. In order to focus on this scaling behavior, we define the ‘capacity per neuron’, , by analogy to the information conveyed by each neuron in a population of perfectly deterministic neurons. In the latter case, the population has access to response patterns that can code for stimuli with perfect reliability. Each neuron conveys bit of information. Consequently, we define the capacity per neuron as
| (13) |
It is a measure of the mutual (Shannon) information per neuron in the population in the limit of very small .
To explore the scaling behavior of correlated versus independent populations, it is reasonable to ask what degree of heterogeneity, as measured by , maximizes for each value of . Equivalently, we can ask what pool size, , maximizes (Fig. 6C, see Supplementary Experimental Procedures 1.7 and 1.8). In the correlated case, the optimal capacity obtains when heterogeneity is strong, in fact so strong that the number of neurons per pool, , is as small as to neurons for the choice . From the optimal pool size, we find that the optimal value of the capacity per neuron is given by
| (14) |
and
| (15) |
in the independent and correlated cases respectively (see Supplementary Experimental Procedures 1.7 and 1.8 for derivations). The independent capacity becomes very small at low-error thresholds, while the correlated capacity remains fixed and in fact of the same order as the capacity of a perfectly reliable neuron (Fig. 6D). Thus, in the limit of low error, the capacity and hence information encoded per neuron exceeds the corresponding quantity in an independent population by more than a factor of . By comparison, one often finds analogous effects measured in a few percent in other studies.
We have put forth the following picture. For a neural population to code for a large set of inputs reliably, it breaks up into small pools with about ten neurons, with correlation across pools stronger than correlation within pools. These pools are small enough that their number is large, and consequently the response space is high-dimensional. But, at the same time, the pools are large enough that realistic correlations lock them in and yield effectively lower-dimensional response distributions.
Experimental Prediction and Plausibility of Correlated High-Fidelity Coding
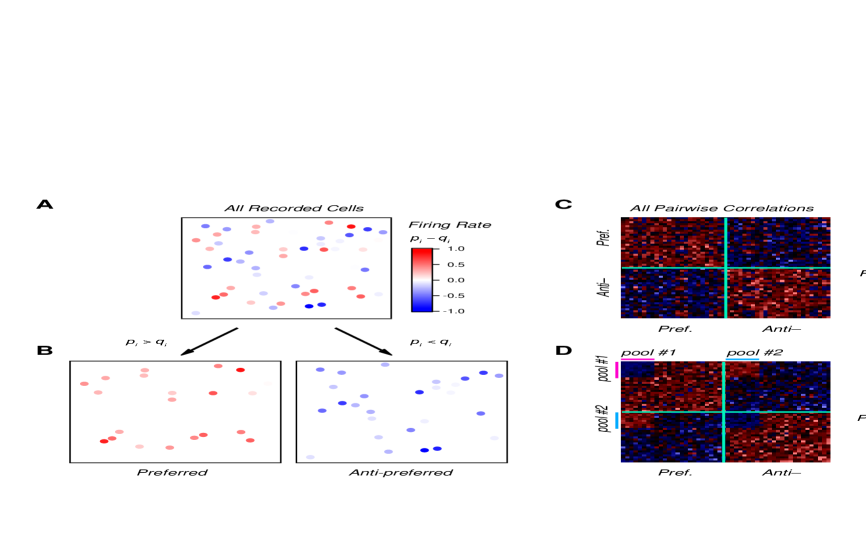
If neural populations rely upon correlation to achieve high-fidelity coding, we expect that patterns of correlations resembling those postulated in our model can be found in data. Namely, our hypothesis predicts that subsets of similarly tuned pools of neurons will exhibit weaker within-pool correlations than cross-pool correlations. In order to check this prediction, the response of a neural population to a pair of stimuli or a pair of stimulus classes has to be recorded (Fig. 7A). This population is divided into a group of cells that fire more strongly to the first stimulus and the rest that fire more strongly to the second stimulus (Fig. 7B). Note that this step is always possible and that all cells can be thus assigned.
One then searches for subsets of the population that have stronger correlation across the groups than within (Fig. 7C). For recordings with several tens of cells, there is a very large number of possible subsets, so an exhaustive search may not be feasible. Instead, there exist a number of faster search strategies. For instance, one can score each cell according to the sum of its pairwise correlation to all cells in the other group minus the sum to all cells within its stimulus-tuned group. This yields a rank ordering of cells, which can be used for selecting favorable subsets. In addition, searches can be made iteratively, starting with cells and finding the best next cell to add to the subset. Once a subset is identified, a quick assessment of the role of correlation can be made using average firing rates and correlations to calculate the error rate in the Gaussian approximation (Eq. (1)). As seen in Figs. 2 and 3, this approximation is highly accurate. Then, for the most favorable subsets, a maximum entropy calculation can be carried out to estimate the discrimination error taking into account the true experimentally observed heterogeneity. As indicated by Fig. 4, the homogeneous approximation is not only quite close to the real error rate, but it also serves as an upper bound on the error. In this manner, subsets of neurons with correlation patterns favorable to lock-in can be identified in neurophysiological recordings.
A detailed analysis of neurophysiological data must await a subsequent study. Here, we mention several observations which are consistent with our experimental prediction. Patterns of correlations with stronger cross-pool values may at first seem unlikely; this intuition comes mainly from our knowledge of the primary visual cortex and area MT, in which neurons with similar orientation tuning or directional preference are more strongly correlated, on average. But recent results in the literature hint to the fact that inverse patterns of correlation, with stronger cross-pool values, may well be present in the brain and favorable to coding. Romo and colleagues have reported precisely this phenomenon in S2 cortex: positive correlation among pairs of neurons with opposite frequency-tuning curves [31]. This pattern of correlation resulted in an improvement in the threshold for discrimination between different frequencies of tactile stimulation. Maynard and Donoghue similarly found that a model that incorporated correlation reduced discrimination errors, as compared to an independent model, for groups of up to 16 cells in M1 during a reaching task [42]. Here, correlations elongated the response distributions precisely in the manner depicted in Fig. 2B. Interestingly, Cohen and Newsome observed that MT neurons with widely different direction preferences displayed stronger positive noise correlation when the discrimination task was designed in such a way that, effectively, they belonged to different stimulus-tuned pools [43]. In another study cortical study, Poort and Roelfsema demonstrated that noise correlation can improve coding between V1 cells with different tuning, partially canceling its negative effect on cells with similar tuning [44]. Finally, Gutnisky and Dragoi [45] observed that after rapid (400 ms) adaptation to a static grating, pairwise correlation coefficients among neurons with similar tuning decreased more than for neurons with different tuning preferences — a trend in adaptation which agrees with the proposed favorable pattern of correlation.
Because favorable patterns of correlation can dramatically reduce the coding error even when they involve only a small number of neurons, the brain may take advantage of the heterogeneity of pairwise correlations to read out from small sub-populations which exhibit the proposed favorable pattern of correlation. In order to evaluate the plausibility of this scenario, we ask: If pairwise correlations are randomly distributed, with the experimental mean and standard deviation, then how likely is it to find a favorable pattern of correlation in a 2-Pool system with neurons in each pool within a local population? By local population we mean, for example, a cortical column with neurons. We find that a highly favorable pattern of correlation is present with significant probability provided , where the number can be estimated in terms of cortical parameters (see Supplementary Experimental Procedures 1.9). Favorably correlated patterns with 8 neurons () occur randomly with significant probability in local populations of no more than a few hundred neurons, and their analog with 16 neurons () occur randomly with significant probability in local populations of no more than a few thousand neurons (see Supplementary Fig. S2A).
In a large population with neurons, a great number of 2-Pool systems that are close to lock-in are bound to occur statistically (see Supplementary Experimental Procedures 1.9). Specifically, we find that in an overall local population of 1000 neurons, which might be thought of as the lower limit on the size of a cortical column, the number of favorable patterns present ranges from a few tens (for patterns with ) to several millions (for patterns with ) (see Supplementary Fig. S2B). Thus, while they may be hard to identify experimentally, small locked-in systems may populate cortical columns in a statistically significant manner.
Discussion
We have shown that a class of patterns of positive correlation can suppress coding errors in a two-alternative discrimination task (Figs. 2A and B). The idea that correlations among neurons may be favorable to coding was noted earlier. What is new, here, is the demonstration of the extreme degree of the enhancement in coding fidelity — several orders of magnitude rather than a few tens of a percent. Furthermore, this generic result does not require unrealistic values of correlation or population size: it can operate at the moderate values of correlations recorded experimentally (Figs. 2C and D) and in populations with as few as neurons (Figs. 3A and B). In fact, massive error suppression may occur even when average activities in a neural pool in response to different stimuli differ by one or a few spikes (Figs. 3C and D)—a limiting, but realistic, situation in which coding with independent neurons fails completely. The extreme nature of this effect makes it more likely that the brain might deploy resources to create these favorable correlation patterns.
We have also shown that correlations can boost dramatically the capacity of a neural population, i.e., the number of stimuli that can be discriminated with low error (Figs. 5 and 6). For independent neurons, the mean firing rates of the population in response to different stimuli must differ by a substantial amount to allow low error, because the firing variability about the mean is not harnessed by correlation. By contrast, in the presence of correlation, neural response distributions can deform into slender objects, effectively lower-dimensional objects, which can be fitted much more efficiently within the population’s response space (Fig. 5B). At lock-in, response distributions become strictly lower-dimensional (one-dimensional in the extreme case).
Finally, we have demonstrated that diversity in neuron-to-neuron response, and more generally heterogeneity of the population response, further enhances the effect of correlation (Fig. 4 and Figs. 6A and B). Indeed, the advantageous role of heterogeneity seems to be a rather general feature of population coding, and it has been illustrated within various approaches [30, 36, 41]. We refer to the phenomenon in which neural correlation suppresses the discrimination errors to negligible values and dramatically boosts the capacity of a population as high-fidelity coding. In passing, we note that high-fidelity coding does not, in principle, require equal-time correlation: the same mechanism can be at play when the correlations that matter involve different time bins, such as in ‘spike-latency codes’ [46].
Relation with Earlier Work on Coding with Correlation
A number of theoretical studies have explored the role of correlation in neural coding, with the use of different neuron models and information theoretic measures [24, 25, 26, 27, 28, 29, 30, 31, 32, 33, 34, 35, 36, 37, 38, 39]. If response properties are homogeneous among neurons, positive correlation is detrimental to coding: it tends to induce neurons to behave alike, and thereby suppresses the advantage of coding with a population rather than with a single cell (see Supplementary Text 2.2 for detailed arguments). By contrast, if response properties vary among neurons, positive correlation can be either unfavorable or favorable [27, 28, 29, 30, 33, 38, 36]. Put more generally, when the scale of correlation is comparable to that of the informative mode in the system (dictated, e.g., by the response tuning curve), then correlation enhances the confounding effect of noise (see Supplementary Text 2.3 for a simple illustration of this mechanism). But when the scale and structure of correlation is very different — as in the case of uniform positive correlations, in the case of negative correlations (anti-correlations), or in models with heterogeneity — correlation can relegate noise to a non-informative mode [27, 29, 30]. (We recall that we are focussing exclusively upon stimulus-independent correlations. When correlations depend upon the stimulus, they are evidently always favorable, as they represent an additional variable that can play a role analogous to the mean response [28, 30, 33, 35, 39]. Experiments indicate the presence of both stimulus-independent and stimulus-dependent correlations.)
In the case of stimulus-independent, positive correlation, earlier studies have formulated a mechanism by which correlation can relegate noise to non-informative models and, hence, enhance coding fidelity [24, 26, 27, 40, 29, 30, 31, 37, 38]. Namely, that negative signal correlations (anti-correlations) should be supplemented with positive noise correlations. To be explicit, this means that when neurons respond differentially to different stimuli, on average, then the variability about this average response should be correlated positively; this mechanism is illustrated in Fig. 1B and sets the stating point of our study. Conversely, negative correlations (anti-correlations) are favorable in the case of positive signal correlation. These statements have been established following different routes in the literature. They can be read off in full generality, that is, without invoking any particular neuron model or form of the neural response, from the expression of the mutual (Shannon) information [28, 32, 33, 38]. This is done by rewriting the mutual information in a form that displays contributions from firing rates, correlations, and the interplay of firing rate and correlation patterns. Approaches using the mutual information have the merit of elegance and generality. However, for quantitative estimates they require the implementation of specific response models; furthermore, they are difficult to apply to large populations of neurons because of sampling limitations and mathematical difficulties.
Similar results can be derived from the form of the Fisher information [27, 29, 30, 38], often used to establish bounds on the estimation variability in the case of continuous stimuli. Most studies consider neurons with broad tuning properties and find that positive correlations are unfavorable if they decay on the scale of the tuning curve. Positive correlations where observed to be favorable in cases in which they are uniform among all neurons or have a non-monotonic profile according to which similarly tuned neurons are less correlated than neurons that differ greatly in their tuning. In all cases, however, positive correlation enhanced the coding fidelity by modest amounts. In the next section, we discuss these quantitative aspects in greater detail, as well as their correspondence with our formulation and results.
In models of broadly tuned neurons with uniform pairwise correlation over the entire population, coding becomes increasingly reliable as the quantity tends to . For example, the Fisher information is boosted by a factor as compared to the case of independent neurons [27]. Thus, strong correlation-induced improvement in coding performance occurs only in the unrealistic limit of close to . The situation is different in our simple models. There, high-fidelity coding requires that the modified quantity approach , where is a weighted difference of cross-pool correlation values and within-pool values, be small (see, e.g., Eqs. (2) and (3)). The presence of similarly tuned pools of neurons, within the population, amplifies the effect of weak pairwise correlation to produce profound changes in the activity patterns of the neural population. Since correlation values are in the range , values of as modest as a few tens or a few hundreds are sufficient to bring the quantity of interest, , extremely close to . (Similarly, Sompolinsky et al. [29] showed that coding can be enhanced by a large factor in the presence of anti-correlations as weak as (as quoted, also, in Ref. [38]). This occurs for populations with neurons and it is yet another illustration of the significant effect that can take place when . In the present work, we have shown that similarly large effects can occur due to the experimentally more typical positive correlations, and in the context of much smaller neural population with no more than a few tens of neurons.)
We remark in passing that there are other mechanisms by which confounding noise can be relegated to non-informative dimensions. In the context of broadly-tuned neurons and long-range correlation—the usual setup of studies which make use of Fisher information—the presence of neuron-to-neuron variability (e.g., in the firing rates) can do the trick [30, 36]. In the absence of variability, positive correlation suppresses the coding performance as compared with an independent population. Neuron-to-neuron variability introduces a new dimension, namely, modulations much finer-grained than the scale of tuning and correlation, in which information is stored. Then, in a correlated population one retrieves, roughly, the coding performance of an independent population. This mechanism cannot, to our knowledge, generate substantial improvement in coding performance over that of an independent population.
Quantitative Aspects in Earlier and the Present Work — Error Rate and Capacity versus Shannon Information and Fisher Information
As mentioned in the introduction and in the previous section, earlier investigations which exhibit an improvement of the coding performance due to positive correlation find that the latter is rather limited quantitatively. Specifically, the Shannon information or the Fisher information (depending on the study) in the correlated population exceed that in the equivalent independent population by less than a factor of . As stated above, the Fisher information can be boosted by a factor as compared to its counterpart for a population of independent neurons; for typical choices of correlation values, this yields an improvement of . By contrast, in the present study we claim that positive correlation can enhance coding fidelity by astronomical factors, and that this effect exists even in small populations of neurons. But how are we to compared our results to earlier results, since former are expressed in terms of error rate and capacity while the latter are expressed in terms of information measures?
In the case of an unbiased estimator, the Fisher information, , bounds from below the discrimination error, , of a continuously variable stimulus: [47]. Thus, if the stimulus spans a space of size then the number of stimuli that can be distinguished reliably is calculated as
| (16) |
so that the capacity per neuron scales with the Fisher information as . (A rigorous version of this result was derived for a population of independent neurons in Refs. [48, 49].) If correlation enhances the Fisher information by a factor , , then the number of distinguishable stimuli is correspondingly enhanced according to . Thus, we have
| (17) |
and
| (18) |
or
| (19) |
We can now relate the earlier results in terms of Fisher information to our results in terms of capacity through these formulæ.
An enhancement of the Fisher information given by or, to be more specific, as suggested by earlier theoretical studies, amounts to a small increase of the number of distinguishable stimuli by a factor . Similarly, the difference between correlated and independent capacity per neuron decays inversely proportionately with ; in a large population, the improvement becomes negligible. By contrast, we found that the ratio can attain large values (, Fig. 6B) and that the difference between the correlated capacity per neuron, , and the independent capacity per neuron, , can be significant (Fig. 6D). In brief, earlier studies have demonstrated that, in spite of positive correlations, coding can be as efficient as in an independent population or even slightly better. Here, we show that, provided true population effects are taken into account, positive correlation can have a profound quantitative effect in that they can modulate the way coding measures scale with the number of neurons in the population and, as a result, yield a massive enhancement in coding fidelity.
To conclude the comparison among information measures, we note that, for continuous stimuli, Fisher Information is a natural performance metric. In this case, stimulus entropy always exceeds that of the population response, and the estimation variability decreases with population size, so that one is interested in quantifying the precision of estimation in the large- limit. By contrast, here we treat the case of a discrete stimulus, where the entropy is small and discrimination can be achieved with great reliability. This regime is clearly relevant to tasks like decision-making, language, and abstract thought: each categorization error imposes a cost on the organism, making it relevant to characterize coding performance using the error rate rather than the mutual information. Much of computational neuroscience work devoted to networks of neuron has focused upon large- situations. The regime at hand here is somewhat new in character: the largest number is not , the population size, but rather , the inverse discrimination error. In fact, a number of neurons as small as can achieve inverse error rate, , several orders of magnitude larger. Given the breath and accuracy of cerebral function, and the brain’s limited size, we expect this regime to be relevant to diverse instances of neural processing.
Other Strategies for Low-Error Coding
As explained in Supplementary Text 1.1, infinitesimal error is not a luxury, but a necessity in rapid coding if one wishes to avoid relatively frequent false alarms. We have shown here how correlations can enable population codes to perform with negligible error rates. However, other possible strategies for reducing false alarm errors exist: temporal integration and prior expectation. Both strategies effectively involve raising the detection threshold to suppress the false alarm rate. But both strategies involve trade-offs as well.
First, most stimuli in natural settings are present over periods of time longer than a few tens of milliseconds. Thus, in rapid coding a miss can be corrected: for a miss rate in a fundamental time window of 20 ms, a stimulus present during a period of 200 ms allows opportunities of detection. These multiple opportunities of detection reduce the overall miss rate to roughly , a much smaller quantity. However, the consequence is that the false alarm rate, is the short time window, increases to roughly (assuming ) in the long time window. This imbalance can be corrected by raising the detection threshold, (with instead of ), so that the false alarm rate goes down for detection in each fundamental time window. Because the false alarm rate is suppressed exponentially by raising the threshold, but only increased linearly by allowing detection in several successive time bins, such a strategy can be favorable. For instance, in the case of the independent code in Fig. 3, if the threshold is raised to boost the miss rate to about 10% (which corresponds to an increase by a factor of 53), then the false alarm rate is reduced from about 0.1% down to 0.0001% (which corresponds to a suppression by a factor of 850). The obvious cost of this strategy is that the presence of new objects in the visual world will be noted slowly, and if there are important objects that require rapid detection this delay and variability in detection may be unfavorable.
Second, prior expectation can modulate the balance between misses and false alarms in a favorable manner. The miss rate and the false alarm rate are weighed by the frequency of occurrence of stimuli, and (see Eqs. (4) and (5) in the Supplementary Experimental Procedures 1.2). In practice, these quantities are not known and must be estimated by a freely behaving animal. Changing their values amounts to weighing the two kinds of error—misses and false alarms—by their expectation with regards to the occurrence of stimuli. Mathematically, this is equivalent to weighing miss and false alarm rates as a function of the costs associated with them. Thus, the effects of expectation and cost can both be subsumed in the choice of the decoding boundary, . If the boundary is displaced toward the distribution corresponding to Target, then the miss rate increases while the false alarm rate decreases. The reverse occurs if the boundary is displaced toward the distribution corresponding to Distracter. Therefore, an object expected to be incredibly unlikely in a given environment can have its detection threshold raised substantially to prevent unwanted false alarms.
This strategy has the obvious drawback that if the rare object is actually present, it will be detected with difficulty. A behaving animal continually updates its internal representations of expectation and cost as a function of experience — a strategy often referred to as Bayesian decision-making. In a new overall visual context, an otherwise rare object may be more likely present, and the animal may consequently lower its detection threshold and, hence, render that object more easily visible. In addition, temporal integration can enhance the detectability of unexpected objects, thus helping to overcome a high detection threshold. But of course, both these methods require more time, so that they will not be effective for rapid detection. Furthermore, there are limits as to how high the miss rate can be allowed to increase without adverse behavioral consequences, which places limits on how effective these strategies can be in achieving very low false alarm rates.
For all these reasons, it is likely that these strategies are combined with population codes having intrinsically low error. In fact, the suppression of the false alarm rate by raising the threshold is much more effective if the distributions of neural activity are already well separated: in the example of the correlated code in Fig. 3, increasing the miss rate to reduces the false alarm rate by another factor of .
Models and Methods
Definitions of ‘Macroscopic’ and ‘Microscopic’ Correlations
We consider a neural population divided into homogeneous pools, labeled by , and we call the number of spikes fired in Pool in a given time bin. The ‘macroscopic’ correlation among pools, , is defined as
| (20) |
The ‘microscopic’ variable which characterizes the state of the neural population is ; or depending upon whether the th neuron in Pool is silent or fires a spike, respectively. The ‘microscopic’ correlation between neuron in Pool and neuron in Pool is then defined as
| (21) |
where is the firing rate in Pool .
Derivations of the Error Rate
Numerical procedure. The numerical computation of the error rate relies on maximum entropy probability distributions of the activity of neurons in each pool. The maximum entropy principle prescribes a unique form of the probability distribution, which depends on a set of parameters; it is then assured to be as broad as possible given the constraints on firing rate and correlation values. The correct parameter values are obtained by the numerical inversion described in Supplementary Experimental Procedures 1.3. Finally, the error rate is calculated according to the maximum likelihood rule. See the Supplementary Experimental Procedures 1.3 for details on maximum entropy and maximum likelihood prescriptions.
Analytical procedure. Here, the relevant variables are taken to be the spike counts (total number of spikes fired in a given time bin) in each pool. We then approximate the probability distributions of spike counts by a Gaussian form; the cross-correlation matrix is related to microscopic correlations according to Eqs. (22, 23). The error rate is then computed from the volume of the overlap between pairs of Gaussian probability distributions. See the Supplementary Experimental Procedures 1.4 for a step-by-step derivation.
Derivations of the Capacity
In order to maximize the encoding capacity of a neural population given an arbitrary error rate threshold , one has to find the optimal way of packing probability distribution of response patterns within the allowed space of spiking responses.
Independent neurons. For a pool of independent neurons with average spike count , the variability in the spike count scales like . Thus, probability distributions cannot be arranged in an equidistant manner: the center-to-center distance between probability distributions must grow at least as fast as (Fig. 5A). Using this consideration, we can establish a recursive relation between center-to-center distances between probability distributions, from which we calculate the optimal number of response distributions allowed in the space of spike counts. See the Supplementary Experimental Procedures 1.7 for a step-by-step derivation.
Correlated neurons. Close to the lock-in limit, the narrow extent of the response probability distributions is of order of a few spikes per pool (Fig. 3C and D). Thus, the corresponding, elongated distributions—which are perforce ‘parallel to each other’ since we assume that the correlation values do not depend upon the stimulus—can be arrange equidistantly and the center-to-center distance between neighboring distribution can be of order of a few spikes (Fig. 5B). As a result, in a system with neurons and pools, as many as response probability distributions can be packed with negligible error rates. See the Supplementary Experimental Procedures 1.8 for a more detailed argument and step-by-step derivations.
Acknowledgments
We are grateful to M. Kardar and J.-P. Nadal for fruitful discussions.
References
- 1. Barlow HB, Levick WR (1969) Three factors limiting the reliable detection of light by retinal ganglion cells of the cat. J Physiol 200: 1-24.
- 2. Hecht S, Shlaer S, Pirenne M (1942) Energy, quanta, and vision. J Gen Physiol 25: 819-840.
- 3. Klein SA, Levi DM (1985) Hyperacuity thresholds of 1 sec: theoretical predictions and empirical validation. J Opt Soc Am A 2: 1170-90.
- 4. Newsome WT, Britten KH, Movshon JA (1989) Neuronal correlates of a perceptual decision. Nature 341: 52-4.
- 5. Watson AB, Barlow HB, Robson JG (1983) What does the eye see best? Nature 302: 419-22.
- 6. Barlow HB, Levick WR, Yoon M (1971) Responses to single quanta of light in retinal ganglion cells of the cat. Vision Res Suppl 3: 87-101.
- 7. Parker A, Hawken M (1985) Capabilities of monkey cortical cells in spatial-resolution tasks. J Opt Soc Am A 2: 1101-14.
- 8. Kirchner H, Thorpe SJ (2006) Ultra-rapid object detection with saccadic eye movements: visual processing speed revisited. Vision Res 46: 1762-76.
- 9. Liu H, Agam Y, Madsen JR, Kreiman G (2009) Timing, timing, timing: fast decoding of object information from intracranial field potentials in human visual cortex. Neuron 62: 281-90.
- 10. Hatsopoulos NG, Ojakangas CL, Paninski L, Donoghue JP (1998) Information about movement direction obtained from synchronous activity of motor cortical neurons. Proc Natl Acad Sci U S A 95: 15706-11.
- 11. Mastronarde DN (1989) Correlated firing of retinal ganglion cells. Trends Neurosci 12: 75-80.
- 12. Ozden I, Lee HM, Sullivan MR, Wang SS (2008) Identification and clustering of event patterns from in vivo multiphoton optical recordings of neuronal ensembles. J Neurophysiol 100: 495-503.
- 13. Perkel DH, Gerstein GL, Moore GP (1967) Neuronal spike trains and stochastic point processes. ii. simultaneous spike trains. Biophys J 7: 419-40.
- 14. Sasaki K, Bower JM, Llinas R (1989) Multiple purkinje cell recording in rodent cerebellar cortex. Eur J Neurosci 1: 572-586.
- 15. Shlens J, Rieke F, Chichilnisky E (2008) Synchronized firing in the retina. Curr Opin Neurobiol 18: 396-402.
- 16. Usrey WM, Reid RC (1999) Synchronous activity in the visual system. Annu Rev Physiol 61: 435-56.
- 17. Vaadia E, Haalman I, Abeles M, Bergman H, Prut Y, et al. (1995) Dynamics of neuronal interactions in monkey cortex in relation to behavioural events. Nature 373: 515-8.
- 18. Bair W, Zohary E, Newsome WT (2001) Correlated firing in macaque visual area mt: time scales and relationship to behavior. J Neurosci 21: 1676-97.
- 19. Fiser J, Chiu C, Weliky M (2004) Small modulation of ongoing cortical dynamics by sensory input during natural vision. Nature 431: 573-8.
- 20. Kohn A, Smith MA (2005) Stimulus dependence of neuronal correlation in primary visual cortex of the macaque. J Neurosci 25: 3661-73.
- 21. Lee D, Port NL, Kruse W, Georgopoulos AP (1998) Variability and correlated noise in the discharge of neurons in motor and parietal areas of the primate cortex. J Neurosci 18: 1161-70.
- 22. Zohary E, Shadlen MN, Newsome WT (1994) Correlated neuronal discharge rate and its implications for psychophysical performance. Nature 370: 140-3.
- 23. Ecker AS, Berens P, Keliris GA, Bethge M, Logothetis NK, et al. (2010) Decorrelated neuronal firing in cortical microcircuits. Science 327: 584-587.
- 24. Johnson KO (1980) Sensory discrimination: decision process. J Neurophysiol 43: 1771-92.
- 25. Vogels R (1990) Population coding of stimulus orientation by striate cortical cells. Biological Cybernetics 64: 25-31.
- 26. Oram MW, Foldiak P, Perrett DI, Sengpiel F (1998) The ’ideal homunculus’: decoding neural population signals. Trends Neurosci 21: 259-65.
- 27. Abbott LF, Dayan P (1999) The effect of correlated variability on the accuracy of a population code. Neural Comput 11: 91-101.
- 28. Panzeri S, Treves A, Schultz S, Rolls ET (1999) On decoding the responses of a population of neurons from short time windows. Neural Comput 11: 1553-77.
- 29. Sompolinsky H, Yoon H, Kang K, Shamir M (2001) Population coding in neuronal systems with correlated noise. Phys Rev E Stat Nonlin Soft Matter Phys 64: 051904.
- 30. Wilke SD, Eurich CW (2002) Representational accuracy of stochastic neural populations. Neural Comput 14: 155-89.
- 31. Romo R, Hernandez A, Zainos A, Salinas E (2003) Correlated neuronal discharges that increase coding efficiency during perceptual discrimination. Neuron 38: 649-57.
- 32. Golledge HD, Panzeri S, Zheng F, Pola G, Scannell JW, et al. (2003) Correlations, feature-binding and population coding in primary visual cortex. Neuroreport 14: 1045-50.
- 33. Pola G, Thiele A, Hoffmann KP, Panzeri S (2003) An exact method to quantify the information transmitted by different mechanisms of correlational coding. Network 14: 35-60.
- 34. Averbeck BB, Lee D (2003) Neural noise and movement-related codes in the macaque supplementary motor area. J Neurosci 23: 7630-41.
- 35. Shamir M, Sompolinsky H (2004) Nonlinear population codes. Neural Comput 16: 1105-36.
- 36. Shamir M, Sompolinsky H (2006) Implications of neuronal diversity on population coding. Neural Comput 18: 1951-86.
- 37. Averbeck BB, Lee D (2006) Effects of noise correlations on information encoding and decoding. J Neurophysiol 95: 3633-44.
- 38. Averbeck BB, Latham PE, Pouget A (2006) Neural correlations, population coding and computation. Nat Rev Neurosci 7: 358-66.
- 39. Josic K, Shea-Brown E, Doiron B, de la Rocha J (2009) Stimulus-dependent correlations and population codes. Neural Comput 21: 2774-804.
- 40. Petersen RS, Panzeri S, Diamond ME (2001) Population coding of stimulus location in rat somatosensory cortex. Neuron 32: 503-514.
- 41. Osborne LC, Palmer SE, Lisberger SG, Bialek W (2008) The neural basis for combinatorial coding in a cortical population response. J Neurosci 28: 13522-31.
- 42. Maynard EM, Hatsopoulos NG, Ojakangas CL, Acuna BD, Sanes JN, et al. (1999) Neuronal interactions improve cortical population coding of movement direction. J Neurosci 19: 8083-93.
- 43. Cohen MR, Newsome WT (2008) Context-dependent changes in functional circuitry in visual area mt. Neuron 60: 162-173.
- 44. Poort J, Roelfsema PR (2009) Noise correlations have little influence on the coding of selective attention in area v1. Cereb Cortex 19: 543-53.
- 45. Gutnisky DA, Dragoi V (2008) Adaptive coding of visual information in neural populations. Nature 452: 220-4.
- 46. Gollisch T, Meister M (2008) Rapid neural coding in the retina with relative spike latencies. Science 319: 1108-1111.
- 47. Cover T, Thomas J (1991) Elements of information theory .
- 48. Brunel N, Nadal JP (1998) Mutual information, fisher information, and population coding. Neural Computation 10: 1731–1757.
- 49. Kang K, Sompolinsky H (2001) Mutual information of population codes and distance measures in probability space. Physical Review Letters 86: 4958.
- 50. Butts DA, Weng C, Jin J, Yeh CI, Lesica NA, et al. (2007) Temporal precision in the neural code and the timescales of natural vision. Nature 449: 92-5.
- 51. Schneidman E, Berry n M J, Segev R, Bialek W (2006) Weak pairwise correlations imply strongly correlated network states in a neural population. Nature 440: 1007-12.
- 52. Gawne TJ, Kjaer TW, Hertz JA, Richmond BJ (1996) Adjacent visual cortical complex cells share about 20 Cereb Cortex 6: 482-9.
- 53. Reich DS, Mechler F, Victor JD (2001) Independent and redundant information in nearby cortical neurons. Science 294: 2566-8.
- 54. Gawne TJ, Richmond BJ (1993) How independent are the messages carried by adjacent inferior temporal cortical neurons? J Neurosci 13: 2758-71.
- 55. Salinas E, Hernandez A, Zainos A, Romo R (2000) Periodicity and firing rate as candidate neural codes for the frequency of vibrotactile stimuli. J Neurosci 20: 5503-15.
- 56. Averbeck BB, Lee D (2004) Coding and transmission of information by neural ensembles. Trends Neurosci 27: 225-30.
- 57. Lang EJ, Sugihara I, Welsh JP, Llinas R (1999) Patterns of spontaneous purkinje cell complex spike activity in the awake rat. J Neurosci 19: 2728-39.
- 58. Nadal JP Private communication .
- 59. Velliste M, Perel S, Spalding MC, Whitford AS, Schwartz AB (2008) Cortical control of a prosthetic arm for self-feeding. Nature 453: 1098–1101.
- 60. Jarosiewicz B, Chase SM, Fraser GW, Velliste M, Kass RE, et al. (2008) Functional network reorganization during learning in a brain-computer interface paradigm. Proceedings of the National Academy of Sciences 105: 19486–19491.
- 61. Ganguly K, Carmena JM (2009) Emergence of a stable cortical map for neuroprosthetic control. PLoS biology 7: e1000153.
- 62. Richter H, Magnusson S, Imamura K, Fredrikson M, Okura M, et al. (2002) Long-term adaptation to prism-induced inversion of the retinal images. Experimental brain research 144: 445–457.
High-Fidelity Coding with Correlated Neurons
Supplementary Material
Rava Azeredo da Silveira1,2,3,∗, Michael J. Berry
II4,†
1 Department of Physics, Ecole Normale Supérieure, 24 rue
Lhomond, 75005 Paris, France
2 Laboratoire de Physique
Statistique, Centre National de la Recherche Scientifique, Université
Pierre et Marie Curie, Université Denis Diderot, France
3 Princeton Neuroscience Institute, Princeton University, Princeton,
New Jersey 08544, U. S. A.
4 Department of Molecular Biology,
Princeton University, Princeton, New Jersey 08544, U. S. A.
E-mail: rava@ens.fr
E-mail:
berry@princeton.edu
1 Supplementary Methods
1.1 Assumptions used in our approach
The reliability with which the activity of a neural population encodes sensory inputs can be quantified in a two-alternative forced choice task that caricatures everyday vision: readout neurons must tell two stimuli apart. In everyday vision, we often have to identify a given stimulus (e.g., a known face) against a multitude of other stimuli (e.g., a crowd of unknown faces), so, by analogy, we refer to the two stimuli in the discrimination task as ‘Target’ and ‘Distracter’. These can be two specific stimuli (e.g., a specific dog vs. a specific cat), a specific stimulus and a stimulus category (e.g., a specific dog vs. all other dogs), or two stimulus categories (e.g., dogs vs. cats); while the book-keeping of input statistics and coding errors may differ among these cases, the conceptual problem is the same and so is its quantification. In the companion paper, first we discuss coding performance in the context of the two-alternative forced choice task. Then we extend the discussion to the more general case of the discrimination among a large set of stimuli.
Since we are interested in rapid coding, we focus on short time windows. The biophysical time scale of neurons—a few tens of milliseconds—affords us with a natural choice. This time scale also happens to correspond to the spike timing jitter of individual neurons in the early visual pathway in response to a natural movie clip [50]. We consider short time bins in which each neuron can only fire one spike or none at all. (As we argue in the companion paper, this last assumption is not essential. In the more general case in which many spikes can fit in a time bin, our qualitative conclusions remain unchanged or may even become stronger.) The situation we have in mind is one in which a stimulus is presented once every time bin, and the corresponding population response is recorded. At each occurrence, the stimulus may be either the Target (which can mean either a specific stimulus or a class of stimuli), with probability , or the Distracter (which is all other stimuli and can mean either a specific stimulus, a stimulus class, or an entire stimulus ensemble), with probability .
In each time bin, the neural population represents information about the stimulus in its activity pattern. If the set of population patterns that occur in response to Target is disjoint from the set of population patterns that occur in response to Distracter, then the encoded information reaches its maximum and discrimination can be perfectly reliable. But, quite generally, neural variability causes some patterns to occur in response to both Target and Distracter. These cannot be interpreted unambiguously by any deterministic readout circuit, and some error must result.
1.2 Maximum likelihood error bound
In the absence of detailed knowledge about the decoding algorithm employed by readout neurons, we can still establish a bound on performance. This bound is derived from maximum likelihood decoding—an algorithm that minimizes the error rate of deterministic decoding [47]. It assigns Target to a response pattern, , if and, conversely, it assigns Distracter to a response pattern, , if , where and denote the probability that Target and Distracter, respectively, were presented given that the response pattern is . The miss rate—the fraction of instances in which Distracter is mistaken for Target—is then calculated as
| (24) |
where is the probability to record a response pattern (regardless of the stimulus presented). Similarly, the false alarm rate—the fraction of instances in which Target is mistaken for Distracter—is calculated as
| (25) |
The total error rate committed by maximum likelihood decoding,
| (26) |
is a lower bound to the error rate committed by any deterministic decoder. Readout neurons make at least errors per unit time. Throughout, we use the error rate, , as a measure of the fidelity of the neural population to contrast the coding performance of independent neural populations versus correlated neural populations.
Since experiments record the rate of occurrence of neural responses given the stimuli, namely the probabilities and , and not the other way around, it is often advantageous to express the miss and false alarm rates in terms of these measurable quantities, as
| (27) |
and
| (28) |
In the laboratory, and are controlled by the experimenter; in natural situations, and can be thought of as the subject’s expectation of the chances of occurrence of the respective stimuli.
In general misses and false alarms are not symmetric, as they represent different kinds of errors. In some situations, one may wish to limit the rate of false alarms more stringently than that of misses, or vice versa. A convenient way to impose such a condition is to introduce a threshold, , greater or smaller than one, when comparing and , and consequently to generalize the error rates to
| (29) |
| (30) |
We discuss the asymmetry between misses and false alarms, and the corresponding role of the threshold, , in the Discussion of the companion paper.
1.3 2-Pool model of correlated neurons: coding error — numerical treatment
The numerical procedure begins by dividing a population with neurons into two homogeneous pools with and neurons respectively. In terms of the spike counts in each pool, and , the maximum entropy distribution [51] of the population activity reads
| (31) |
where
| (32) |
and or . The five parameters, , , , , , are found by direct numerical solution, such that the firing rates of individual neurons in each other the two pools, and , and the normalized pairwise correlations, (within Pool 1), (within Pool 2), (across Pools 1 and 2), take given values. (Throughout, we borrow symmetric choices (Fig. 2A). That is, in response to Target the firing rates are and in Pools 1 and 2 respectively, while in response to Distracter the firing rates are swapped, i.e., and , in Pools 1 and 2 respectively. The same holds for the correlation values and .) We then apply the maximum likelihood rule to derive the coding error rate (Figs. 2 and 3).
The choice of maximum entropy distributions is a reasonable one for establishing upper bounds on the error rate, as these distributions are ‘as spread out as possible’ given the constraints on firing rates and correlations. Strictly speaking, true bounds are obtained from minimum mutual information distributions, but we expect the results to be close to those obtained from maximum entropy distributions. This expectation is substantiated by the results obtained from Gaussian approximations—see the remarks at the end of the next section.
1.4 2-Pool model of correlated neurons: coding error — Gaussian approximation
We consider a 2-Pool population with neurons. For the sake of simplicity, we focus on a symmetric case with neurons in each pool, firing rates and in response to Target and Distracter, respectively, in Pool 1, and vice versa firing rates and in response to Target and Distracter, respectively, in Pool 2. As above, the within-pool correlations are denoted and , while denotes the pairwise correlation across the two pools. With these hypotheses, a Gaussian approximation to the probability of response to Target reads
| (33) |
where and are the spike counts in Pools 1 and 2 respectively. Here, we use the vector notation with
| (34) | ||||
| (35) | ||||
| (36) |
and the covariance matrix
| (37) |
A similar expression approximates the probability of response to Distracter, but with and swapped. (The firing rates depend upon the stimulus, but the correlations do not.) For calculational ease, we give a name to the inverse covariance matrix:
| (38) |
We calculate the maximum likelihood error by saddle-point integration about the (symmetric) point of maximum equiprobability, , obtained by maximizing the quantity
| (39) |
as
| (40) |
Then, saddle-point integration yields a coding error rate
| (41) |
Performing the two-dimensional Gaussian integrals and including contributions from both misses and false alarms, we obtain
| (42) |
After we replace and by and respectively, as well as the matrix elements, , by their expression in terms of the pairwise correlation values, , we retrieve Eqs. (1) and (2) in the companion paper. From the form of Eq. (2), in general we require
| (43) |
for the quantity to approach zero at large and, consequently, for the error rate to become negligible according to Eq. (1). Similarly, at fixed , increasing the cross-pool correlation decreases the denominator and hence the error rate, while increasing within-pool correlation, either or , increases the error.
We emphasize the agreement between the numerical and the analytical results (dots versus solid lines in Figs. 2A-D and Figs. 3A and C), which is not to be expected in general and is encouraging here. Indeed, numerical results are derived by making use of maximum entropy distributions. These are as broad as the constraints on firing rates of individual neurons and pairwise correlations allow, yet when expressed in terms of spike counts their tails fall off more rapidly than Gaussian tails. Estimations of the error rate from maximum entropy distributions and from Gaussian distributions coincide. We recall that the maximum likelihood error is dominated by the height of the distributions at equiprobability. So the quantitative similarity between numerical and Gaussian results means that, even for very stringent error thresholds, the asymptotic behavior of the tails does not play a dominant role.
1.5 Arguments for lock-in beyond a Gaussian approximation
Here, we present general arguments on the role of correlation in high-fidelity coding, which do not rely on a Gaussian approximation of probability distributions. We assume only that the probability distributions of spike counts in response to Target and Distracter are ‘well-behaved’; specifically, that they each have a single maximum and that their tails decay rapidly enough. Then the knowledge of the correlation structure is sufficient to discuss the degree of their overlap and, hence, the coding error rate. For the sake of simplicity we still consider a 2-Pool model, but our arguments can be transposed to the general case of a -Pool model.
We start by examining the quantity
| (44) |
where is a unit vector along the direction given by the angle and is the vector of spike counts. This quantity is calculated as
| (45) | ||||
| (46) |
i.e., it is the variance along the direction prescribed by the unit vector in the -plane of spike counts. Optimizing with respect to the rotation angle, we find that it reaches its minimal and maximal values,
| (47) |
along the two orthogonal angles given by
| (48) |
This expression can also be written in terms of the microscopic correlations as
| (49) |
As mentioned in the companion paper, for positive correlation the angle along which the distribution elongates, (Fig. 1B), lies between and . The other solution of this equation lies at right angle with , , and defines the direction of ‘probability compression’. The quantities that govern overlap suppression are the small variances, , and the angles , for each of the two distributions corresponding to Target and Distracter. The error rates decrease with smaller and more parallel distributions.
The positivity of implies a constraint upon the values of the macroscopic correlations:
| (50) |
In terms of the microscopic correlations, the inequality reads
| (51) |
This condition amounts to the positivity of probability. When equality is achieved, the corresponding probability distribution becomes infinitely thin along one direction, i.e., the probability of any state in the -plane away from this line vanishes. When equality is achieved, we say that the neural population is ‘locked-in’; in this case, the coding error rate can vanish. When correlation values are such that the inequality is satisfied, and hence the coding error rate can be massively suppressed, we refer to the pattern of correlation as ‘favorable’.
We note in passing that a vanishing error in the Gaussian approximation, i.e., (see Eq. (2) in the companion paper), corresponds to two ‘infinitely thin’ probability distributions whose directions of largest variance are parallel. Indeed, the condition , which occurs when , together with the condition (see Eq. (48) above) imply
| (52) | ||||
| (53) |
i.e., .
1.6 Robustness of high-fidelity coding with respect to parameter variations
High-fidelity coding results from the suppression of overlap among response probability distributions corresponding to different stimuli. By tuning one combination of the correlation parameters, distributions become thin (i.e., favorable), and we have demonstrated that this can occur for realistic values of the correlations. But even in the singular limit of infinitely thin (i.e., locked-in) distributions, independent parameters are left free, namely, the orientations of the principal axes of the distributions or, equivalently, the angles along which the elongated distributions lie in the plane. We have denoted this angle by (Fig. 1B). An important question is whether these parameters have to be fine-tuned for high-fidelity coding. In the present section, we show that no fine-tuning is necessary: high-fidelity coding operates over a wide range of parameter choices (Supplementary Fig. S1).
Consider, for example, the dependence of the error rate upon the cross-pool correlation strength, , for several choices of the angle (Supplementary Fig. S1A). Clearly, when the two distributions corresponding to Target and Distracter are elongated along the same direction (here the diagonal, , because of our choice of symmetric parameters), the error rate plunges down to vanishing numbers for appropriate correlation values. If the two distributions are not parallel, there always remains some overlap, even if they are infinitely thin. However, this overlap is so small that, even when the angle differs from the diagonal by as much as , the error rate is suppressed by more than ten orders of magnitude (Supplementary Fig. S1A).
In order to explore the parameter dependence of the error rate, we set a (small) ‘error rate threshold’, , not to be exceeded. The closer and are, i.e., the more similar the mean responses to Target and the response to Distracter, then the more stringent becomes the threshold condition, , upon the parameters of the model. An arbitrary threshold—here, we choose —defines a corresponding ‘angle bandwidth’: a range of distribution angles, , within which the error rate remains below threshold (Supplementary Fig. S1B). We selected the value of the error threshold to be sufficiently low that networks within the angle bandwidth contribute fewer than a single error per human lifetime. Clearly, the angle bandwidth depends upon all other model parameters. The closer the firing rates and in response to Target and Distracter respectively, the closer the two distributions lie and, hence, the more precisely their angle has to be tuned for error rate suppression. Yet, even when the average activities in the two pools differ by as little as two to five spikes, the angle bandwidth remains as large as to over a wide range of correlation values (Supplementary Fig. S1B and C). Thus, error rate suppression is robust to small parameter variations.
1.7 -Pool model of independent neurons: coding capacity
For an estimate of the coding capacity of a population of independent neurons, we approximate the spike count distribution by a Gaussian with appropriate mean and variance. In the 1-Pool case with neurons, this distribution reads
| (54) |
where is the mean spike count and the variance. We then ask, given one such distribution with parameter , how far away along the -line should a distribution, with parameter , be placed so that the probability not exceed a small value, , a the point of equiprobability, :
| (55) |
We find that we have to require
| (56) |
where we have assumed that and . From this recursion, we find that we can ‘fit’ as many as
| (57) |
well-separated different probability distributions of spike counts, in a 1-pool population with neurons.
In the 2-Pool case, we calculate similarly the number, , of well-separated probability distributions that can be fit within the positive quadrant of the -plane of spike counts. Here, and each run from to , so is roughly evaluated as
| (58) |
We can extend the derivation to the general -Pool case, in which each axis of the response space runs from to , so that
| (59) |
By analogy with a population of deterministic neurons, we define the capacity per neuron, , as
| (60) |
In the deterministic case, the population as a whole codes for states and the capacity per neuron is equal to 1 bit. In the case of independent, but stochastic, neurons,
| (61) |
where
| (62) |
is the number of neurons per pool. The capacity decreases with decreasing . For a given value of , the capacity is maximal for a characteristic pool size which depends upon but does not depend upon and which can be calculated perturbatively. A rough estimation of this characteristic pool size yields
| (63) |
and a maximal capacity per neuron given by
| (64) |
Equivalently, the number of stimuli that a population of independent neurons can encode with an error threshold is limited by
| (65) |
1.8 -Pool model of correlated neurons: coding capacity
We derive an estimate of the capacity in the correlated case by evaluating how many ‘thin probability distributions’ can be fitted in the quadrant of possible response patterns defined by . In a 2-Pool population (), we can arrange one row of ‘parallel distributions’ along the diagonal that connects the points and in the plane. (Three such rows are displayed in Fig. 6B.) If neighboring distribution centers differ by spike, this manipulation yields a number
| (66) |
of well separated probability distributions that the population can code for. Similarly, in the general -Pool case we arrange a set of correlated distributions across a hyperplane within the hypercube with edge in the space. Such a configuration immediately yields a scaling
| (67) |
where
| (68) |
is the number of neurons per pool, as before. To be more precise, we can bound from below. If we are concerned that distributions may overlap near the faces of the hypercube, we can, for example, allow them to fill only a central half of the hyperplane. Furthermore, if neighboring distribution centers are separated by spikes, we obtain
| (69) |
This quantity behaves differently from its counterpart in the independent case: for a wide range of even vanishingly small error thresholds, is essentially independent of the error threshold as realistic values of the correlation coefficients can be chosen so as to make the distributions much narrower than . For fixed , this bound scales with in a trivial manner akin to the independent case. Indeed, the capacity per neurons,
| (70) |
here becomes
| (71) |
The capacity per neuron is maximized for
| (72) |
where is Euler’s constant, and is evaluated as
| (73) |
We find
| (74) |
and
| (75) |
Correspondingly,
| (76) |
and
| (77) |
As opposed to the case of independent neurons, here one does not need to invoke large values of for low-error coding. This is because is not the only parameter from which the system can take advantage to suppress error rates; for each value of , the correlation coefficients may be tuned to suppress error rates. We emphasize that the result for optimality, with , is self-consistent: low-error coding can indeed occur with such small pool sizes (see Fig. 3).
We find that, in a correlated population, each neuron can carry as much as to bits of information. This result is to be contrasted with the absolute maximum of bit of information in the case of independent, deterministic neurons and with the corresponding result for independent, stochastic neurons, Eq. (64). In the correlated case, the optimal capacity per neuron is fixed, whereas in the independent case it drops with . In particular, from Eqs. (64) and (73) with , we conclude that individual neurons are more informative in a correlated population, as compared to an independent population, as soon as the error rate threshold, , falls below . Thus, for any realistically small value of the error rate threshold, correlated populations are favored.
Taking the 2-Pool model as an example, we note that only for relatively large values of the parameters (e.g., or ) does compare with . At relatively low threshold values (), remains well below for any reasonable (and even large) value of the population size (Fig. 5D), as the behavior of is dominated by rather than by (Fig. 5D). This behavior obtains because the nearly isotropic tails of the distributions for independent neurons forbid the presence of more than one or a few distribution centers within the space of neural responses, if the error threshold is stringent.
It is worth mentioning that for loose error thresholds may exceed . This results from the fact that independent distributions are arranged on a two-dimensional grid, whereas correlated distributions, which are compressed along one direction, are arranged along a line (along the ‘compressed direction’). Thus, independent distributions can take advantage of the possible positions of their centers, whereas correlated distributions have only choices.
1.9 Estimation of the occurrence of favorable patterns of correlation in cortical networks
In order to estimate the probability of occurrence of favorable patterns of correlation in the brain, we rely upon constraints imposed by the following experimental results. Overall, similar values of the average strength of noise correlation have been reported in many cortical areas: in MT [22, 18], V1 [52, 53, 20] (but see Ref. [23] for a report of smaller values), IT [54], and M1 [42], in somatosensory cortex [55]. We note in passing that a comparable number, , was recorded for complex spikes from nearby Purkinje cells in the cerebellum [12]. Values of pairwise correlation depend on the time scale they are measured over [56], with somewhat smaller values found in time bins of ms, [57, 51]. What is striking about these observations is the degree of heterogeneity in measured pairwise correlations. While many studies have emphasized the average value, the distribution of values spreads in the range or even beyond [18, 42, 20].
Experimental data are not yet detailed enough to resolve the shape of the distribution with precision. In our calculation, we assume a Gaussian distribution of correlation coefficients, with a mean of 0.2 and a standard deviation of 0.2 [18, 20], although other similar assumptions, such as flat distribution in the range , do not change our results appreciably. We consider an overall local population with neurons and look for favorable 2-pool sub-populations contained within it, with neurons in each pool. The estimation is obtained by evaluating the number of possible 2-pool populations within the overall population, on the one hand, and the probability that the 2-pool population is locked in, on the other hand, and then by comparing the two quantities.
The number of distinct 2-pool populations within the overall population is calculated as
| (78) |
Using Stirling’s approximation of the factorial and assuming that is much smaller than , we obtain
| (79) | ||||
| (80) |
As for the probability of a lock-in correlation pattern in the 2-pool population, we require that within-pool correlations not exceed a given value, , and cross-pool correlations be at least another value, . Lock-in requires that the cross-pool correlation exceed the in-pool correlation, so we pick an arbitrary correlation value () and we pose that within-pool correlations lie below this value. In the symmetric case, one approaches lock-in if cross-pool correlation coefficients are comparable to (from Eq. (9) in the companion paper). Thus, we examine the probability of occurrence of a 2-pool system with all in-pool correlations bounded above by and all cross-pool correlations bounded below by . This probability is calculated as
| (81) | ||||
| (82) |
where and are cumulative probabilities of weakly and strongly correlated pairs of neurons respectively. If the data are fitted with a Gaussian distribution, , then
| (83) |
and
| (84) |
By comparing the above expressions of and , we obtain estimates of the critical size of a local population, beyond which favorable patterns of correlation occur with significant probability, and of the number of favorable patterns that occur randomly within a large local population. We find that a favorable pattern of correlation is present with significant probability provided
| (85) |
(Supplementary Fig. S2A). In a sufficiently large local population (much larger than ), one expects to find a large number, , of 2-Pool systems that are close to lock-in. From our above arguments, we estimate that this number scales roughly as
| (86) |
(Supplementary Fig. S2B).
In order to optimize the argument, we can tune — the only free quantity since we have required — so as to maximize the product and, hence, maximize . But we are not concerned by numerical considerations such as this one, as we have laid down a coarse argument. First, we have assumed that correlation values for pairs of neurons are drawn randomly from their distribution. This is likely not the case in reality, where spatial correlations of pairwise correlations are to be expected in neural populations. Moreover, because of the bound in Eq. (50), the 2-pool pattern we adopted, with in-pool correlations weaker than and cross-pool correlations stronger than , is not realizable even theoretically. (Similar but more complicated correlation patterns would fix the problem without changing the essence of the argument.) Second, the 2-pool populations, as we count them, are distinct but overlapping, and hence the probabilities of their correlation patterns are not independent. The discrepancy is minor provided the product be sufficiently small.
Our argument assumes a random arrangement of pairwise correlations. Instead, the brain could use learning mechanisms to select for such patterns and hence produce them in far greater numbers. What our simple argument illustrates is that the observed heterogeneity of pairwise correlations makes it plausible that lock-in patterns of correlation may be found among subsets of neurons in the cortex. Finally, this discussion has focused on noise correlation, but it is important to note that if visual discrimination is between classes of visual stimuli rather than individual stimuli, then signal correlation within those classes will also contribute to the total correlation in the neural population. Signal correlations are typically stronger than noise correlations
2 Supplementary Discussion
2.1 Sensory coding requires extremely low error rates
Everyday vision occurs in a different regime than that probed in many of the classic studies in visual psychophysics. Our retina is presented with complicated scenes in rapid succession—either because of saccadic eye movements or because of motion in the scene itself—from an enormous set of possibilities. Often, we seek to recognize the presence of a target stimulus or stimulus class and distinguish it from every other possible stimulus. For example, we might want to recognize a friend’s face in a particular spatial location. That location might contain another person’s face, or a flower, or myriad other objects, which we do not want to mistake for our friend’s face. Alternatively, the target stimulus is often a class of related stimuli, such as that friend’s face from a variety of angles or the presence of any human face, so that a class of visual patterns on the retina, rather than a single fixed pattern, is to be identified.
In this regime, one distinguishes two kinds of coding error: misses and false alarms. In the former, one does not pick up on the target stimulus; in the latter, an absent target stimulus is erroneously perceived. While both kinds of error take place occasionally (think of mistaking a wavy tree branch for a snake, as a false alarm), the effortless feat of the visual system in avoiding them most of the time is rather bewildering. If we pause a moment on what this feat means at the neural level, as illustrated by the following example, we realize that it requires extremely precise coding.
Imagine stretching out on your hotel bed in a tropical country. If there were a very large spider on the ceiling, you most likely would want to detect it and detect it promptly. For the sake of concreteness, let us imagine that the spider has a size of three centimeters and is three meters away, subtending a visual angle of 0.01 radians. Thus, there are possible spider locations on the ceiling. If you are able to detect the spider in any of these locations, it implies that your brain must effectively have a ‘spider-detector’ circuit that reads out activity from a retinal population that subtends each of these spatial locations. If you would like to detect the spider quickly, say in 100 milliseconds, then there are possible spider-detection events per second. Now, if each detector operates at a false alarm rate that would naively seem low enough to be acceptable, say 0.001—i.e., a probability of error of a tenth of a percent— you would still perceive 100 virtual spiders per second!
One can think of a number of resolutions to this ‘spider-on-the-wall problem’ (changing hotel rooms will not do). Temporal integration, for one, may be used to suppress errors. Also, error rates ought to be influenced by the prior expectation of an event—a quantity we have not included explicitly in our argument. That said, both temporal integration and prior expectation involve trade-offs. Extensive temporal integration requires longer viewing times, and many behaviors need to occur quickly. Relying too heavily upon prior expectation could leave one unable to recognize novel objects.
A more direct way of ensuring reliable discrimination is to employ neural populations that are organized to suppress false alarm (and miss) rates down to extremely low values. In the companion paper we focus on this strategy. As an illustration of the stringency of the requirement, imagine that no more than one virtual spider ought to be perceived in the hour it takes you to fall asleep (as such spider detections could prevent sleep). This condition is satisfied if the false alarm rate remains below per detection circuit. And of course, the visual system can recognize many objects other than spiders, implying even lower false alarm rates in any one kind of detector so that the total false alarm rate remain very low.
2.2 Arguments for the detrimental effect of positive correlation on coding with a homogeneous neural population
It is often said that positive correlation is detrimental to coding. This claim is based on intuition developed for homogeneous populations [29, 22], as we explain in this section. Imagine turning on positive correlation in the population response to Target (Supplementary Fig. S3A). Distributions of population activity for increasing values of correlation are progressively wider, causing greater overlap and hence an enhanced coding error rate. This behavior is generic for positive values of the correlation (Supplementary Fig. S3B). (In extreme, non-generic cases with very large values of the correlation, the distribution corresponding to Target may become bimodal and concentrated around 0 and . The overlap between the two distributions can then decrease, and hence coding can improve. But such extreme cases are very different qualitatively from the experimental situation in which pairwise correlations are small to moderate, ranging from -0.1 to 0.5 [18, 19, 20, 57, 21]. In contrast to positive values of the correlation, negative values reduce the discrimination error but, again, such values are rarely observed experimentally.)
Simple arguments explain this behavior. Positive correlations enhance fluctuations in the population response, as compared to the independent case, and, as a result, suppress the signal-to-noise ratio. If denotes the response of neuron , the variance of the population activity is
| (87) |
where brackets indicate an average over trials. The first sum on the right-hand-side pertains to fluctuations in single-neuron responses and is non-vanishing in both independent and correlated cases. The second sum on the right-hand-side pertains to correlations among neurons. For negative correlations (anti-correlations), this sum is negative and, hence, the distribution of neural activity is more narrowly peaked than in the independent case. By contrast, positive correlations broaden the distribution. In the anti-correlated case, distributions of population activity corresponding to different stimuli tend to be well separated, while in the positively correlated case, overlaps tend to be greater. Therefore, homogeneous populations with positive correlation have worse coding performance than corresponding independent populations and, consequently, require more neurons to achieve a low rate of coding errors.
We can understand the hindrance of coding performance from positive correlations in an alternate, simple fashion. A homogeneous population with positive correlation behaves, effectively, as a smaller population. In the limiting case of a perfectly correlated population in which all neurons respond identically, the entire population behaves as one, big neuron. Hence, we expect such positively correlated populations to code information with less ‘resolution’ and, consequently, to commit coding errors more often than corresponding independent populations do.
2.3 High-fidelity coding bare bones
In the companion paper we demonstrate, quantitatively and with the use of simple models, that positive correlation can suppress coding errors and enhance coding capacity massively. The basic mechanism behind this effect was noted by a number of authors [24, 25, 27, 29, 38] and is simple to understand: positive correlations can deform the shape of probability distributions of neural activity in such a way as to sharpen the distinction between nearby probability distributions (Fig. 1B). Put differently, while positive correlations have a broadening effect overall, they can nonetheless suppress the tails of probability distributions along relevant directions, thereby reducing the unfavorable effect of neural variability.
The same idea can be expressed in a more general fashion: the structure of correlation can be such that it relegates noise into a non-informative mode of the neural population response. A simple example provides a nice illustration ([58]; a similar argument is presented in Ref. [27]). Consider two neurons with responses
| (88) | ||||
| (89) |
We assume that the mean responses, and , are different, such that () is large (small) in response to the Target stimulus, and vice versa for the Distracter stimulus. The additive variabilities, and , are highly correlated, such that . Then the informative mode,
| (90) |
is close to noiseless, while all the noise is relegated to the uninformative mode,
| (91) |
Our results can also be viewed in terms of a similar mechanism: informative and uninformative modes correspond to combinations of pool spike counts, the s, and given patterns of positive correlations relegate variability to the uninformative modes. In the simplest, symmetric, 2-pool model, correlation sharpens the response distributions along the informative mode, , while it blurs them along the uninformative mode, . Clearly, it is a signature of correlated coding that informative modes can be identified only when simultaneous activities of the neurons in the population are considered.
2.4 How extreme is lock-in?
In the limit of large enough populations or strong enough pairwise correlations, the distribution of activity of the population can ‘lock-in’ to a state of lower dimensionality. We have shown that a neural population can approach this state in cases in which the pairwise correlations have moderate values, but we still might wonder how ‘extreme’ is the lock-in state at the population level? For example, is the population ‘frozen’ at lock-in, with all variability suppressed? The positivity of probability implies constraints upon moments of the neural activity; in particular, we have . This bound is achieved by the lock-in condition, Eq. (6) in the companion paper. Thus, lock-in embodies the limiting case of maximum macroscopic correlation between Pools 1 and 2, but there remains a significant amount of (microscopic) variability even at lock-in. The specificity of lock-in is that it forbids a subset of the microscopic patterns, i.e., that these occur with vanishing probability. At lock-in, the system is not confined to one output pattern. A large set of patterns can occur with non-negligible probability each—hence the variability—and the remaining patterns are ruled out—hence the vanishing overlaps and error rates.
In the Gaussian approximation of the two-pool model, only patterns with a fixed ratio between and are allowed at lock-in. In the absence of correlations, allowed output patterns fill a two-dimensional space—the plane. When correlations push the system to lock-in, output patterns are confined to a one-dimensional space—the (. From this dimensionality reduction results error rate suppression and increased capacity. Of course, the population attains the actual lock-in state only for specific values of pairwise correlation and firing rate; however, we have shown that the error rate can reach near-vanishing values for a range of parameters that do not bring the population all the way to the lock-in condition. This result is generic as it relies only upon the rapid fall-off of the tails of the response probability distribution. It obtains in the case of the Gaussian approximation, and is bound to apply to the maximum entropy distribution as the latter’s tails are sharper than Gaussian tails.
2.5 Downstream read-out circuits and decoding
The issue of how information encoded by neural activity in one brain region can be read out by other brain regions is an important topic that pertains to almost all studies of the neural code. It is also a very difficult problem, as evidenced by the fact that we don’t have certain answers to these kinds of questions in any particular system (at least as far as the authors are aware). What one can do is to propose decoding algorithms that can read out relevant information. Such proposals do not imply that read-out brain regions actually use such algorithms; instead, they are merely existence proofs that information can be retrieved, and they represent bounds on the performance of read-out regions.
For instance, in our example of the two-pool model, the decision boundary that separates response patterns best interpreted as representing Target from those best interpreted as representing Distracter is a line in the space of neural responses: . Thus, a particularly simple linear decoder could read out the information encoded by the two correlated neural pools at a level of performance matching the maximum likelihood rule that we used in our mathematical analysis. In the case of multiple stimuli encoded by two pools, the decision boundaries generalize to . In addition, the readout circuit must combine together similar decoding rules for multiple decision surfaces. Note, however, that this is the same level of complexity as is needed to read out information in the case of an independent neural code.
In the more realistic case of a fully heterogeneous neural population (as analyzed in Fig. 4), a decoder that reads out information from the correlated neural population at optimal performance would need to have the form of a maximum entropy model [51], and the decision surface could be arbitrarily curved in the space of neural responses. Of course, one might be able to recover nearly optimal performance with simpler decoders if the heterogeneity is not too severe. This can only be ascertained by further study of decoding algorithms, and would certainly depend in detail on the magnitude and pattern of heterogeneity. We have not included any analysis of decoding mechanisms in this manuscript, because we feel that this is a substantial topic best left for subsequent studies.
The question of how the brain finds the right neurons form which to extract relevant information is also important, but unsolved. However, experiments on brain-machine interfaces demonstrate that the brain has a truly remarkable ability to change its circuitry in sensory-motor pathways to activate the relevant motor neurons. In an experiment, neurons in primary motor cortex were recorded and their responses were used to drive movements of cursors or even robotic arms with simple cosine tuning functions [59]. Under these circumstances, monkeys were able to achieve high performance in directing movements. Most impressively, the authors showed that they could re-arrange the tuning curves used to translate neural activity into movements of the robotic arm, and monkeys could change their entire sensory-motor pathway in order to fire those particular neurons in the right pattern to achieve the desired movement [60]. In many cases, the tuning curves were completely inverted, and yet the monkeys re-learned how to fire those neurons appropriately. Analogous results have been reproduced by another lab [61]. A related example comes from experiments in which human subject wear inverting prism glasses. Initially, the world appears upside-down, resulting in profound motor deficits and disorientation. But after about a week, subjects regain their coordination, evidently requiring a complete remapping (inversion) of visual stimuli to motor outputs [62].
So, while the brain faces great difficulties in obtaining useful information encoded by sensory circuits and must be subject to certain limits in accomplishing these, it is clear that the brain has a remarkable ability to surmount these difficulties in many situations. We currently have very little understanding of how the brain manages this, and hence we really don’t know at this point what the limitations are.
Another important issue concerns the manner in which multiple stimuli encoded by a correlated population are read-out by downstream brain circuits. Obviously, each stimulus or stimulus class that must be discriminated from all the others will require a dedicated read-out circuit with specific choices of synaptic weights for their inputs from the encoding population. Because the parameters of any single read-out circuit will need tuning in order to achieve high performance, we have an overall picture of this process in which not all possible stimulus discriminations are actually read out by subsequent brain regions.
To illustrate this picture, consider the case of human recognition of the letters of the alphabet. Depending on where a person is born, they learn different languages, which use different character sets comprising essentially arbitrary sets of spatial patterns (e.g., Chinese character set versus Latin or Cyrillic alphabets). At adult levels of performance, these characters can be discriminated rapidly and with extremely low error. As far as we can tell, any human child has the ability to learn any language. What this implies is that the early visual system must encode all possible characters of all human languages with high fidelity. However, higher centers in the visual pathway will only develop high-performance readout circuits to process the characters of languages that a given person actually knows. As the need for other spatial pattern discrimination arises, new circuits can be learned to read out that information from early visual areas. This picture is in overall agreement with the properties of higher visual centers in the ventral stream, where one observes highly specific feature selectivity, such as to individual faces, and where feature selectivity depends strongly on individual experience.
References
- 1. Barlow HB, Levick WR (1969) Three factors limiting the reliable detection of light by retinal ganglion cells of the cat. J Physiol 200: 1-24.
- 2. Hecht S, Shlaer S, Pirenne M (1942) Energy, quanta, and vision. J Gen Physiol 25: 819-840.
- 3. Klein SA, Levi DM (1985) Hyperacuity thresholds of 1 sec: theoretical predictions and empirical validation. J Opt Soc Am A 2: 1170-90.
- 4. Newsome WT, Britten KH, Movshon JA (1989) Neuronal correlates of a perceptual decision. Nature 341: 52-4.
- 5. Watson AB, Barlow HB, Robson JG (1983) What does the eye see best? Nature 302: 419-22.
- 6. Barlow HB, Levick WR, Yoon M (1971) Responses to single quanta of light in retinal ganglion cells of the cat. Vision Res Suppl 3: 87-101.
- 7. Parker A, Hawken M (1985) Capabilities of monkey cortical cells in spatial-resolution tasks. J Opt Soc Am A 2: 1101-14.
- 8. Kirchner H, Thorpe SJ (2006) Ultra-rapid object detection with saccadic eye movements: visual processing speed revisited. Vision Res 46: 1762-76.
- 9. Liu H, Agam Y, Madsen JR, Kreiman G (2009) Timing, timing, timing: fast decoding of object information from intracranial field potentials in human visual cortex. Neuron 62: 281-90.
- 10. Hatsopoulos NG, Ojakangas CL, Paninski L, Donoghue JP (1998) Information about movement direction obtained from synchronous activity of motor cortical neurons. Proc Natl Acad Sci U S A 95: 15706-11.
- 11. Mastronarde DN (1989) Correlated firing of retinal ganglion cells. Trends Neurosci 12: 75-80.
- 12. Ozden I, Lee HM, Sullivan MR, Wang SS (2008) Identification and clustering of event patterns from in vivo multiphoton optical recordings of neuronal ensembles. J Neurophysiol 100: 495-503.
- 13. Perkel DH, Gerstein GL, Moore GP (1967) Neuronal spike trains and stochastic point processes. ii. simultaneous spike trains. Biophys J 7: 419-40.
- 14. Sasaki K, Bower JM, Llinas R (1989) Multiple purkinje cell recording in rodent cerebellar cortex. Eur J Neurosci 1: 572-586.
- 15. Shlens J, Rieke F, Chichilnisky E (2008) Synchronized firing in the retina. Curr Opin Neurobiol 18: 396-402.
- 16. Usrey WM, Reid RC (1999) Synchronous activity in the visual system. Annu Rev Physiol 61: 435-56.
- 17. Vaadia E, Haalman I, Abeles M, Bergman H, Prut Y, et al. (1995) Dynamics of neuronal interactions in monkey cortex in relation to behavioural events. Nature 373: 515-8.
- 18. Bair W, Zohary E, Newsome WT (2001) Correlated firing in macaque visual area mt: time scales and relationship to behavior. J Neurosci 21: 1676-97.
- 19. Fiser J, Chiu C, Weliky M (2004) Small modulation of ongoing cortical dynamics by sensory input during natural vision. Nature 431: 573-8.
- 20. Kohn A, Smith MA (2005) Stimulus dependence of neuronal correlation in primary visual cortex of the macaque. J Neurosci 25: 3661-73.
- 21. Lee D, Port NL, Kruse W, Georgopoulos AP (1998) Variability and correlated noise in the discharge of neurons in motor and parietal areas of the primate cortex. J Neurosci 18: 1161-70.
- 22. Zohary E, Shadlen MN, Newsome WT (1994) Correlated neuronal discharge rate and its implications for psychophysical performance. Nature 370: 140-3.
- 23. Ecker AS, Berens P, Keliris GA, Bethge M, Logothetis NK, et al. (2010) Decorrelated neuronal firing in cortical microcircuits. Science 327: 584-587.
- 24. Johnson KO (1980) Sensory discrimination: decision process. J Neurophysiol 43: 1771-92.
- 25. Vogels R (1990) Population coding of stimulus orientation by striate cortical cells. Biological Cybernetics 64: 25-31.
- 26. Oram MW, Foldiak P, Perrett DI, Sengpiel F (1998) The ’ideal homunculus’: decoding neural population signals. Trends Neurosci 21: 259-65.
- 27. Abbott LF, Dayan P (1999) The effect of correlated variability on the accuracy of a population code. Neural Comput 11: 91-101.
- 28. Panzeri S, Treves A, Schultz S, Rolls ET (1999) On decoding the responses of a population of neurons from short time windows. Neural Comput 11: 1553-77.
- 29. Sompolinsky H, Yoon H, Kang K, Shamir M (2001) Population coding in neuronal systems with correlated noise. Phys Rev E Stat Nonlin Soft Matter Phys 64: 051904.
- 30. Wilke SD, Eurich CW (2002) Representational accuracy of stochastic neural populations. Neural Comput 14: 155-89.
- 31. Romo R, Hernandez A, Zainos A, Salinas E (2003) Correlated neuronal discharges that increase coding efficiency during perceptual discrimination. Neuron 38: 649-57.
- 32. Golledge HD, Panzeri S, Zheng F, Pola G, Scannell JW, et al. (2003) Correlations, feature-binding and population coding in primary visual cortex. Neuroreport 14: 1045-50.
- 33. Pola G, Thiele A, Hoffmann KP, Panzeri S (2003) An exact method to quantify the information transmitted by different mechanisms of correlational coding. Network 14: 35-60.
- 34. Averbeck BB, Lee D (2003) Neural noise and movement-related codes in the macaque supplementary motor area. J Neurosci 23: 7630-41.
- 35. Shamir M, Sompolinsky H (2004) Nonlinear population codes. Neural Comput 16: 1105-36.
- 36. Shamir M, Sompolinsky H (2006) Implications of neuronal diversity on population coding. Neural Comput 18: 1951-86.
- 37. Averbeck BB, Lee D (2006) Effects of noise correlations on information encoding and decoding. J Neurophysiol 95: 3633-44.
- 38. Averbeck BB, Latham PE, Pouget A (2006) Neural correlations, population coding and computation. Nat Rev Neurosci 7: 358-66.
- 39. Josic K, Shea-Brown E, Doiron B, de la Rocha J (2009) Stimulus-dependent correlations and population codes. Neural Comput 21: 2774-804.
- 40. Petersen RS, Panzeri S, Diamond ME (2001) Population coding of stimulus location in rat somatosensory cortex. Neuron 32: 503-514.
- 41. Osborne LC, Palmer SE, Lisberger SG, Bialek W (2008) The neural basis for combinatorial coding in a cortical population response. J Neurosci 28: 13522-31.
- 42. Maynard EM, Hatsopoulos NG, Ojakangas CL, Acuna BD, Sanes JN, et al. (1999) Neuronal interactions improve cortical population coding of movement direction. J Neurosci 19: 8083-93.
- 43. Cohen MR, Newsome WT (2008) Context-dependent changes in functional circuitry in visual area mt. Neuron 60: 162-173.
- 44. Poort J, Roelfsema PR (2009) Noise correlations have little influence on the coding of selective attention in area v1. Cereb Cortex 19: 543-53.
- 45. Gutnisky DA, Dragoi V (2008) Adaptive coding of visual information in neural populations. Nature 452: 220-4.
- 46. Gollisch T, Meister M (2008) Rapid neural coding in the retina with relative spike latencies. Science 319: 1108-1111.
- 47. Cover T, Thomas J (1991) Elements of information theory .
- 48. Brunel N, Nadal JP (1998) Mutual information, fisher information, and population coding. Neural Computation 10: 1731–1757.
- 49. Kang K, Sompolinsky H (2001) Mutual information of population codes and distance measures in probability space. Physical Review Letters 86: 4958.
- 50. Butts DA, Weng C, Jin J, Yeh CI, Lesica NA, et al. (2007) Temporal precision in the neural code and the timescales of natural vision. Nature 449: 92-5.
- 51. Schneidman E, Berry n M J, Segev R, Bialek W (2006) Weak pairwise correlations imply strongly correlated network states in a neural population. Nature 440: 1007-12.
- 52. Gawne TJ, Kjaer TW, Hertz JA, Richmond BJ (1996) Adjacent visual cortical complex cells share about 20 Cereb Cortex 6: 482-9.
- 53. Reich DS, Mechler F, Victor JD (2001) Independent and redundant information in nearby cortical neurons. Science 294: 2566-8.
- 54. Gawne TJ, Richmond BJ (1993) How independent are the messages carried by adjacent inferior temporal cortical neurons? J Neurosci 13: 2758-71.
- 55. Salinas E, Hernandez A, Zainos A, Romo R (2000) Periodicity and firing rate as candidate neural codes for the frequency of vibrotactile stimuli. J Neurosci 20: 5503-15.
- 56. Averbeck BB, Lee D (2004) Coding and transmission of information by neural ensembles. Trends Neurosci 27: 225-30.
- 57. Lang EJ, Sugihara I, Welsh JP, Llinas R (1999) Patterns of spontaneous purkinje cell complex spike activity in the awake rat. J Neurosci 19: 2728-39.
- 58. Nadal JP Private communication .
- 59. Velliste M, Perel S, Spalding MC, Whitford AS, Schwartz AB (2008) Cortical control of a prosthetic arm for self-feeding. Nature 453: 1098–1101.
- 60. Jarosiewicz B, Chase SM, Fraser GW, Velliste M, Kass RE, et al. (2008) Functional network reorganization during learning in a brain-computer interface paradigm. Proceedings of the National Academy of Sciences 105: 19486–19491.
- 61. Ganguly K, Carmena JM (2009) Emergence of a stable cortical map for neuroprosthetic control. PLoS biology 7: e1000153.
- 62. Richter H, Magnusson S, Imamura K, Fredrikson M, Okura M, et al. (2002) Long-term adaptation to prism-induced inversion of the retinal images. Experimental brain research 144: 445–457.