Burying a Binary: Dynamical Mass Loss and a Continuous Optically-Thick Outflow Explain the Candidate Stellar Merger V1309 Scorpii
Abstract
V1309 Sco was proposed to be a stellar merger and a common envelope transient based on the pre-outburst light curve of a contact eclipsing binary with a rapidly decaying orbital period. Using published data, I show that the period decay timescale of V1309 Sco decreased from to years in years, which implies a very high value of . I argue that V1309 Sco experienced an onset of dynamical mass loss through the outer Lagrange point, which eventually obscured the binary. The photosphere of the resulting continuous optically-thick outflow expands as the mass-loss rate increases, explaining the day rise to optical maximum. The model yields the mass-loss rate of the binary star as a function of time and fits the observed light curve remarkably well. It is also possible to observationally constrain the properties of the surface layers undergoing the dynamical mass loss. V1309 Sco is thus a prototype of a new class of stellar transients distinguished by a slow rise to optical maximum that are driven by dynamical mass loss from a binary. I discuss implications of these findings for stellar transients and other suggested common envelope events.
Subject headings:
binaries: eclipsing — binaries: general — Stars: individual (V1309 Sco) — Stars: mass-loss1. Introduction
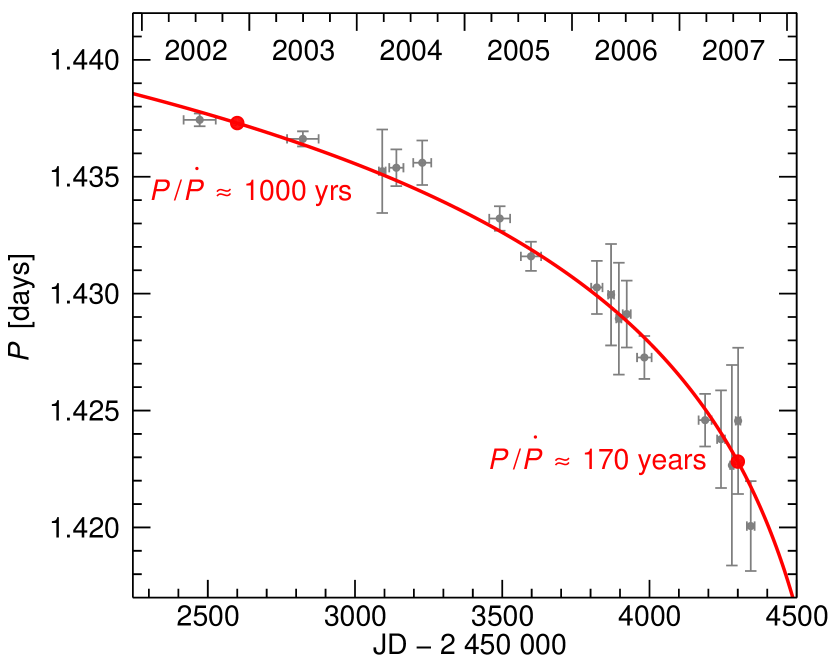
V1309 Scorpii developed an unusually red color during its 2008 outburst and joined the group of enigmatic objects such as V838 Mon, V4332 Sgr, and M31 RV (e.g. Martini et al., 1999; Munari et al., 2002; Mason et al., 2010). One possible explanation of these objects is that they are mergers of stars (e.g. Soker & Tylenda, 2003, 2006; Tylenda & Soker, 2006). V1309 Sco solidifies this view, because the pre-outburst photometry revealed a binary star system with a rapidly decaying orbital period (Tylenda et al. 2011; Fig. 1).
To make two stars in a binary merge, secular and dynamical instabilities must bring them close enough so that they orbit in a non-corotating common envelope, where the associated drag forces causes the final merger and envelope ejection (e.g. Paczyński, 1976; Livio & Soker, 1988; Iben & Livio, 1993; Taam & Sandquist, 2000; Ivanova et al., 2013b). V1309 Sco offers an excellent opportunity to robustly study the approach to merger through its orbital period decay and pre-outburst light curve.
In this paper, I focus on two important but neglected features of V1309 Sco: (1) the rapidly accelerating orbital period decay and (2) the slow day rise to optical maximum. In Section 2, I argue that the orbital period decay is due to dynamical mass loss. In Section 3, I illustrate how the the dynamical mass loss from the binary could yield to a slow brightness increase. In Section 4, I present a fit to the light curve and period evolution of V1309 Sco and interpret the fit parameters within the dynamical mass loss model. In Section 5, I discuss my findings and provide implications for other transients. In Section 6, I review the results.
2. Period change of V1309 Sco
Figure 1 shows the orbital period evolution of V1309 Sco prior to its outburst as measured by Tylenda et al. (2011). The period decrease, likely the fastest ever observed in a binary system, is accelerating with time. The decay timescale, , decreased from years to years in less than years. During the same time, the second derivative timescale decreased from about years to years, suggesting that the period decay accelerated and higher-order derivatives of the period were important as well. A change in by a factor of over a timescale that is at least order of magnitude shorter than is very surprising. Since the period decrease eventually ended in an outburst and potentially a merger, it is imperative to understand the mechanism of the period change.
Understanding the observed period change is not straightforward. For example, one of the possible explanations of the period decay in V1309 Sco is the Darwin instability (Stȩpień, 2011), possibly in combination with other effects such as the mass loss from L2 (Tylenda et al., 2011). In the theory of equilibrium tides, the Darwin instability proceeds on the tidal friction timescale . Before the outburst, V1309 Sco was a contact binary filling its Roche lobes, which gives
| (1) |
where is the intrinsic viscous timescale of the star, measures the quadrupolar deformability of the star111The coefficient is denoted as in Eggleton et al. (1998) and Eggleton & Kiseleva-Eggleton (2001), but it is a different quantity than the tidal quality factor also usually denoted as . and is the mass ratio with for this approximation (Eggleton, 1983; Eggleton & Kiseleva-Eggleton, 2001). Since is typically estimated to be between about a year and decades and for a fully convective star (Eggleton et al., 1998), is between about a hundred and thousands of years. The Darwin instability is driven by the subsynchronous rotation of one of the stars, , where is the ratio of stellar spin frequency to the orbital frequency. The period decay is thus much slower for nearly synchronous rotation. The structure of the orbital evolution equations of Eggleton & Kiseleva-Eggleton (2001) suggests that the second derivative of period change is and that for any tidal process222Orbital braking mechanisms due to a magnetized stellar wind also affect the orbit on a timescale longer than since the spin angular momentum loss of the star is transferred to the orbit by tidal forces. both and change on the tidal timescale . However, the observations of the period change show that changes from about to years and from about years to year, which is noticeably shorter than . These two observed timescales differ by about two orders of magnitude at any point of the evolution and both decrease substantially during the timespan of observations. Therefore, the period decrease of V1309 Sco cannot be understood within a theory that predicts period evolution to have similar and constant timescales and , such as the equilibrium tidal theory (Eggleton et al., 1998; Eggleton & Kiseleva-Eggleton, 2001). However, Eggleton (2012) asserted that the Darwin instability in V1309 Sco could act on a timescale as short as few years or even days. Furthermore, tidal dissipation efficiency can be significantly increased with non-linear effects such as resonances between the orbital motion and oscillations in the star, if they can be maintained long enough, for example by resonance locking.
The accelerating period decrease of V1309 Sco must be due to the onset of an instability that operates on a timescale much shorter than yet longer than the dynamical timescale (since it took V1309 Sco several hundred days to reach optical maximum). This is compatible with dynamically unstable mass loss, which occurrs when a star tends to adiabatically expand with respect to the Roche lobe radius as a response to a removal of surface layers (e.g. Paczyński & Sienkiewicz, 1972; Plavec et al., 1973; Webbink, 1977a, b; Hjellming & Webbink, 1987; Soberman et al., 1997). Tylenda et al. (2011) also suggested that dynamically unstable mass loss operates in V1309 Sco and I argue in favor of this possibility, because it allows to explain the unusually slow rise of luminosity of V1309 Sco.
3. Connecting period change and luminosity increase
After the binary variability disappeared, the luminosity of V1309 Sco slowly increased during days as is shown in Figure 2. This slow rise is longer than the dynamical time of the system, but comparable to the timescale on which the period of the binary orbit was changing just before the binary variability disappeared. In this Section, I describe how the period decay and slow luminosity increase can be connected using dynamical mass loss. The luminosity depends on the the mass loss rate from the system , which is in turn proportional to the period change,
| (2) |
where the mass outflow rate is assumed to be positive, is the total mass of the binary, and is the constant of proportionality that depends on the mechanism of period change and mass loss.
Without detailed knowledge of the structure of V1309 Sco before the outburst, which can be eventually obtained from detailed modelling of the light curve, it is unknown whether the mass leaves the binary through the outer Lagrange point (Kuiper, 1941; Lubow & Shu, 1975; Shu et al., 1979) or whether there is a combination of mass transfer and mass loss. I will discuss the case of mass loss through the outer Lagrange point, because it provides a self-contained relation between the period change and mass loss rate without additional parameters.
Mass loss through the outer Lagrange point will cause the orbital period to decrease. The exact form of relation between and (value of in Eq. [2]) depends on which star is actually losing the mass (Pribulla, 1998). I choose the case when the mass first flows from the primary to the envelope of the secondary and then is lost through the outer Lagrange point, which gives (Pribulla, 1998, Eq. (16))
| (3) |
where is a non-dimensional slowly varying function of the mass ratio, . The other cases discussed in Pribulla (1998) differ by a factor of in . The order-of-magnitude estimate presented in this paper works for any since is degenerate with other quantities such as opacity or velocity of the outflow. Given the estimate that and from Stȩpień (2011), the period change of V1309 Sco implies yr-1 at .
For mass loss described by Equation (2), the orbital energy decays as
| (4) |
where I assumed that . Parameters appropriate for V1309 Sco were used. The binary orbit loses energy, because for small , and and are both negative.
The kinematics of the matter leaving the outer Lagrange point was studied by Shu et al. (1979). For , the particles leaving L2 will fly to infinity in a “garden sprinkler” spiral pattern both in the co-rotating and inertial reference frames. Although the outflow starts as a stream originating at L2, it should surround the binary and become more isotropic as the binary rotates and the spiral arms spread both in the horizontal and vertical directions (Shu et al., 1979). I therefore assume that the outflow can be treated as spherically symmetric with radial density profile
| (5) |
where is the characteristic velocity of the outflow, which I assume to be equal the escape velocity of the binary, .
Despite the rapid and accelerating period change, the system still evolves on a much longer timescale than the dynamical timescale () and it is thus possible to assume quasistatic evolution. The power necessary to launch the outflow
| (6) | |||||
comes from the orbital decay. The energy decay of the binary orbit (Eq. [4]) is sufficient to provide kinetic energy of the outflow with this high mass-loss rate.
I also assume that the outflow is isothermal with the color temperature of the binary, which should roughly hold until the material gets far from the binary (Shu et al., 1979). As the dynamical mass loss runs away, increases and the outflow eventually forms a photosphere with a radius
| (7) | |||||
where cm2 g-1 is the characteristic opacity of the isothermal outflow. Although I assume that the outflow is nearly isothermal, a proper calculation of the outflow thermodynamic structure is necessary to precisely connect the mass loss rate with the position of the photosphere, because for the temperature range relevant for V1309 Sco, grows steeply with temperature due to H- opacity (Alexander & Ferguson, 1994; Ferguson et al., 2005) and the photosphere might be positioned at the largest gradient of opacity.
The binary optical radiation will be replaced by that from the photosphere of the outflow with luminosity
| (8) |
where the photospheric temperature should not be substantially different from the temperature of the binary . The luminosity of the optically-thick outflow is thus dictated by the physics of the mass loss from the binary (Eq. [7]). The outflow should be radiatively inefficient in the sense that
| (9) |
but no conversion of to is necessary below the photosphere. Equivalently, the outflow thermal energy is much smaller than its kinetic energy.
4. Mass loss rate evolution of V1309 Sco
In this Section, I present a fit to the light curve and period evolution of V1309 Sco. The phenomenological prescriptions in the model are based on the prediction of Section 3 that and previous works on dynamical mass loss. The values of the fit parameters are reasonable when interpreted within the scenario presented in Section 3, which suggests that the presented model is consistent with the observations.
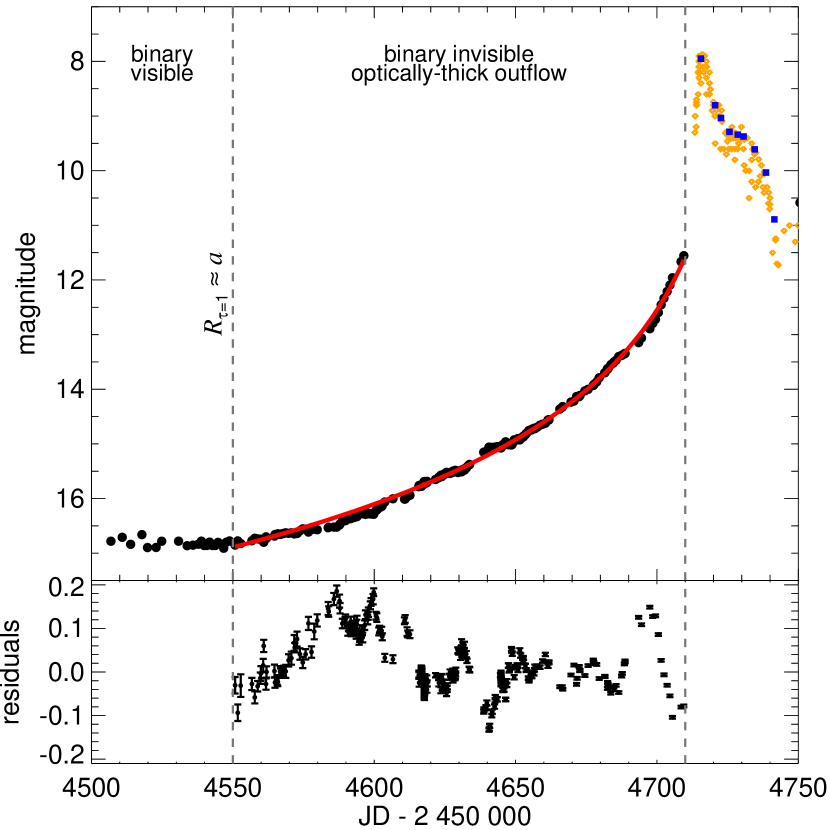
Figure 2 shows the slow rise to optical maximum of V1309 Sco (), which I explain as the expanding photosphere of an optically-thick outflow powered by the dynamical mass loss. The orbital variations disappeared between and , which constrains to be between and cm2 g-1 (, Eq. [7]). This is a reasonable result for a relatively low temperature material (Alexander & Ferguson, 1994; Ferguson et al., 2005). I assume that at , which gives cm2 g-1. The photospheric temperature was not measured during the optically-thick outflow phase, but the low opacity suggests photospheric temperatures K. Before the binary became obscured, Tylenda et al. (2011) found K, while at the optical maximum the temperature was between about and K (Mason et al., 2010; Tylenda et al., 2011). At optical maximum, the FWHM of the Balmer lines was km s-1 (Mason et al., 2010), consistent with the km s-1 assumed here.
By combining the directly observed orbital period change and the slow brightening due to the optically-thick outflow, it is possible to constrain the total mass loss evolution of the primary star in V1309 Sco. I first focus on the slow brightening. To predict the change in luminosity as a function of time, the model of Section 3 requires the time evolution of the mass loss rate. Following Paczyński & Sienkiewicz (1972) and Webbink (1977b), I assume that the mass loss rate runs away as a power law
| (10) |
with a singularity at . Combining Equations (7) and (10), the observed magnitude is
| (11) |
where hides all remaining parameters (including , distance modulus and extinction), which I assume to be constant with . The optically-thick outflow phase shown in Figure 2 gives and and the model matches the slow brightening remarkably well with only three parameters , , and . The fit is valid only until , because at that point the brightening of V1309 Sco significantly accelerated and proceeded on approximately the dynamical timescale of the system. It is thus not surprising that the fit gives about days later than the start of the dynamic brightening.
The parameter has a clear physical meaning directly related to the properties of the surface layer of the star experiencing mass loss. Specifically, , where is the polytropic index (Jedrzejec, 1969; Paczyński & Sienkiewicz, 1972; Webbink, 1977b), which gives and for a fully convective and radiative star, respectively. The value obtained from fitting V1309 Sco implies very high values of and nearly isothermal surface layer during the dynamical mass loss. The model presented here can in principle observationally constrain the behavior of stars in a response to large amounts of mass loss, which has been calculated only theoretically (Woods & Ivanova, 2011; Passy et al., 2012). However, a more detailed model of the outflow structure is necessary to provide a robust value of , because the estimate of can be biased if quantities such as and the outflow velocity smoothly evolve in time.
The fit of the slow brightness rise of V1309 Sco determines well and , but cannot constrain the absolute scale of the mass loss rate, because enters only through the additive constant , which depends also on uncertain values of distance, extinction, , , and others. Fortunately, the constraints from the directly observed are complementary to the slow brightness rise. The observed cannot uniquely determine , , and , because the binary becomes obscured too far from the singularity at . But with and constrained by the slow brightness rise, sets the absolute scale of the mass loss rate (assuming is known). The explicit period evolution can be obtained by integrating Equations (2) and (10), which gives
| (12) |
where is the integration constant and the Equation is valid for . Applying this to the directly observed period evolution with and fixed to the results from the light curve fit gives values of and . In particular, the uncertainty in due to the scatter in is if there is no uncertainty in . It is worth noting that although and are fixed during period fitting, their values cannot be chosen arbitrarily to match the period change. For example, with the curvature of can be matched only with about days after the optical maximum. This provides an additional consistency check on the model.
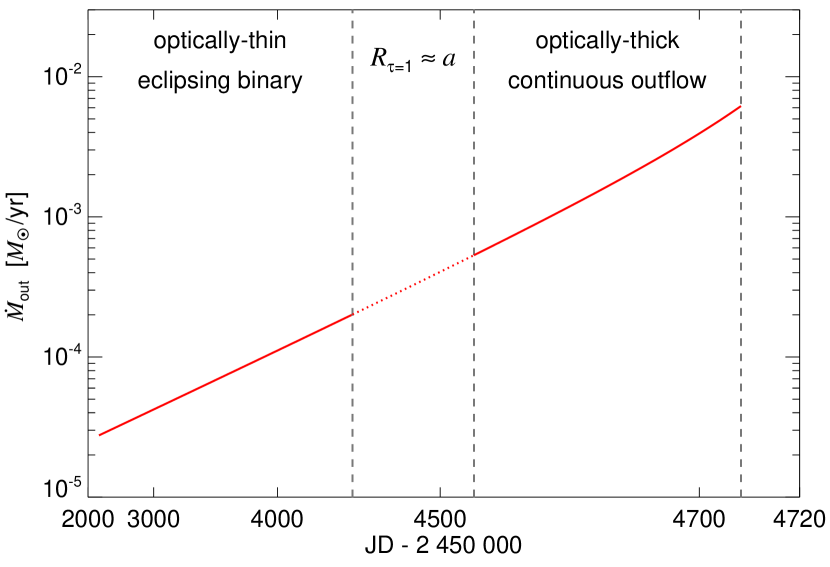
Figure 3 shows the reconstructed evolution of assuming , which gives . The quasistatic evolution lasted days during which increased by more than two orders of magnitude. At , the binary orbital period is estimated to be days, which translates to of the separation at the beginning of observations. The total mass lost from the binary is with a kinetic energy of ergs. The total energy radiated during the optically-thick outflow phase is much smaller, ergs. The wind is radiatively inefficient, , with peak efficiency of at assuming K. Since is a relatively steep at small , the values of are somewhat sensitive to the assumed mass ratio of the binary. For example, changing to or gives of about or , respectively.
The bottom panel of Figure 2 shows the residuals with respect to the fit during the slow rise to the maximum. The residuals are not randomly distributed around zero, but are correlated on a timescale of a few to tens of days with amplitude greater than the photometric uncertainty. The most likely explanation is that these variations are caused by the non-isotropic distribution of matter in the outflow, a possible sign of the “garden-sprinkler” spiral created by the mass loss from the outer Lagrange point (Shu et al., 1979). If the outflowing material keeps its tangential velocity, the characteristic duration of these correlated changes should increase with time as the increasing moves the photosphere to larger radii. The separation of the first two prominent peaks at and is about days, while the last and second-to-last peaks are separated by about days, however, the variations in between are more stochastic and it is hard to deduce any timescale. The timescale of variations relative to implies photospheric radii similar to what is required to explain the observed slow brightening.
V1309 Sco likely did not become optically thick from all angles simultaneously. Tylenda et al. (2011) showed how the shape of the eclipsing binary light curve evolved as a function of time: the magnitude difference between the maximum at phase and minima at phases and decreases to essentially zero with increasing time, while the maximum at phase appears to be relatively unchanged. At phases and , we see both stars from the side with observed surface area maximized. The light curve of V1309 Sco can be explained by a gradually growing “dark spot” on one of the stars that has maximum visible surface area around phase , and has little effect on the flux at other phases. Putting a “bright spot” on the stars fully visible at either phase or would lead to an increase of the total amplitude of variability, because the binary would get brighter at these phases relative to phases and , which is not observed. If the mass loss occurs as a gradually spreading stream originating from L2, the density and hence optical depth of the material will be higher on one side of the binary than the other and could explain the evolution of the binary light curve. The material would have to be colder than the stars to cause obscuration (and possibly the drop in luminosity when the binary variability disappeared), while later causing the brightening due to large surface area. Detailed modelling of the pre-outburst light curve of V1309 Sco could thus constrain the spatial structure of the mass loss.
5. Discussions
The model presented in Section 3 connects together the directly observed period changes and the subsequent slow brightness rise through intense mass loss. However, the quasistatic evolution of the outflow photosphere is followed by a rapid brightening that started on and lasted days, which is only a few orbits. The short timescale implies that a different physical effect quenches the quasistatic evolution of the optically-thick outflow.
The rapid brightening can be achieved by significantly increasing the radiation efficiency in the wind for example due to a passing shock wave; converting of wind power at to radiation is enough to explain the peak luminosity derived by Tylenda et al. (2011). However, it is not clear what would be the origin of such a shock. Instead, the rapid brightening might be a sign of the merger of the underlying binary. Ivanova et al. (2013a) and Nandez et al. (2013) performed simulations of a binary merger with parameters appropriate for V1309 Sco and found that the merger ejects a shell of several on the dynamical timescale and the rapid brightening is powered by the associated recombination energy. Their results well match the properties of V1309 Sco around the maximum brightness, after .
5.1. Implications for similar transients
Could the model presented here be used to predict when the rapid brightening occurs? Such a prediction would be extremely interesting from an observational point of view, but is difficult based on order-of-magnitude estimates alone. For example, the decrease of the semi-major axis between and inferred from period changes and optically-thick outflow is less than , so any condition based on would require signficant fine tuning.
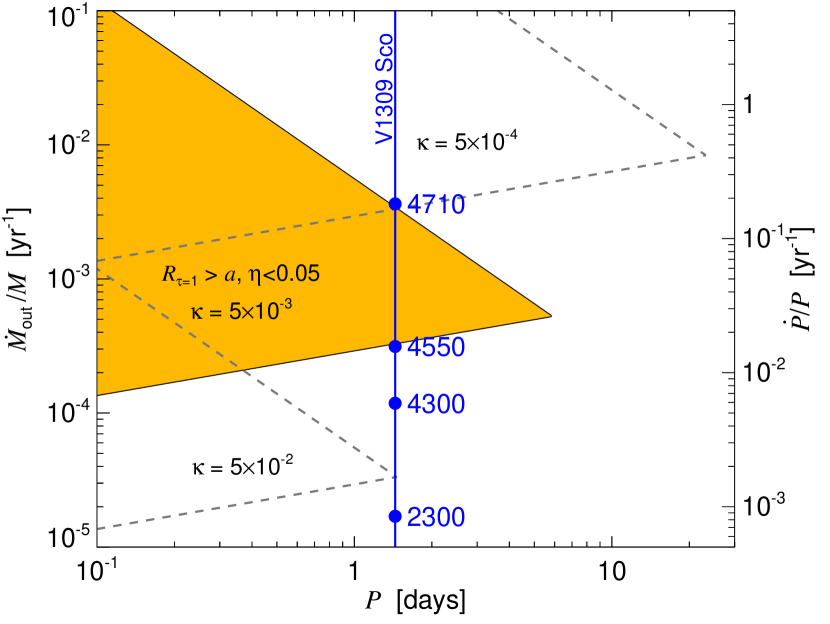
Instead, it is interesting to ask what is the range of validity of the model presented here and how would the optically-thick outflow look like in binaries with different properties, especially the orbital period. First, in order to get an optically-thick outflow, the mass loss rate must be sufficiently high to produce a photosphere at . Apart from the opacity of the material, this condition depends on the characteristic velocity of the outflow , which scales with the binary period (Eq. [7]). As a result, the critical , which gives , scales as for constant opacity.
Second, it is also reasonable to assume that the optically-thick outflow does not radiate any substantial part of its kinetic energy. In the formalism of Equation (9), . I choose a rather arbitrary maximum value of , which corresponds to the inferred properties of the outflow of V1309 Sco at . Lines of constant imply scaling for constant opacity.
These constraints are summarized in Figure 4 in the parameter space of the relative outflow rate and orbital period . The yellow wedge shows the combined constraint and for opacity appropriate for V1309 Sco and similar constraints for higher and lower opacities are shown with grey dashed lines. These wedges indicate that the behavior similar to V1309 Sco (slow luminosity increase due to an optically-thick outflow) can be expected only in binaries with days, which produce relatively cool and thus not very opaque outflows. Although high opacities require only small , the outflow luminosity would be very much higher than its kinetic energy. Similarly, long-period binaries would require very low and thus very high .
What would be the observable appearance of binaries that are losing mass with high but increasing the binary brightness would require unreasonably high ? The outflow in such binaries would neccessarily produce high optical depths , but the outflow could only reprocess the binary luminosity to lower temperatures, , keeping the total luminosity essentially fixed. Low temperatures in such outflows would be very conducive for dust formation and such binaries would appear as very cool and dusty stars. If the mass loss was due to dynamical non-conservative mass transfer that lasted only a short amount of time, the result would be an expanding cold dusty shell. In either case, such obscured objects could potentially be identified by infrared observations.
A recent event OGLE-2002-BLG-360 (Tylenda et al., 2013) showed brightening on a timescale about times longer than V1309 Sco. The lack of any significant short-period pre-outburst variation is in line with an optically-thick outflow during dynamical mass loss and a reasonable fit to the rising part of the light curve is possible with Equations (7–10). Unlike V1309 Sco, OGLE-2002-BLG-360 did not show a rapid brightening on a dynamical timescale. Perhaps in this case, the dynamical mass loss was due to nonconservative mass transfer, which did not end with a merger of the two stars. The slow rise to maximum distinguishes V1309 Sco, OGLE-2002-BLG-360, and potentially also V4332 Sgr (Kimeswenger, 2006; Martini et al., 1999) from other “red novae” such as V838 Mon and M31 RV, which seem to show only rapid brightening from a quiescent magnitude (e.g. Sharov, 1993; Munari et al., 2002; Sobotka et al., 2002). It is also worth noting that these objects differ from M85 OT2006-1, SN 2008S, and NGC300 OT2008-1 in their spectral evolution, luminosity, and progenitors (Kulkarni et al., 2007; Prieto et al., 2008; Berger et al., 2009; Bond et al., 2009; Smith et al., 2009; Thompson et al., 2009). The non-detection of a slow rise to maximum might simply be due to a lack of pre-outburst measurements: there would be no indication of a slow rise in V1309 Sco without the extensive OGLE data. It is worth mentioning that the tentative category of “red novae” is heterogenous in many other aspects as well. Transients due to dynamical mass loss might also be confused with other sources of variability such as microlensing, which was the case of OGLE-2002-BLG-360 (Tylenda et al., 2013).
6. Conclusions
I focused on two previously overlooked features of the outburst of V1309 Sco: (1) the rapidly accelerating pre-outburst period decay (Fig. 1) and (2) the slow rise to optical maximum (Fig. 2). I showed how these two observed features can be unified through a model of a continuous optically-thick outflow generated by dynamical but long-lasting mass loss. I obtain remarkably good fits of the light curve and period evolution (Figs. 1 and 2) and interpret the fitted parameters within the optically-thick outflow model. In particular, I constrain the mass loss rate of the binary (Fig. 3). The model assumes that most of the orbital decay energy goes into the kinetic energy of the outflow.
This new class of transients distinguished by a slow rise to optical maximum that are driven by dynamical mass loss deserves much more detailed and realistic calculation. It is especially important to properly calculate the thermodynamic structure of the wind, including realistic opacities and dust formation, which occurred in OGLE-2002-BLG-360 (Tylenda et al., 2013) and after optical maximum in V1309 Sco (Nicholls et al., 2013). The optically-thick outflow is also likely asymmetric, which is possibly observed in the residuals of the fit (Fig. 2). Proceeding forward with greater realism will be rewarding, because the optically-thick outflow encodes the mass-loss evolution of the underlying binary and is potentially important for other similar types of systems involving massive stars (e.g. Belczynski et al., 2008; Eldridge et al., 2008; de Mink et al., 2013), white dwarfs (e.g. Webbink, 1984; Verbunt & Rappaport, 1988; Benz et al., 1990; Dan et al., 2011), and neutron stars (e.g. Rasio & Shapiro, 1994; Rosswog, 2005; D’Souza et al., 2006).
References
- Alexander & Ferguson (1994) Alexander, D. R., & Ferguson, J. W. 1994, ApJ, 437, 879
- Belczynski et al. (2008) Belczynski, K., Kalogera, V., Rasio, F. A., et al. 2008, ApJS, 174, 223
- Benz et al. (1990) Benz, W., Cameron, A. G. W., Press, W. H., & Bowers, R. L. 1990, ApJ, 348, 647
- Berger et al. (2009) Berger, E., Soderberg, A. M., Chevalier, R. A., et al. 2009, ApJ, 699, 1850
- Bond et al. (2009) Bond, H. E., Bedin, L. R., Bonanos, A. Z., et al. 2009, ApJ, 695, L154
- Dan et al. (2011) Dan, M., Rosswog, S., Guillochon, J., & Ramirez-Ruiz, E. 2011, ApJ, 737, 89
- de Mink et al. (2013) de Mink, S. E., Langer, N., Izzard, R. G., Sana, H., & de Koter, A. 2013, ApJ, 764, 166
- D’Souza et al. (2006) D’Souza, M. C. R., Motl, P. M., Tohline, J. E., & Frank, J. 2006, ApJ, 643, 381
- Eggleton (1983) Eggleton, P. P. 1983, ApJ, 268, 368
- Eggleton et al. (1998) Eggleton, P. P., Kiseleva, L. G., & Hut, P. 1998, ApJ, 499, 853
- Eggleton & Kiseleva-Eggleton (2001) Eggleton, P. P., & Kiseleva-Eggleton, L. 2001, ApJ, 562, 1012
- Eggleton (2012) Eggleton, P. P. 2012, Journal of Astronomy and Space Sciences, 29, 145
- Eldridge et al. (2008) Eldridge, J. J., Izzard, R. G., & Tout, C. A. 2008, MNRAS, 384, 1109
- Ferguson et al. (2005) Ferguson, J. W., Alexander, D. R., Allard, F., et al. 2005, ApJ, 623, 585
- Hjellming & Webbink (1987) Hjellming, M. S., & Webbink, R. F. 1987, ApJ, 318, 794
- Iben & Livio (1993) Iben, I., Jr., & Livio, M. 1993, PASP, 105, 1373
- Ivanova et al. (2013a) Ivanova, N., Justham, S., Avendano Nandez, J. L., & Lombardi, J. C. 2013a, Science, 339, 433
- Ivanova et al. (2013b) Ivanova, N., Justham, S., Chen, X., et al. 2013b, A&A Rev., 21, 59
- Jedrzejec (1969) Jedrzejec, E. 1969, M.S. thesis, Warsaw University
- Kimeswenger (2006) Kimeswenger, S. 2006, Astronomische Nachrichten, 327, 44
- Kuiper (1941) Kuiper, G. P. 1941, ApJ, 93, 133
- Kulkarni et al. (2007) Kulkarni, S. R., Ofek, E. O., Rau, A., et al. 2007, Nature, 447, 458
- Livio & Soker (1988) Livio, M., & Soker, N. 1988, ApJ, 329, 764
- Lubow & Shu (1975) Lubow, S. H., & Shu, F. H. 1975, ApJ, 198, 383
- Martini et al. (1999) Martini, P., Wagner, R. M., Tomaney, A., et al. 1999, AJ, 118, 1034
- Mason et al. (2010) Mason, E., Diaz, M., Williams, R. E., Preston, G., & Bensby, T. 2010, A&A, 516, A108
- Munari et al. (2002) Munari, U., Henden, A., Kiyota, S., et al. 2002, A&A, 389, L51
- Nandez et al. (2013) Nandez, J. L. A., Ivanova, N., & Lombardi, J., Jr 2013, arXiv:1311.6522
- Nicholls et al. (2013) Nicholls, C. P., Melis, C., Soszyński, I., et al. 2013, MNRAS, 431, L33
- Paczyński & Sienkiewicz (1972) Paczyński, B., & Sienkiewicz, R. 1972, Acta Astron., 22, 73
- Paczyński (1976) Paczyński, B. 1976, Structure and Evolution of Close Binary Systems, 73, 75
- Passy et al. (2012) Passy, J.-C., Herwig, F., & Paxton, B. 2012, ApJ, 760, 90
- Plavec et al. (1973) Plavec, M., Ulrich, R. K., & Polidan, R. S. 1973, PASP, 85, 769
- Pojmanski (1997) Pojmanski, G. 1997, Acta Astron., 47, 467
- Pribulla (1998) Pribulla, T. 1998, Contributions of the Astronomical Observatory Skalnate Pleso, 28, 101
- Prieto et al. (2008) Prieto, J. L., Kistler, M. D., Thompson, T. A., et al. 2008, ApJ, 681, L9
- Rasio & Shapiro (1994) Rasio, F. A., & Shapiro, S. L. 1994, ApJ, 432, 242
- Rosswog (2005) Rosswog, S. 2005, ApJ, 634, 1202
- Sharov (1993) Sharov, A. 1993, Astronomy Letters, 19, 83
- Shu et al. (1979) Shu, F. H., Anderson, L., & Lubow, S. H. 1979, ApJ, 229, 223
- Smith et al. (2009) Smith, N., Ganeshalingam, M., Chornock, R., et al. 2009, ApJ, 697, L49
- Soberman et al. (1997) Soberman, G. E., Phinney, E. S., & van den Heuvel, E. P. J. 1997, A&A, 327, 620
- Sobotka et al. (2002) Sobotka, P., Šmelcer, L., Pejcha, O., et al. 2002, Information Bulletin on Variable Stars, 5336, 1
- Soker & Tylenda (2003) Soker, N., & Tylenda, R. 2003, ApJ, 582, L105
- Soker & Tylenda (2006) Soker, N., & Tylenda, R. 2006, MNRAS, 373, 733
- Stȩpień (2011) Stȩpień, K. 2011, A&A, 531, A18
- Taam & Sandquist (2000) Taam, R. E., & Sandquist, E. L. 2000, ARA&A, 38, 113
- Thompson et al. (2009) Thompson, T. A., Prieto, J. L., Stanek, K. Z., et al. 2009, ApJ, 705, 1364
- Tylenda & Soker (2006) Tylenda, R., & Soker, N. 2006, A&A, 451, 223
- Tylenda et al. (2011) Tylenda, R., Hajduk, M., Kamiński, T., et al. 2011, A&A, 528, A114
- Tylenda et al. (2013) Tylenda, R., Kaminski, T., Udalski, A., et al. 2013, arXiv:1304.1694
- Verbunt & Rappaport (1988) Verbunt, F., & Rappaport, S. 1988, ApJ, 332, 193
- Webbink (1977a) Webbink, R. F. 1977a, ApJ, 211, 486
- Webbink (1977b) Webbink, R. F. 1977b, ApJ, 211, 881
- Webbink (1984) Webbink, R. F. 1984, ApJ, 277, 355
- Woods & Ivanova (2011) Woods, T. E., & Ivanova, N. 2011, ApJ, 739, L48