Interstellar gas towards CTB 37A and the TeV gamma-ray source HESS J1714385
Abstract
Observations of dense molecular gas towards the supernova remnants CTB 37A (G348.50.1) and G348.50.0 were carried out using the Mopra and Nanten2 radio telescopes. We present CO(2-1) and CS(1-0) emission maps of a region encompassing the CTB 37A TeV gamma-ray emission, HESS J1714385, revealing regions of dense gas within associated molecular clouds. Some gas displays good overlap with gamma-ray emission, consistent with hadronic gamma-ray emission scenarios. Masses of gas towards the HESS J1714385 TeV gamma-ray emission region were estimated, and were of the order of 103-104 M⊙. In the case of a purely hadronic origin for the gamma ray emission, the cosmic ray flux enhancement is 80-1100 times the local solar value. This enhancement factor and other considerations allow a discussion of the age of CTB 37A, which is consistent with 104 yr.
keywords:
molecular data - supernovae: individual: CTB 37A - ISM: clouds - cosmic rays - gamma rays: ISM.1 Introduction
Gamma ray observations may be the key to solving one the of longest unsolved mysteries in astrophysics, the origin of cosmic rays (hereafter CRs). Since gamma-rays are byproducts of cosmic ray interactions, high gamma-ray fluxes are expected from regions with enhanced cosmic ray densities, such as near cosmic ray acceleration sites. The leading theory to explain the acceleration of these particles is first order Fermi acceleration in the shocks of supernova remnants (hereafter SNRs).
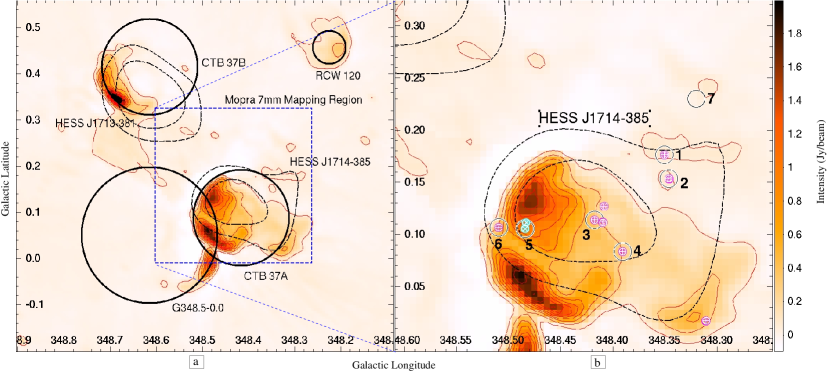
A candidate region for CR-acceleration is CTB 37, which is comprised of three SNRs: CTB 37A (G348.50.1), CTB 37B (G348.70.3) and G348.50.0. CTB 37A was initially discovered at radio wavelengths (Clark et al., 1975) and was recently observed to emit at TeV energies (HESS J1714385, Aharonian et al., 2008a). GeV-energy excesses have also been detected (3EG J17143857, Green et al., 1999; Hartman et al., 1999, 1FGL J1714.53830, Castro & Slane, 2010).
The CTB 37A radio continuum emission (see Figure 1a) is suggestive of a ‘break-out’ morphology. Strong shell-shaped emission emanates from the eastern (galactic coordinate system) section and a weaker lobe or ‘break-away’ region extends in a western direction. Reynoso & Mangum (2000) observed CO(1-0) emission towards CTB 37A and investigated the possibility that the observed features are caused by constraining molecular gas along the north, east and south boundaries. They found associated v 65 km s-1 molecular clouds around the northern and eastern edges of the CTB 37A radio continuum emission, while minimal gas was seen in the location of the ‘break-out’ features to the west. In the south however, inconsistent with predictions, no gas (as traced by CO(1-0)) was seen to be constraining the remnant.
Knowledge of gas distribution is also important when considering a hadronic (pion production via CR collisions with gas) origin for the CTB 37A gamma-ray emission, although the nature of the parent particle population (leptonic and/or hadronic) is not entirely clear. Non-thermal X-ray emission is absent from the CTB 37A radio rim (Frail et al., 1996), which, in the presence of strong magnetic fields would imply a lack of ongoing high energy electron acceleration. Indeed, Brogan et al. (2000) measured strong magnetic fields (0.22-1.5 mG) towards shocked regions of CTB 37A, and in such environments TeV leptons have limited lifetimes due to synchrotron losses (synchrotron lifetimes of 250 yr, very short compared to the SNR age, see § 5.3). If the high energy lepton population is dimished towards the CTB 37A radio rim, which it appears to be, a hadronic scenario for gamma-ray emission production would be favourable (Aharonian et al., 2008a).
Alternatively, a leptonic scenario for CTB 37A is supported by the presence of a coincident region of non-thermal X-ray emission (Aharonian et al., 2008a). This could possibly indicate a pulsar wind nebulae (PWN) accelerating electrons within a blast wave (making CTB 37A a composite SNR), but this hypothesis is complicated by the non-detection of a point-like source or pulsar within the extended non-thermal emission (Aharonian et al., 2008a). Certainly, the non-thermal and thermal emission from the outer rim and centre of CTB 37A, respectively, indicate that CTB 37A is a mixed-morphology SNR. Results by Brandt et al. (2011) are suggestive of a significant Bremsstrahlung emission component between 1 and 100 GeV, with a hadronic component dominating at TeV energies and above, but the question of the nature of the emitting particle population is still largely an open question.
Also present towards the CTB 37A region (Aharonian et al., 2008a), are 1720 MHz OH masers, which are indicators of shock-gas interactions, likely triggered by SNR shocks (Aharonian et al., 2008a; Frail et al., 1996). However, the interpretation of this data is confused by the existence of a coincident partial shell SNR, G348.50.0 (Milne et al., 1979; Kassim et al., 1991), which can be seen in 843 MHz radio continuum emission in Figure 1a. Two masers comprise a population at line-of-sight-velocity, v 22 km s-1 while eight comprise a second population at v 65 km s-1. Although it has been suggested that the 2 maser populations may be attributable to each of the 2 SNRs separately, recent work by Tian & Leahy (2012) (hereafter TL2012) demonstrates that CTB 37A may simply be associated with multiple varied-velocity clouds. This suggests that both populations of masers may be attributable to CTB 37A (and neither would be associated with G348.50.0).
Reynoso & Mangum (2000) found molecular CO(1-0) cloud associations towards most of the masers, but two v 65 km s-1 OH masers (Locations 1 and 2, see Figure 1b) did not have clear CO emission counterparts at corresponding velocities and locations. The formation of 1720 MHz OH masers requires large gas densities of 104-105 cm-3 (Draine et al., 1983; Frail et al., 1998), but CO(1-0) emission has a critical density of 103 cm-3 and quickly becomes optically thick. As Reynoso & Mangum (2000) suggest, to probe deeper, observations of dense gas tracers are required.
In addition to being conducive to OH maser generation, dense gas may significantly affect the dynamics of the SNR shock motion, while also providing denser targets for gamma-ray-producing hadronic cosmic ray interactions. Knowing the location of dense gas may lead to both an explanation for the ‘break-out’ morphology of the radio continuum emission and more detailed modeling of the CTB 37A TeV emission. Previous studies have noted that dense gas may hinder CR diffusion and change the resultant high energy photon spectrum from hadronic interactions (Gabici et al., 2009; Casanova, 2011; Fukui et al., 2012; Maxted et al., 2012).
To complement existing Nanten2 CO(2-1) and Southern Galactic Plane Survey (SGPS) HI data (McClure-Griffiths et al., 2005; Haverkorn et al., 2006; Tian & Leahy, 2012) we took 7 mm observations of the CTB 37A region with the Mopra radio telescope. We targeted the gas tracer CS(1-0) (critical density 8104 cm-3) to investigate dense gas and simultaneously searched for the potential shock-tracers SiO(1-0) and CH3OH (motivated by results towards the SNR W28, Nicholas et al., 2012) to search for shocked gas related to SNR activity.
To investigate the gas distribution towards CTB 37A, we applied gas parameter calculation methods presented in §3 to several clouds of gas, which we consider separately in subsections of §4. In §5.1 we compare column densities estimated by us to estimates by previous authors. In §5.2 we use our gas mass estimates to estimate the cosmic ray density in several scenarios of gamma-ray emission from hadronic processes for CTB 37A. Finally, in §5.3, we discuss the age of CTB 37A.
1.1 Distance
By noting that towards CTB 37A, HI absorption occurs in gas at v 110 km s-1, but not from gas that lies at v 65 km s-1, Caswell et al. (1975) concluded that the v 110 km s-1 gas was nearer to us than CTB 37A. Assuming that the line-of-sight-velocities were primarily due to galactic kinematic motions, the authors recognised that the v 65 km s-1 gas must be on the ‘far-side’ (past the tangent point) of the galaxy in order to be spatially behind the v 110 km s-1 gas. The distance of the CTB 37A radio emission was thus constrained to be between 6.7 and 13.7 kpc (assuming l349∘) (this kinematic distance constraint relied on a value of 10 kpc for the orbital radius of the sun with respect to the galactic centre).
More recent high-resolution SGPS data allowed TL2012 to not only find partial HI absorption at v65 km s-1, but also a distinct lack of HI absorption towards previously-overlooked gas at v145 km s-1, as traced by CO(1-0) (Reynoso & Mangum, 2000). TL2012 suggest that since the v65 km s-1 gas lies between the v110 km s-1 (HI absorption) and v145 km s-1 (no HI absorption) gas, the v65 km s-1 gas may plausibly be in a non-circular orbit, as would be the case if CTB 37A is within the inner 3 kpc of the galaxy, influenced by the gravitational potential of the Perseus arm. This implies that the CTB 37A SNR distance may be between 6.3 and 9.5 kpc, thus we assume a distance of 7.91.6 in our analyses. HI absorption information is summarised in Table 1.
2 Observations
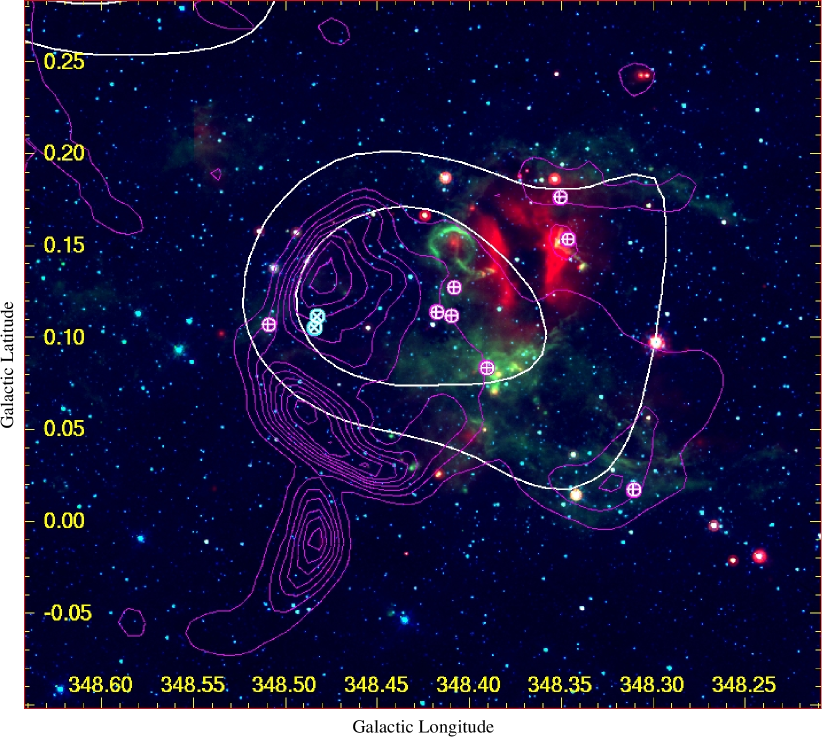
In April of 2010, we observed and co-added 5 Mopra OTF (on the fly) 1919′ area maps at 7 mm wavelength, centered on []=[348.43, 0.16], to produce a data cube with 2 spatial and 1 spectral (velocity) dimension. The scan length was 15.6′′ per cycle time (of 2.0 s) and the spacing between scan rows was 26′′. Deep ON-OFF switched pointings were also taken towards six locations (see Figure 1 and Table 3) containing 1720 MHz OH masers and one location centered on a peak of CS(1-0) emission seen in mapping data (Location 7). The naming convention for Locations 1-6 corresponds to the order of presentation of OH masers chosen from Table 2 of Frail et al. (1996). One 12 mm deep ON-OFF switched pointing was also performed towards the location [,]=[348.37∘,0.14∘] to follow up a feature discussed in § A. See Walsh et al. (2008) for the 12 mm spectrometer setup. We used a sky reference position of []=[346.40, 1.64].
The Mopra spectrometer, MOPS, was employed and is capable of recording sixteen tunable, 4096-channel (137.5 MHz) bands simultaneously when in ‘zoom’ mode, as used here. A list of measured frequency bands, targeted molecular transitions and achieved T levels are shown in Tables 2 and 3.
| Centre | Molecular | T | Detected? |
| Frequency | Emission Line | (K ch-1) | (Map/Point) |
| (GHz) | |||
| 42.310 | 30SiO(J=1-0,v=0) | 0.07 | |
| 42.500 | 28SiO(J=1-0,v=3) | 0.07 | |
| 42.840 | 28SiO(J=1-0,v=2) | 0.07 | |
| ′′ | 29SiO(J=1-0,v=0) | ′′ | |
| 43.125 | 28SiO(J=1-0,v=1) | 0.07 | |
| 43.255 | - | 0.07 | |
| 43.395 | 28SiO(J=1-0,v=0) | 0.07 | |
| 44.085 | CH3OH(7(0)-6(1) A++) | 0.08 | |
| 44.535 | - | 0.08 | |
| 45.125 | HC7N(J=40-39) | 0.09 | |
| 45.255 | HC5N(J=17-16) | 0.09 | |
| 45.465 | HC3N(J=5-4,F=5-4) | 0.09 | |
| 46.225 | 13CS(1-0) | 0.09 | |
| 47.945 | HC5N(J=16-15) | 0.12 | |
| 48.225 | C34S(1-0) | 0.12 | |
| 48.635 | OCS(J=4-3) | 0.13 | |
| 48.975 | CS(1-0) | 0.13 |
The velocity resolution of the 7 mm zoom-mode data is 0.2 km s-1. The beam FWHM and the pointing accuracy of Mopra at 7 mm are 592′′ and 6′′, respectively. The achieved T values for the total 7 mm map and individual pointings are stated in Tables 2 and 3, respectively.
OTF-mapping and deep ON-OFF switched pointing data were reduced and analysed using the ATNF analysis programs, Livedata, Gridzilla, Kvis, Miriad and ASAP111See http://www.atnf.csiro.au/computing/software/.
Livedata was used to calibrate data against a sky reference position measured after each scan of a row/column was completed. A polynomial baseline-subtraction was also applied. Gridzilla then combined corresponding frequency bands of multiple OTF-mapping runs into 16 three-dimensional data cubes, converting frequencies into line-of-sight velocities. Data were then combined, weighting by the Mopra system temperature and smoothed in the Galactic plane using a Gaussian of FWHM 1.25′.
Miriad was used to correct for the efficiency of the instrument (Urquhart et al., 2010) for mapping data and create line-of-sight velocity-integrated intensity images (moment 0) from data cubes.
ASAP was used to analyse deep ON-OFF switched pointing data. Data were time-averaged, weighted by system temperature and had fitted polynomial baselines subtracted. Like mapping data, deep pointing spectra were corrected for the Mopra beam efficiency (Urquhart et al., 2010). The beam efficiency for the CS(1-0) band for point and extended sources are 0.43 and 0.56, respectively.
CO(2-1) data was taken with the Nanten2 4 m submillimeter telescope during December of 2008. The telescope has a beam FWHM of 90′′ at 230 GHz and a pointing accuracy of 15′′. The Acoustic Optical Spectrometer (AOS) had 2048 channels separated by 0.38 km s-1, providing a bandwidth of 390 km s-1. The achieved T was 0.7 K ch-1. This CO(2-1) data offers superior spatial and velocity resolution when compared to previously-published CO(1-0) (Dame et al., 2001) data.
3 Gas Parameter Calculation
To address the amount of available hadronic target material towards HESS J1714385, the column density towards absorbed X-ray sources and the density towards the observed OH masers, we calculated column density, mass and density using CO(2-1), CS(1-0) and HI data. As we discuss in § 4, the gas observed towards CTB 37A appears extended, so we integrate our spectral line maps over a spatially wide region ([,]-space) to estimate average gas parameters within chosen regions. We used the Miriad functions moment 0 and mbspect to calculate integrated intensity, (K km s-1deg2), and produce spectral line maps.
The mass of gas within the region, , is related to the average column density, , by
| (1) |
where is the cross-sectional area of the region and is the mass of molecular hydrogen. The average density, , was estimated by assuming that the thickness of the region in the line of sight direction was of the same order as the height and width, .
3.1 CO
We scaled our CO(2-1) emission by the expected CO(1-0)/CO(2-1) intensity ratio,
| (2) |
where T is the rotational temperature, which we assume to be 10 K. This allowed us to use the commonly cited/measured CO(1-0) X-factor, 31020 cm-2(K km s-1)-1 (Dame et al., 2001) to calculate H2 column density, from CO(2-1) intensity, . Note, that a 0.7-3 systematic error in column density would be introduced for a 5 K error in temperature estimation (using Equation 2). In an extreme case, such as 40 K, like towards the shock of similar SNR, SNR W28 (Nicholas et al., 2011), we would expect the column density calculated from CO(2-1) using our method to change by a factor 0.4.
3.2 CS
We calculate the CS(J=1) column density using Equation 9 from Goldsmith & Langer (1999). This equation requires an optical depth, which would usually be estimated from the CS(1-0)-C34S(1-0) intensity ratio, but as we do not detect C34S(1-0), for simplicity we assume that the CS(1-0) emission is optically thin (0). It follows that the column densities calculated from CS(1-0) may be considered as lower limits.
An LTE assumption at T10 K implies that the total CS column density is simply a factor 3.5 times the CS(J=1) column density, and the molecular abundance of CS with respect to hydrogen is assumed to be 10-9 (Frerking et al., 1980). The systematic error introduced into the CS(1-0) column density by our temperature assumption is likely to be even smaller than that introduced for CO(2-1), with a 50% temperature systematic corresponding to a factor 0.7-1.2 error in column density. In the extreme case of 40 K, column density calculated from CS(1-0) using our method changes by 1.8 times.
3.3 HI
HI data is available (McClure-Griffiths et al., 2005; Haverkorn et al., 2006), and exhibits emission and absorption features towards CTB 37A. Where the level of radio continuum-absorption appears minor and HI emission is present, we constrain column density using an HI X-factor, 1.8231018 cm-2(K km s-1)-1 (Dickey & Lockman, 1990).
For absorption lines, we first estimate an optical depth, , where is the continuum intensity and is the local minimum intensity of an absorption line. This allows the calculation of atomic column density, 1.910, where v is an approximated full-width-half-maximum and is the spin temperature, assumed to be 100 K. Since the calculated column density is proportional to the spin temperature, the uncertainty in column density due to our assumed temperature is the percentage as the uncertainty in temperature.
4 The Spatial Gas Distribution
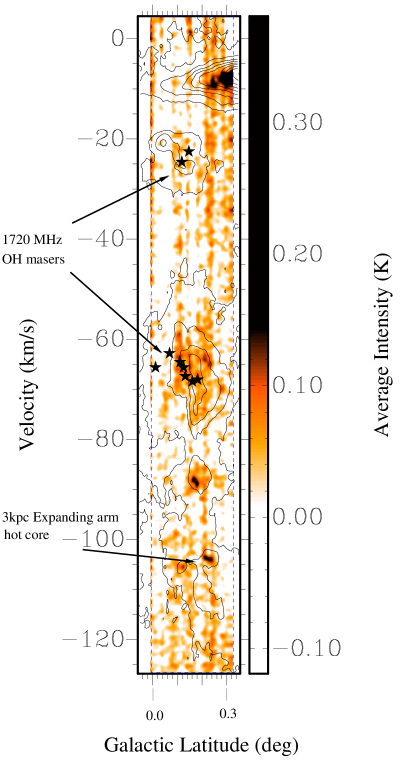
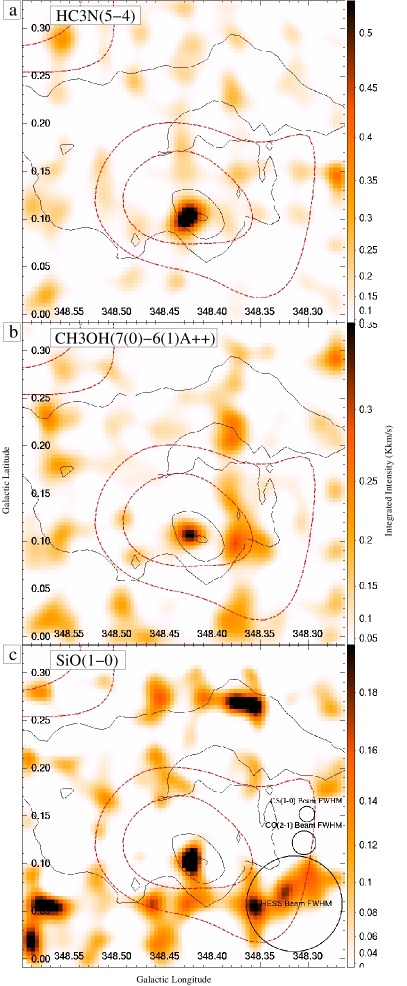
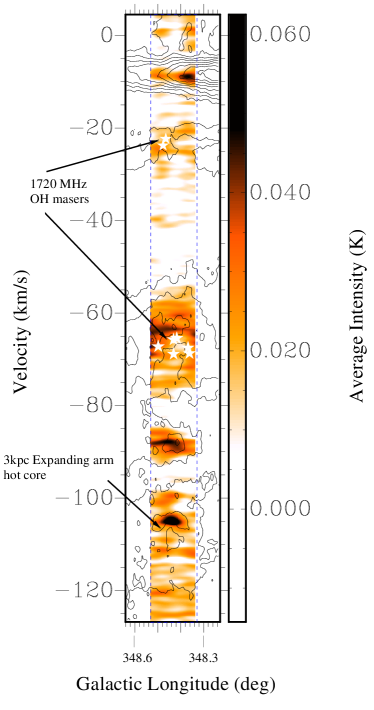
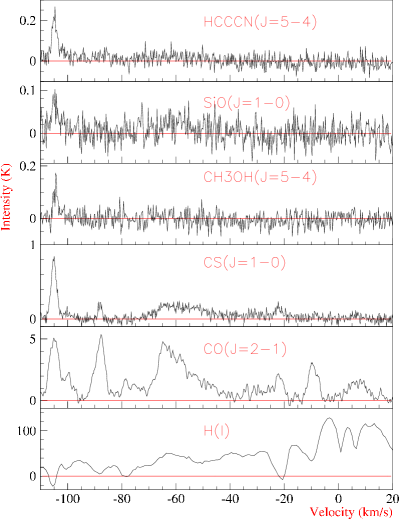
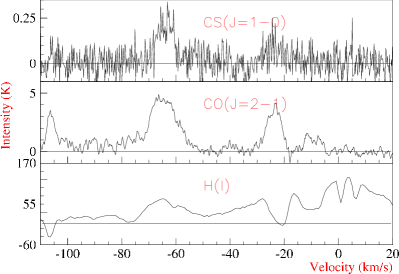
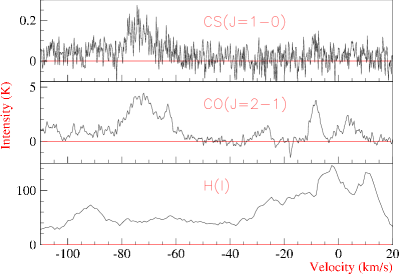
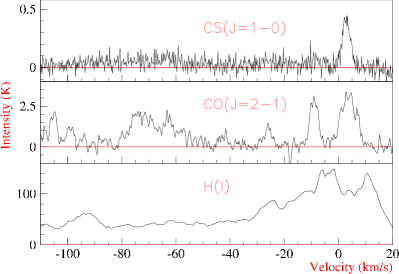
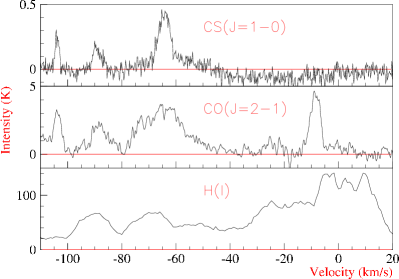
Figure 2 is a longitude-velocity plot of CO(2-1) and CS(1-0) data (see Figure 12 for a latitude-velocity plot). Several clouds are visible in CO(2-1) and CS(1-0) emission at approximate line-of-sight reference velocities, 5, 10, 22, 60 to 75, 90 and 105 km s-1. Additionally, SiO(1-0), HC3N(J=5-4) and CH3OH(7(0)-6(1) A) were detected towards ‘Location 3’ (Figure 5) at velocity, 105 km s-1. Gaussian line fit parameters to the most significant emission lines are presented in Table 3.
Together, Mopra CS(1-0), Nanten CO(2-1) and SGPS HI data (McClure-Griffiths et al., 2005; Haverkorn et al., 2006) towards seven CTB 37A locations are shown in Figures 3-10. The HI data contained a strong radio continuum component from CTB 37A, producing absorption lines in foreground gas.
| Object | Detected | T | Peak v | T | v | Counterpart |
| (l,b) | Emission Line | (K ch-1) | (km s-1) | (K) | (km s-1) | |
| Location 1 | CS(1-0) | 0.05 | 73.40.5 | 0.130.01 | 18.91.7 | 65.1 km s-1 OH maser |
| (348.35,0.18) | ||||||
| Location 2 | CS(1-0) | 0.06 | 2.870.08 | 0.410.02 | 3.60.2 | -65.2 km s-1 OH maser |
| (348.35,0.15) | HC3N(J=5-4,F=5-4) | 0.05 | 4.70.2 | 0.120.03 | 1.90.6 | |
| Location 3 | CS(1-0) | 0.05 | 105.10.03 | 0.780.02 | 2.50.1 | 63.8 km s-1 OH masera |
| (348.42,0.11) | 88.00.01 | 0.210.02 | 1.60.2 | |||
| 57.60.4 | 0.170.01 | 21.81.1 | ||||
| 22.40.5 | 0.100.07 | 9.21.4 | ||||
| SiO(J=1-0,v=0) | 0.03 | 104.60.3 | 0.060.01 | 4.41.2 | ||
| 60.22.0 | 0.020.05 | 19.25.4 | ||||
| HC3N(J=5-4,F=5-4) | 0.03 | 104.80.1 | 0.200.01 | 2.70.3 | ||
| CH3OH(7(0,7)-6(1,6) A++) | 0.03 | 104.40.1 | 0.130.01 | 1.90.2 | ||
| Location 4 | CS(1-0) | 0.04 | 61.90.6 | 0.070.01 | 12.11.8 | 63.5 km s-1 OH maser |
| (348.39,0.08) | 21.90.2 | 0.130.02 | 1.50.3 | |||
| 8.30.1 | 0.140.02 | 1.50.3 | ||||
| Location 5 | CS(1-0) | 0.04 | 23.00.1 | 0.180.02 | 3.10.4 | 23.3 km s-1 OH masera |
| (348.48,0.11) | ||||||
| Location 6 | CS(1-0) | 0.07 | 63.90.2 | 0.230.02 | 7.40.6 | 64.3 km s-1 OH maser |
| (348.51,0.11) | ||||||
| Location 7 | CS(1-0) | 0.05 | 103.90.1 | 0.260.02 | 1.70.2 | |
| (348.32,0.23) | 89.20.2 | 0.160.02 | 3.70.4 | |||
| 64.20.1 | 0.410.01 | 6.10.3 |
aPointing has partial overlap with a second 1720 MHz OH maser of similar v.
4.1 Gas Morphology
Referring to Moriguchi et al. (2005), which addresses CO(1-0) emission from the nearby SNR RX J1713.73946, regions traced by CO(2-1) and CS(1-0) may correspond to local gas (5 km s-1), the Sagittarius arm (5 to 30 km s-1), the Norma arm ( 60 to 75 km s-1), ‘Cloud A’ ( 80 to 95 km s-1, Slane et al., 1999) and the 3 kpc expanding arm ( 100 to 115 km s-1). Modeling by Vallee (2008) is not necessarily consistent with this scenario, with Figure 3d illustrating a model with possible gas components of the Sagittarius-Carina, Scutum-Crux and Norma-3 kpc arms present at velocities v 30 to 0 km s-1 towards CTB 37A (Vallee also unified the various naming conventions for different components of single arms, including the Norma and 3 kpc arms which were part of the same structure). For velocities less than v 40 km s-1, the model may predict the presence of components of the Perseus and Norma-3 kpc arms, but, as discussed by the authors, the model is less reliable towards the central 22∘ of the Galactic plane, so we do not attempt to rectify it with our observations.
In contrast to the above discussion, TL2012 make a case for the gas at 20 km s-1 and 60 km s-1 to both be associated with CTB 37A (i.e. present in the same arm) and within the inner 3 kpc of the galaxy (from HI-absorption arguments, see § 1.1).
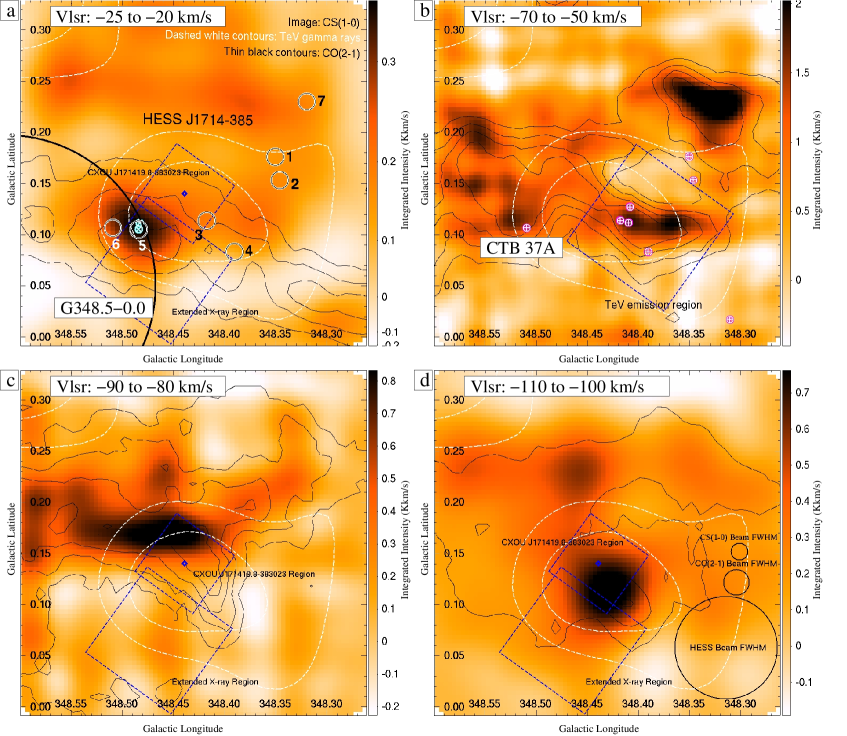
All CO(2-1) emission in Figure 2 appears to have corresponding CS(1-0) emission, indicating dense gas. CS(1-0) and CO(2-1) emission integrated around the two separate populations of OH masers at 22 and 65 km s-1 are displayed in Figures 4a and b. Figures 4c and d display two other regions of gas along the line of sight that appear in HI absorption. In Figure 4, CS(1-0) emission peaks in regions displaying intense CO(2-1) emission. We investigate the association of this gas with CTB 37A and G348.50.0 in the following sections.
4.2 G348.50.0 and Interstellar Gas at v=25 to 20 km s-1
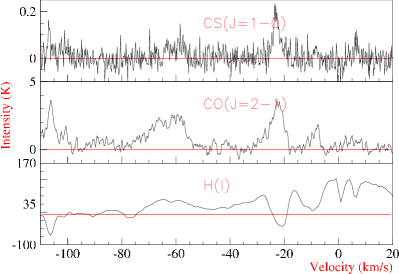
Figure 4a shows CS emission integrated over a velocity containing two 1720 MHz OH masers at v 23 and 21 km s-1(Frail et al., 1996). The CS(1-0) emission is coincident with these OH masers and a CO(2-1) emission peak and is somewhat extended, spanning 240′′ (4Beam FWHM) in length. Also note that the CS(1-0) emission peak may lie on the edge of G348.50.0, as approximately extrapolated from the partial shell observed in 843 MHz continuum data (see Figure 1). This is consistent with the v 22 km s-1 masers being a product of a G348.50.0 shock-interaction towards a region of high density.
Figure 3 displays CO(2-1), CS(1-0) and HI (and continuum) data towards ‘Location 5’, which contains the v 22 km s-1 population of 1720 MHz OH masers. CS(1-0) emission corresponds to at least three of the most intense CO(2-1) peaks (v 22, 65, 105 km s-1). The strongest CS(1-0) emission peak towards this location is at velocity v 23 km s-1, consistent with the velocity of the OH masers. A distinct HI absorption line also corresponds to the dense and masing gas at v 22 km s-1. This implies that the gas is likely foreground to the radio continuum emission from this region. It follows that if the radio continuum emission seen towards Location 5 is indeed from CTB 37A, the v 22 km s-1 gas (and associated OH maser population) lies in front of CTB 37A. Similar v 22 km s-1 HI absorption features are observed towards Locations 3, 4 and 6 (Figures 5, 6 and 7, respectively). These positions are, unlike Location 5, not towards regions of suspected SNR-SNR-overlap, only SNR CTB 37A.
The v 22 km s-1 gas may be shocked by either CTB 37A or G348.50.0. In the former case, the gas would not be at its kinematic distance (possibly within the 3 kpc ring instead), while CTB 37A would be between the foreground v 22 km s-1 gas and the background/associated v 65 km s-1 gas.
In the latter case (a G348.50.0-v 22 km s-1 maser/gas association), the Galactic rotation model distance may hold for the v 22 km s-1 gas, favouring a near-side distance solution of 3 kpc for the v 22 km s-1 masers, molecular gas and G348.50.0. It is unclear from current evidence which of the two scenarios is valid, but 1720 MHz OH maser emission from SNRs is relatively rare, with only 10% of surveyed SNRs having detectable OH masers (Green et al., 1997). Although the Green et al. survey did target (hence is biased towards) SNRs with a central thermal X-ray source, one might naively suggest, post-priori, that the likelihood of G348.50.0 producing OH maser emission is about 10%, with the more likely cause of v 22 km s-1 OH maser generation being an interaction between SNR CTB 37A and a second molecular gas clump of a different local velocity (the v 22 km s-1 gas). The work by TL2012 does seem to support the notion that the kinematic distances of these gas components are not reliable.
An estimation of mass and density at v 22 km s-1 towards Location 5 can be found using Equation 1, where is set equal to the Mopra beam FWHM area (at some assumed distance). For CS(1-0) emission, this yields a column density of 11022 cm-2, which implies a mass of 400 and density of 1103 cm-3 at a distance of 7.9 kpc (or 40 and 5103 cm-3 at a distance of 3 kpc, if G348.5 produced the v 22 km s-1 masers). This density is not as high as the 104-105 cm-3 suspected to be required for the formation of 1720 MHz OH masers (Reynoso & Mangum, 2000), but our result does not rule out this density on a scale smaller than our 7 mm beam (2 pc at 7.9 kpc), as expected for the maser-emission region size. Indeed, given that the CS(1-0) critical density is 8104 cm-3, its likely that the beam is only partially-‘filled’. Additionally, we have used an ‘optically-thin’ assumption (see §3), but the region could indeed be more optically deep, hence have a higher column density than what we have calculated.
4.3 CTB 37A and Interstellar Gas at v=70 to 50 km s-1
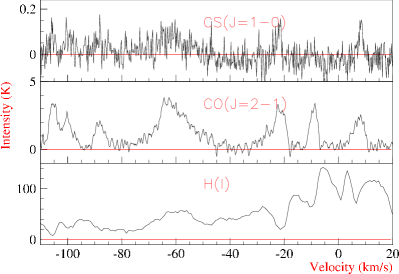
Figure 4b shows CS(1-0) emission integrated over a velocity consistent with eight 1720 MHz OH masers between v 70 and 60 km s-1 (Frail et al., 1996). Broad CS(1-0) emission is seen towards regions with intense CO(1-0) emission. Some of the gas in this field is believed to be associated with the CTB 37A SNR and the 60 km s-1 masers, which are in the inner 3 kpc of the Galaxy (between 6.3 kpc and 9.5 kpc, TL2012).
The existence of a shocked or energetic environment at v65 km s-1, possibly triggered by CTB 37A, is indicated by the extreme broadness of the CO(2-1) and CS(1-0) line spectra and clear asymmetries in CO(2-1) emission towards Locations 3 and 4 (Figures 5 and 6). In such environments, the detection of SiO emission can sometimes be expected as Si is sputtered from dust grains, but the only signal corresponding to CTB 37A from this shock-tracer was tenuous. A fit to the SiO(1-0) spectrum towards Location 3 (Figure 5, Table 3) at v 60 km s-1 (guided by the broad CS(1-0) emission) yielded a line FWHM of 195 km s-1, consistent with a shocked or turbulent region. This detection, albeit weak, may support the connection of the v65 km s-1 gas to the CTB 37A SNR.
Via CS(1-0) emission we can confirm the existence of dense gas-associations with v 65 km s-1 OH masers towards locations 3, 4 and 6. We estimate, column densities, masses and densities from CS(1-0) of 1-81022 cm-2, 500-2300 and 3-10103 cm-3, respectively, at these three locations (with assumptions outlined in § 3). These densities are, similar to the previous calculation (see § 4.3), not as high as the 104-105 cm-3 suspected to be required for the formation of 1720 MHz OH masers. This does not rule out a density of 104-105 cm-3 on a scale smaller than our 7 mm beam (2 pc at 7.9 kpc).
Towards locations 1 and 2, no CS(1-0) emission was confirmed above the noise level of 0.05 K, so like Reynoso & Mangum (2000), we are unable to give evidence of a dense-molecular gas association towards the OH masers at these two positions. Lastly, we note that towards these two positions, a shell-like structure of radius 0.025∘ centred near [,][348.37,0.16] appears to exist in CS(1-0) and CO(2-1) emission. We are unable to determine the cause of this void in molecular emission, but this may be a low gas density cavity blown out by a SNR or SNR progenitor star wind. Furthermore, we note a distict lack of molecular gas to the South of CTB 37A, so we are unable to add more to the discussion of the break-out morphology of CTB 37A.
4.4 Interstellar Gas at v90 to 80 km s-1
Figure 4c is an integrated image of the CS(1-0) and CO(2-1) emission around v85 km s-1. Some HI-absorption at v 85 km s-1 is present towards Location 3 (Figure 5). This is evidence that the v 85 km s-1 gas is foreground to CTB 37A, but this is not especially useful in distinguishing whether this gas is associated with the CTB 37A SNR (including whether this cloud is experiencing a high energy particle enhancement caused by CTB 37A). It follows that we consider both of two scenarios: an association of this gas with the gamma-ray emission and no association of this gas with the gamma-ray emission in §5.2. This gas appears at the same velocity as ‘Cloud A’ (Slane et al., 1999), which can be seen to extend over 1∘ in longitude (Moriguchi et al., 2005), suggesting a possible relation.
4.5 Interstellar Gas at v=110 to 100 km s-1
Gas from the near side of the 3 kpc-expanding-arm is observed at v 105 km s-1 in the direction of CTB 37A, as displayed in Figure 4d. The significance of this gas to the present study is a correspondence with HI absorption in the CTB 37A radio continuum (see § 1.1). CS(1-0) and CO(2-1) emission peak at a position overlapping Location 3 at 105 km s-1. CS(1-0) and HC3N(J=5-4) emission indicates that the gas is dense (CS(1-0) emission 7103 cm-3, see Table 6), while CH3OH(7(0)-6(1) A++) emission suggests the presence of high-temperature chemistry often associated with star-formation (van Dishoek & Blake, 1998). SiO(1-0) emission is also associated with this clump, implying the existence of shocked gas. Although this might be considered evidence for a SNR shock-gas interaction, the coinciding tracers (CS, HC3N and CH3OH) can also frame a picture consistent with in/outflows associated with star-formation (see Figure 13 for SiO, HC3N and CH3OH emission maps). Indeed, this narrow SiO(1-0) spectrum does not share similarities with shocked gas towards the similar SNR W28, where broad SiO emission is observed at a position/velocity consistent with OH maser emission (Nicholas et al., 2012). We display the discovered SiO, HC3N and CH3OH emission and investigate possible infrared counterparts in appendices (§A and §B).
| Region | Velocity | Assumed | CO(2-1) | CS(1-0) | ||||
| Range | Distance, | |||||||
| (km s-1) | (kpc)b | (1021 cm-2) | (M⊙) | (cm-3) | (1021 cm-2) | (M⊙) | (cm-3) | |
| TeV emissiona | to | 7.9 | 1.5 | 9 000 | 30 | 0.3 | 1 000 | 6 |
| to | 7.9 | 3.9 | 30 000 | 90 | 1.3 | 6 000 | 30 | |
| to | 7.9 | 1.2 | 8 000 | 20 | 0.2 | 700 | 3 | |
| Sum of the above | 8.1 | 47 000 | - | 1.8 | 8 000 | |||
| to | 6.3 | 2.1 | 8 000 | 30 | 0.9 | 2 000 | 20 | |
| Extended | to | 7.9 | 1.8 | 5 000 | 50 | 0.3 | 900 | 6 |
| X-ray emission | to | 7.9 | 3.2 | 9 000 | 80 | 0.8 | 3 000 | 20 |
| to | 7.9 | 0.5 | 1 000 | 10 | 0.2 | 700 | 5 | |
| to | 6.3 | 1.4 | 3 000 | 50 | 0.8 | 2 000 | 20 | |
| CXOU J171419.8 | to | 7.9 | 1.7 | 3 000 | 60 | 0.4 | 700 | 10 |
| 383023 | to | 7.9 | 7.1 | 10 000 | 240 | 1.8 | 3 000 | 60 |
| to | 7.9 | 2.1 | 3 000 | 80 | 1.1 | 2 000 | 40 | |
| to | 6.3 | 3.0 | 3 000 | 120 | 1.5 | 1 000 | 60 | |
aSuper/subscripts indicate uncertainty propagated from the 1′ uncertainty in the 68% containment radius of HESS J1714385.
bDistances are assumed for mass and density calculations, but can be scaled from the assumed distance, , to a different distance, , by multiplying by and for mass and density, respectively, if further distance constraints arise in the future.
| Region | Velocity | Assumed | HI | ||
| Range | Distance, | ||||
| (km s-1) | (kpc) | (1021 cm-2) | (M⊙) | (cm-3) | |
| TeV emission | to | 7.9 | 5.6 | 9 000 | 130 |
| 5 to 8 | - | 0.3 | - | - | |
| 0 to 2 | - | 0.3 | - | - | |
| 13 to 7 | 1.5 | 1.9 | 100 | 200 | |
| 24 to 18 | 7.9 | 2.8 | 6 000 | 50 | |
| 74 to 71 | 7.9 | 0.1 | 300 | 3 | |
| 90 to 86 | 7.9 | 0.2 | 400 | 4 | |
| 107 to 103 | 6.3 | 0.2 | 300 | 6 | |
| Absorption sum | 5.8 | 7 000 | - | ||
| Extended X-ray emission | to | 7.9 | 4.6 | 5 000 | 100 |
| 5 to 8 | - | 0.3 | - | - | |
| 0 to 2 | - | 0.4 | - | - | |
| 13 to 7 | 1.5 | 1.0 | 50 | 100 | |
| 23 to 18 | 7.9 | 1.2 | 2 000 | 30 | |
| 79 to 76 | 7.9 | 0.2 | 300 | 4 | |
| 92 to 87 | 7.9 | 0.3 | 500 | 8 | |
| 107 to 104 | 6.3 | 0.6 | 500 | 20 | |
| Absorption sum | 4.0 | - | - | ||
| CXOU J171419.8383023 | to | 7.9 | 5.9 | 4 000 | 200 |
| 5 to 8 | - | 0.2 | - | - | |
| 0 to 2 | - | 0.4 | - | - | |
| 13 to 7 | 1.5 | 1.3 | 40 | 200 | |
| 23 to 18 | 7.9 | 2.2 | 2 000 | 70 | |
| 79 to 76 | 7.9 | 0.3 | 200 | 10 | |
| 92 to 87 | 7.9 | 0.5 | 400 | 20 | |
| 107 to 104 | 6.3 | 0.6 | 300 | 30 | |
| Absorption sum | 5.5 | - | - | ||
aFrom HI emission analyses.
| Location | Velocity | Assumed | CS(1-0) | ||
| Distance | |||||
| (km s-1) | (kpc) (1021 cm-2) | (M⊙) | (cm-3) | ||
| 1 | 73.4 | 7.9 | 49 | 1 500 | 7103 |
| 3 | 105.1 | 6.3 | 39 | 800 | 7103 |
| 88.0 | 7.9 | 6.8 | 200 | 1103 | |
| 57.6 | 7.9 | 75 | 2 300 | 1104 | |
| 22.4 | 7.9 | 19 | 600 | 3103 | |
| 4 | 61.9 | 7.9 | 17 | 500 | 3103 |
| 21.9 | 7.9 | 3.9 | 100 | 600 | |
| 5 | 23.0 | 7.9 | 11 | 400 | 1103 |
| 6 | 63.9 | 7.9 | 34 | 1 100 | 5103 |
| 7 | 103.9 | 6.3 | 8.9 | 170 | 2103 |
| 89.2 | 7.9 | 1.2 | 370 | 2103 | |
| 64.2 | 7.9 | 50 | 1 500 | 7103 | |
5 Discussion
5.1 Previous X-ray Absorption Studies
CTB 37A exhibits extended thermal X-ray emission, possibly from a SNR shock-gas interaction, and a more compact non-thermal source, CXOU J171419.8383023 (Chandra beam FWHM 1′′), which may be a PWN (Aharonian et al., 2008a). Aharonian et al. (2008a) used a spectral-fitting analysis technique to estimate the level of X-ray-absorption, and hence the column density towards these two sources. We compare column densities estimated from CO(2-1), CS(1-0) and HI data to column densities calculated from X-ray absorption. The column densities and masses of significant molecular and atomic gas foreground to the CTB 37A extended X-ray emission and CXOU J171419.8383023 are presented in Tables 4 and 5. The X-ray emission regions are highlighted in Figures 4a, c and d.
Towards the extended thermal X-ray emission region, we calculated a lower limit for proton column density (2, where is the average of that derived for CO(2-1) and CS(1-0)) of 91021 cm-2. Aharonian et al. (2008a) calculated an X-ray absorption proton column density of 31022 cm-2 consistent with our lower limit and work by Sezer et al. (2011).
Similar to towards the extended thermal X-ray emission region, towards CXOU J171419.8383023, we calculated a lower limit on proton column density foreground to CTB 37A (21.51022 cm-2) that was consistent with the X-ray absorption proton column density of 61022 cm-2.
We note that the molecular gas fractions (H2/[H+H2]) for these two regions are 0.38 and 0.47. Liszt et al. (2010) investigated the atomic gas fraction from a sample of sources using HCO+ emission, CO emission and HI absorption and found that the molecular gas fraction was 0.35, i.e. 2 more atomic H atoms exist than H2 molecules. The authors noted the results of other methods that put 0.25 (Bohlin et al., 1978) and 0.40-0.45 (Liszt et al., 2002). Our calculated molecular gas fractions (0.38 and 0.47) are consistent with previous analyses, adding confidence to the accuracy of our column density estimations. There is, however, a factor 3-4 difference between our lower limits on column density and the X-ray absorption column densities. This may be due to gas components being overlooked by our observation or analysis.
5.2 Towards HESS J1714385
| Region Velocity | Assumed | Atomic mass | Molecular mass | Total mass | |
| Range | Distance, | (25% He) | |||
| (km s-1) | (kpc) | (M⊙) | (M⊙) | (M⊙) | |
| TeV emission to | 7.9 | 5 500 - 9 000 | 800 - 14 000 | 8 400 - 31 000 | 320 - 1 200 |
| to | 7.9 | 3 000 - 12 000 | 4 000 - 45 000 | 9 300 - 76 000 | 130 - 1 100 |
| to | 7.9 | 200 - 600 | 0 - 11 000 | 300 - 15 000 | 660 - 33 000 |
| Sum of the above | 8 700 - 22 000 | 4 800 - 70 000 | 18 000 - 120 000 | 80 - 550 | |
| to | 6.3 | 200 - 500 | 1 000 - 11 000 | 1 600 - 15 000 | 420 - 6 200 |
aCR enhancement factor is effectively independent of the assumed distance (as distance cancels in Equation 3 when the distance assumptions of our mass calculations are accounted for.)
If the observed TeV emission is produced by hadronic processes (i.e. CR protons or nuclei colliding with matter to produce neutral pions that decay into gamma-ray photons), constraining the mass of matter may help to constrain the CR density in the region. Aharonian et al. (1991) derived a relation to predict the flux of gamma-rays from the mass of CR-target material, assuming an integral power law spectrum. The expected gamma ray flux above is,
| (3) |
where is the gas mass in units of 105 M⊙, is the distance in units of kpc, is the CR enhancement factor above that observed at Earth and 1 TeV. The gamma-ray flux above 1 TeV towards CTB 37A is 6.710-13 cm-2s-1 (Aharonian et al., 2008a) and the masses within the HESS best fit region (68% containment of the gamma-ray source) were calculated for given velocity ranges (see Tables 4 and 5). The cosmic ray enhancement factor, , could thus be calculated for several velocity ranges. These are displayed in Table 7.
CR enhancement factor estimates (above 1 TeV) for the gas at v22, 85 and 110 km s-1 range between 320 and 33 000, whereas the CR enhancement factor esimate for the gas at v60 km s-1, the gas most likely to be associated with CTB 37A, generally spans a range of smaller values, 130 - 1 100. We assume that the gas at 60 km s-1 is associated with CTB 37A, while the gas components at 22 and 85 km s-1 may or may not additionally be associated, giving a range of possible CR-enhancements in the CTB 37A region of 80 - 1 100 (see Table 7) that observed in the local solar neighbourhood, assuming a hadronic scenario.
In a hadronic scenario for gamma-ray production, matter is expected to overlap with gamma-ray emission on a large-scale, because the TeV gamma-ray flux is proportional to the product of mass, , and cosmic ray enhancement, . If one assumes a uniform CR-density throughout the CTB 37A region, a good correlation between matter density and hadronic gamma-ray emission might be expected, which, from CO(2-1) and CS(1-0) emission (see Figure 4), may be the case for line of sight velocity, 85 km s-1, but less likely to be so for the line of sight velocities, 22 km s-1 or 110 km s-1. Gamma-ray flux variation can also reflect variation in cosmic ray enhancement, such that a region can have matter existing outside of the region indicated by gamma-ray emission contours (see Figure 4) while still being consistent with a hadronic emission scenario. With this in mind, the line of sight velocity 60 km s-1, the suspected location of CTB 37A, is consistent with a hadronic scenario. When we summed multiple emission components, i.e. the v22 km s-1, 60 km s-1 and 85 km s-1 gas, the v60 km s-1 component is dominant, such that only minimal improvement in molecular gas-gamma ray overlap was observed. It seems that from studies of the overlap between molecular gas and gamma-ray emission alone, no clear conclusion about which gas clumps correspond to CTB 37A can be drawn.
The proportion of gas that may be acting as target material towards the HESS J1714385 region is unknown, so CR enhancement estimates in Table 7 may be considered as lower than plausibly expected. Conversely, a component of dark gas (where carbon exists in an atomic/ionic form and hydrogen exists in molecular form) towards the HESS J1714385 region is not taken into account (and may indeed exceed 30% according to Wolfire et al., 2010), making the CR enhancement estimates higher than plausibly expected. Due to these two unconstrained effects, CR enhancement estimates in Table 7 should be considered with some caution.
We note that towards the HESS J1714-385 TeV emission region, a calculation of the kinetic energy (Arikawa et al., 1999; Nicholas et al., 2011) implied by observed CS(1-0) emission at 60 km s-1, , is 0.4 - 41050 erg. This is a significant fraction (4 - 40%) of the assumed SNR ejecta kinetic energy of 1051 erg, so may in fact be injected by CTB 37A. The CS(1-0) emission at 22 km s-1 is also broad, and implies a kinetic energy of 0.7-31049 erg, 0.7-3% of the assumed ejecta energy. Both the v22 and 60 kms-1 gas clouds have velocity dispersions consistent with a SNR-shock interaction.
5.3 The Age of CTB 37A
The age of CTB 37A has been considered by Sezer et al. (2011) using the assumption of full-ionisation equilibrium to calculate a plasma age of 310, where is the plasma filling-factor within a spherical region. With the benefit of the latest distance analyses by TL2012, this estimate may be scaled upwards by 20-80%, to account for a nearer distance to CTB 37A (6.3-9.5 kpc).
To complement the work of Sezer et al. (2011), similarities of CTB 37A with other SNRs cannot be overlooked. Referring to Green et al. (1997), which summarises SNRs with detected associated OH maser emission, and cross-checking these with SNR catalogues (Guseinov et al., 2003, 2004a, 2004b), a short list of OH maser-associated SNRs with estimated ages can be compiled: W28 (104 yr), W44 (104 yr), W51c (104 yr), IC 443 (103 yr), CTB 33 (105 yr) and G3470.2 (103 yr). Of these, the first 4 SNRs have diameters of 15-35 pc, similar to CTB 37A which has dimensions of 0.120.23∘ and an average diameter of 245 pc at a distance of 7.91.6. Based purely on these similarities, the CTB 37A age may be of the order of 103-104 yr.
Further support for a 103-104 yr age for CTB 37A comes from assuming a standard Sedov-Taylor time-scaling of the shock-radius (here taken from Caprioli et al. (2009), Equation 29). For an ejecta with energy 1051 erg expanding into a medium of number density 10 cm-3, similar to towards HESS J1714-385 (although the shock radius is only weakly dependent on density, being proportional to ), the shock radius reaches 245 pc after 0.6104 yr. Certainly, the old age is consistent with the large fraction of energy possibly injected into the v km s-1 cloud by CTB 37A (4-40%, § 5.2), assuming an ejecta energy of 1051 erg.
Finally, Aharonian et al. (1996) model the diffusion of CRs away from a continuous accelerator and plot the energy-dependent CR-enhancement factor for different SNR ages. We assume that slow CR diffusion, like that seen towards the similar SNR, W28 (see eg. Aharonian et al., 2008b and Gabici et al., 2010), applies to the CTB 37A region. On referring to Figure 2b in Aharonian et al. (1996), which corresponds to a galactic CR diffusion coefficient (parameterised from a CR energy of 10 GeV) of 1026 cm2s-1 and a source CR spectrum of spectral index 2.2, a CR-enhancement of 80-300 at TeV energies corresponds to an age of 104-105 yr (at a distance of 10 pc from the CR release point). The range of the models considered by Aharonian et al. (1996) does not suggest CR enhancement factors above 300. We note that the CR enhancement factor resulting from a normal (in contrast to ‘slow’) galactic diffusion coefficient of 1028 cm2s-1 is substantially lower (2-3 the local value), inconsistent with the calculated CR enhancement range, but we favour the W28-region CR diffusion speed due to the physical similarities with CTB 37A (see above).
The range of age values suggested by this CR enhancement argument (104-105 yr) spans larger values than those suggested by the previous 3 methods (the plasma age, comparison with similar remnants and the Sedov-Taylor scaling relation). If a leptonic component of gamma-ray emission was present, CR enhancement would be less than that calculated here. It also follows that the age would be overestimated by our CR enhancement factor argument.
Through this CR-enhancement factor argument, the simplistic shock-radius model, and the aforementioned similarities to other SNRs, we find that the age of CTB 37A is consistent with the previous result of Sezer et al. (2011) (for 1), of the order 104 yr.
6 Conclusions
Using CO(2-1), CS(1-0) and HI spectra, we conducted an investigation of the atomic and molecular gas towards the CTB 37A region, which has signatures of a shock-gas interaction (OH masers, thermal X-rays) and is a source of TeV gamma rays, possibly hadronic in origin.
CS(1-0) observations identified new dense gas components associated with 4 of the 6 observed locations that exhibit 1720 MHz OH maser emission.
CO(2-1), CS(1-0) and HI emission, and HI absorption allowed the estimation of lower limits of column density towards regions of interest. Column density lower limits towards X-ray emission regions are consistent with X-ray absorption measurement-derived column densities.
CO(2-1), CS(1-0) and HI-derived mass estimates for specific gas components towards the CTB 37A region allowed an investigation of the CR hadron-target mass available. Assuming that all measured mass (and an assumed additional 25% He mass) in the HESS gamma-ray emission region is potential CR target material in a hadronic scenario for TeV gamma-ray emission, we estimate a CR density of 80 - 1 100 that seen at Earth.
Based on a comparison of CTB 37A to other SNRs associated with OH-maser emission, Sedov-Taylor phase scaling of the CTB 37A shock radius, and an examination of the expected change in CR-enhancement factor with time, we estimate the CTB 37A age to be consistent with previous estimates of 104 yr.
High resolution (1′), high energy (GeV-TeV) measurements, such as what may be expected from future ground-based gamma-ray telescopes (The CTA Consortium, 2011), would allow a more detailed investigation of the nature of the high energy spectrum towards CTB 37A, especially with regard to the spatial correspondence with molecular gas.
7 Acknowledgments
This work was supported by an Australian Research Council grant (DP0662810, 1096533). The Mopra Telescope is part of the Australia Telescope and is funded by the Commonwealth of Australia for operation as a National Facility managed by the CSIRO. The University of New South Wales Mopra Spectrometer Digital Filter Bank used for these Mopra observations was provided with support from the Australian Research Council, together with the University of New South Wales, University of Sydney, Monash University and the CSIRO.
We thank Naomi McClure-Griffiths for feedback regarding our HI analysis and our anonymous referee for his/her detailed constructive criticism of our manuscript.
References
- Aharonian et al. (1991) Aharonian F., 1991, Ap&SS, 180, 305A-320A
- Aharonian et al. (1996) Aharonian F., 1991, A&A, 309, 917-928
- Aharonian et al. (2007) Aharonian F. et al.(HESS Collab.), 2007, A&A, 464, 235-243
- Aharonian et al. (2008a) Aharonian F. et al.(HESS Collab.), 2008, A&A, 490, 685
- Aharonian et al. (2008b) Aharonian F. et al.(HESS Collab.), 2008, A&A, 481, 401-410
- Arikawa et al. (1999) Arikawa Y., Tatematsu K., Sekimoto Y. & Takahashi T., 1999 Publ. Astron. Soc. Japan 51, L7-L10
- Bohlin et al. (1978) Bohlin R C., Savage B D. & Drake J F., 1978, ApJ, 224, 132
- Brand & Blitz (1993) Brand J. & Blitz L., 1993, A& A, 275, 67-90
- Brandt et al. (2011) Brandt T J., (Fermi-LAT Collab.), 2011, A view of supernova remnant CTB 37A with the Fermi Gamma-ray Telescope. J. Adv. Space Res., doi:10.1016/j.asr.2011.07.021
- Brogan et al. (2000) Brogan C., Frail D., Goss W. & Troland T., 2000, ApJ, 537, 875-890
- Caprioli et al. (2009) Caprioli D., Blasi P. & Amato E, 2009, MNRAS, 396, 2065-2073
- Casanova (2011) Casanova S., 2011, PrPNP, 66, 681-685
- Castro & Slane (2010) Castro D. & Slane P., 2010, ApJ, 717, 372-378
- Caswell et al. (1975) Caswell J., Murray J., Roger R., Cole D. & Cooke D., 1975, A&A, 45, 239-258
- Churchwell et al. (2006) Churchwell E. et al., 2006, ApJ, 649, 759-778
- Clark et al. (1975) Clark D., Green A. & Caswell J., AuJPA, 1975, 37, 75C
- The CTA Consortium (2011) The CTA Consortium, 2011, arXiv:1111.2183
- Dame et al. (2001) Dame T., Hartmann D. & Thaddeus P., 2001, ApJ, 547, 792-813
- Dickey & Lockman (1990) Dickey J M. & Lockman F J., 1990, ARA&A, 28, 215-261
- Draine et al. (1983) Draine B., Roberge W. & Dalgarno A., 1983, Ap.J, 264, 485-507
- Feinstein et al. (2009) Feinstein F., Fiasson A., Gallant Y., Chaves R., Marandon V, de Naurious M., Kosack K. & Rowell G., 2009, AIPC, 1112, 54P
- Frail et al. (1996) Frail D., Goss W., Reynoso E., Giacani E., Green A. & Otrupcek R., 1996, 111, 1651-59
- Frail et al. (1998) Frail D. & Mitchell G., 1998, 508, 690-695
- Frerking et al. (1980) Frerking M., Wilson R., Linke R. & Wannier P., 1980, ApJ, 240, 65-73
- Fukui et al. (2012) Fukui Y., Sano H., Sato J., Horachi H., Torii K., McClure-Griffiths N., Rowell G., Aharonian F. et al., 2012, ApJ, 746, 82
- Gabici et al. (2009) Gabici S., Aharonian F. & Casanova S., 2009, MNRAS, 396, 1629-1639
- Gabici et al. (2010) Gabici S., Casanova S., Aharonian F. & Rowell G., 2010, in Boissier S., Heydari-Malayeri M., Samadi R., Valls-Gaband D., eds, Proc. French Soc. Astron. Astrophys., SF2A, 313-317
- Goldsmith & Langer (1999) Goldsmith P. & Langer W., 1999, ApJ, 517, 209-225
- Green et al. (1997) Green A., Frail D., Goss W. & Otrupcek R. 1997, AJ, 114, 2058-2067
- Green et al. (1999) Green A. et al., 1999, ApJS, 122, 207
- Guseinov et al. (2003) Guseinov O., Ankay A. & Tagieva S., 2003, Serb. Astron. J., 167, 93-110
- Guseinov et al. (2004a) Guseinov O., Ankay A. & Tagieva S., 2004, Serb. Astron. J., 168, 55-69
- Guseinov et al. (2004b) Guseinov O., Ankay A. & Tagieva S., 2004, Serb. Astron. J., 168, 65-82
- Hartman et al. (1999) Hartman R. et al., 1999, ApJS, 123, 79
- Haverkorn et al. (2006) Haverkorn M., Gaensler B. M., McClure-Griffiths N. M., Dickey J. M. & Green A. J., 2006, ApJS, 167, 230
- Hewitt et al. (2008) Hewitt J., Yusef-Zadeh F. & Wardle M., 2008, ApJ, 683, 189-206
- Kassim et al. (1991) Kassim N., Baum S. & Weiler K., 1991, ApJ, 374, 212-217
- Kerr & Lynden-Bell (1986) Kerr F. & Lynden-Bell D., 1986, MNRAS, 221, 1023-1038
- Liszt et al. (2002) Liszt H S. & Lucas R., 2002, A& A, 391, 693
- Liszt et al. (2010) Liszt H S., Pety J. & Lucas R., 2010, A& A, 518, A45
- Maxted et al. (2012) Maxted N., Rowell G., Dawson B., Burton M., Nicholas B., Fukui Y., Walsh A., Kawamura A., Horachi H. & Sano H., 2012, MNRAS, 419, 251-266
- McClure-Griffiths et al. (2005) McClure-Griffiths N., Dickey J., Gaensler B., Green A., Haverkorn M. & Strasser S., 2005, ApJ, 158, 178-187
- Milne et al. (1979) Milne D., Goss W., Haynes R., Wellington K., Caswell J. & Skellern D., 1979, MNRAS, 188, 437-444
- Moriguchi et al. (2005) Moriguchi Y, Tamura K, Tawara Y, Sasago H, Yamaoka T, Onishi T & Fukui Y, 2005, ApJ, 631, 947-963
- Nicholas et al. (2011) Nicholas B., Rowell G., Burton M., Walsh A., Fukui Y., Kawamura A., Longmore S. & Keto E. 2011, MNRAS, 411, 1367-1385
- Nicholas et al. (2012) Nicholas B., Rowell G., Burton M., Walsh A., Fukui Y., Kawamura A. & Maxted, N., 2012, MNRAS, 419, 251-266
- Protheroe et al. (2008) Protheroe R., Ott J., Ekers R., Jones D. & Crocker R., 2008, MNRAS, 390, 683-692
- Reach et al. (2006) Reach W., Rho J., Tappe A., Pannuti T., Brogan C., et al.2006, ApJ, 131, 1479-1500
- Reynoso & Mangum (2000) Reynoso E. & Mangum J., 2000, ApJ, 545, 874-884
- Sezer et al. (2011) Sezer A., Gok F., Hudaverdi M. & Ercan E., 2011, MNRAS, 417, 1387-1391
- Slane et al. (1999) Slane P., Gaensler B, Dame T., Hughes J., Plucinsky P. & Green A, 1999, 525, 357-367
- Tian & Leahy (2012) Tian W. & Leahy D., 2012, MNRAS, 421, 2593-2597
- Urquhart et al. (2010) Urquhart J., Hoare M., Purcell C., Brooks K., Voronkov M., Indermuehle B., Burton M., Tothill N. & Edwards P., 2010, PASA, 27, 321-330
- Vallee et al. (2005) Vallee J, 2005, ApJ, 130, 569-575
- Vallee (2008) Vallee J, 2008, ApJ. 135, 1301-1310
- van Dishoek & Blake (1998) van Dishoeck E. & Blake G, 1998, ARA&A, 36, 317-368
- Walsh et al. (2008) Walsh A., Lo N., Burton M., White G., Purcell C., Longmore S., Phillips C. & Brooks K., 2008, PASA, 25, 105.
- Wolfire et al. (2010) Wolfire M., Hollenbach D. & McKee C., 2010, 716, 1191-1207.
Appendix A Infrared Emission towards CTB 37A
Evidence for shock-interactions are also seen at infrared wavelengths. Reynoso & Mangum (2000) noted the presence of shocked, heated dust, IRAS 171113824, towards a region of overlap between CTB 37A and G348.50.0. Reach et al. (2006) later discovered several patches and filaments of 4.5 m emission towards and around Locations 5 and 6, possibly indicating shocked H2 gas. The authors also note further evidence for shocked gas at 5.8-8 m towards the CTB 37A-G348.50.0 overlap region.
Figure 11 is an image of 24, 8 and 5.8 m infrared emission. Millimetre star-formation indicators (HC3N, CH3OH, SiO, Figure 13) are seen towards Location 3 (v110 km s-1), but no clear association is seen at infrared wavelengths. Faint 8 m emission may indicate warm dust, but this extends over a large region of the centre of CTB 37A and is most intense in the region surrounding Location 4. This characteristic, however, does not rule out the notion that warm dust may be responsible for the millimetre molecular emission towards Location 3.
North of Location 3, a shell of 8 m emission 0.020.03∘ in diameter, can be seen surrounding a compact 24 m source. This is likely to be a wind-blown bubble surrounding a high-mass O or B star (object S5 from Churchwell et al., 2006), unrelated to CTB 37A and HESS J1714385.
Emission at 24 m surrounding (,)(348.37,0.14) clearly shows hot dust obscured by a infrared-dark absorber, likely a cold foreground cloud. CO(2-1) emission at v10 km s-1 is observed towards this region, but the CO-traced gas is too uniform across CTB 37A’s north-west to explain the localised ‘finger’ of infrared-absorption. Observations of the cold, dense gas tracer NH3(1,1) were employed in an attempt to aid in constraining the absorber’s location, but we found no NH3(1,1) emission towards this location in the low-exposure HOPS galactic plane data (Walsh et al., 2008) and a follow-up high-exposure (T0.1 K ch-1) deep pointing revealed no NH3(1,1) emission either.
Appendix B Additional 7 mm Images Towards CTB 37A
Figure 12 is a position-velocity image towards the CTB 37A region. Similar to Figure 2, several clouds are visible in CO(2-1) at approximate line-of-sight reference velocities, 10, 20, 60 to 75, 90 and 105 km s-1. Corresponding CS(1-0) emission is observed towards CO(2-1)-traced clouds at approximate line-of-sight reference velocities, 10, 60 to 75, 90 and 105 km s-1, indicating dense gas at these locations.
Figure 13a/b/c are three images of emission from the HC3N, CH3OH and SiO molecules. The narrow spectral line profile and correspondence with a molecular core seen in CO(2-1) and CS(1-0) emission, suggest possible star-formation activity.