11email: amueller@eso.org 22institutetext: Universitäts-Sternwarte München, Ludwig-Maximilians-Universität, Scheinerstr. 1, 81679 München, Germany 33institutetext: Max-Planck-Institut für Astronomie, Königstuhl 17, 69117 Heidelberg, Germany 44institutetext: Max Planck Institut für Extraterrestrische Physik, Giessenbachstrasse 1, 85748 Garching, Germany 55institutetext: Astronomisches Rechen-Institut, Zentrum für Astronomie, Mönchhofstrasse, 12-14, 69120 Heidelberg, Germany 66institutetext: Zentrum für Astronomie der Universität Heidelberg (ZAH), Landessternwarte, Königstuhl 12, 69120 Heidelberg, Germany 77institutetext: Institut für Astrophysik, Georg-August-Universität, Friedrich-Hund-Platz 1, 37077 Göttingen, Germany 88institutetext: Department of Radiotherapy and Radiation Oncology, Leopoldina Hospital, Gustav-Adolf-Str. 8, 97422 Schweinfurt, Germany
Reanalysis of the FEROS observations of HIP 11952††thanks: Based on data products from observations made with ESO Telescopes at the La Silla Paranal Observatory under programme ID 60.A-9036, 072.C-0488, 072.C-0513, 073.C-0784, 074.C-0012, 074.D-0380, 075.C-0234, 075.D-0760, 076.C-0073, 076.C-0878, 077.A-9009, 077.C-0138, 077.C-0192, 077.C-0530, 078.A-9048, 078.C-0378, 078.C-0833, 079.A-9006, 079.A-9017, 079.C-0170, 079.C-0681, 080.A-9005, 080.A-9021, 080.C-0032, 082.A-9011, 082.C-0315, 083.A-9011, 084.A-9003, 084.A-9003, 084.A-9004, 084.A-9004, 084.A-9011, 085.A-9027, 085.A-9027, 085.C-0557, 086.A-9006, 086.A-9006, 086.A-9014, 086.A-9014, 086.D-0460, 087.A-9014, 087.C-0476, 088.A-9007, 088.A-9007.
Abstract
Aims. We reanalyze FEROS observations of the star HIP 11952 to reassess the existence of the proposed planetary system.
Methods. The radial velocity of the spectra were measured by cross-correlating the observed spectrum with a synthetic template. We also analyzed a large dataset of FEROS and HARPS archival data of the calibrator HD 10700 spanning over more than five years. We compared the barycentric velocities computed by the FEROS and HARPS pipelines.
Results. The barycentric correction of the FEROS-DRS pipeline was found to be inaccurate and to introduce an artificial one-year period with a semi-amplitude of 62 m s-1. Thus the reanalysis of the FEROS data does not support the existence of planets around HIP 11952.
Key Words.:
techniques: spectroscopic - stars: planetary systems - techniques: radial velocities - stars: individual: HIP 119521 Introduction
In Setiawan et al. (2012) we reported the discovery of two planets around HIP~11952, a metal-poor
star with dex.
We reported a long-period radial velocity (RV hereafter) variation of 290 d and a short-period
variation of 6.95 d based on FEROS observations with the ESO/MPG 2.2 m telescope in La Silla.
The spectroscopic analysis of the stellar
activity revealed a stellar rotation period of 4.8 d. The observed RV variations had
been associated to two planets with minimum planetary masses of 0.78 MJup
and 2.93 MJup for the inner and the outer planet, respectively.
In contrast to this result, based on HARPS N (mounted at the Telescopio Nazionale Galileo, La Palma) and HARPS (mounted at the ESO 3.6-m telescope in La Silla, Chile) observations, Desidera et al. (2013) did not find any evidence for planets around HIP 11952. In this research note we reanalyze the RV signal of the FEROS data to clarify this discrepancy. In a first step we used the star HD 10700 to compare FEROS and HARPS
measurements since there are many observations available for this object taken with both instruments.
Recently, Tuomi et al. (2013) found a signal of five significant periodicities in the RV of
HD 10700 that might be caused by a system of five planets with minimum masses
between 2.0 and 6.6 M⊕. Since those signals are associated to RV variations below 1 m s-1,
the object is still suited to compare the FEROS (Kaufer et al., 1999) and HARPS (Mayor et al., 2003) data,
taking into account the long-term precision of the FEROS RV measurements of about 10 m s-1.
The comparison reveals that the barycentric correction of the FEROS pipeline data is less acccurate than needed
for long-period RV monitoring. We applied a much more accurate correction to the FEROS data of HIP 11952 and
show that with this improved correction there is indeed no evidence for planets around this object.
The paper is organized as follows: Sections 2 and 3 present the observations and RV measurements of HD 10700 and HIP 11952, respectively. The effect of the inaccurate barycentric correction on FEROS RV measurements is presented in Sec. 4. The conclusions can be found in Sec. 5.
2 Radial velocity measurements of HD 10700
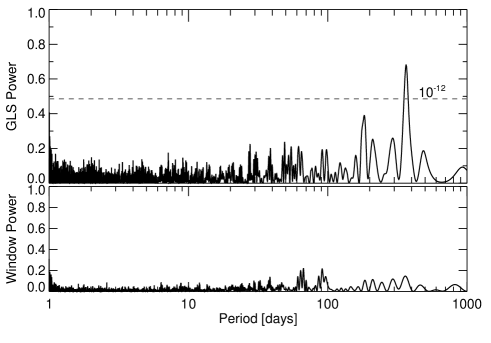
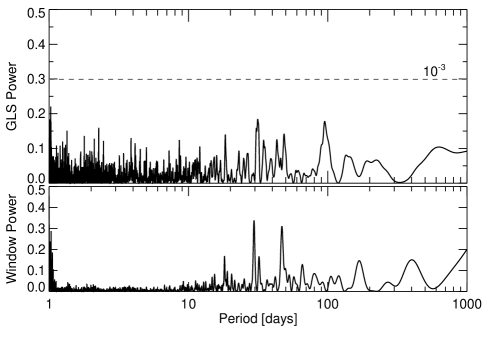
We analyzed a large data set of FEROS (117) and HARPS (153) spectra of the star HD~10700. The considered FEROS observations span a period of 5.6 years, while the HARPS observations cover 5.3 years. The measurement of the stellar RVs from FEROS and HARPS spectra was carried out using a self-written routine that cross-correlates the stellar spectra with a template spectrum. The template was a synthetic spectrum representing the stellar parameters of HD 10700. We computed of the synthetic spectrum using spectrum (Gray & Corbally, 1994) with the ATLAS9 atmosphere models (Castelli & Kurucz, 2004). Figure 1 shows the RV measurements based on FEROS data with the barycentric correction originally applied by the FEROS-DRS pipeline. Only exposures with a simultaneous ThAr spectrum were used to perform a sinusoidal fit. The radial velocity reveals a period of 365.2 days with a semi-amplitude of 62 m s-1. Figure 2 shows the computed generalized Lomb-Scargle (GLS) periodogram (Zechmeister & Kürster, 2009). The one-year period is clearly present and visible as the highest peak in the GLS. It has a false-alarm probability (FAP hereafter) of computed by the GLS.
We found that the long period in the FEROS data arises because
the barycentric correction of the FEROS-DRS pipeline was not accurate enough.
In particular, it neglects the precession of the coordinates.
We applied a more precise barycentric correction using the IDL code baryvel.pro111Part of the IDL Astronomy Users Library available at
http://idlastro.gsfc.nasa.gov. The algorithm is based on Stumpff (1980) and is accurate to 1 m s-1.
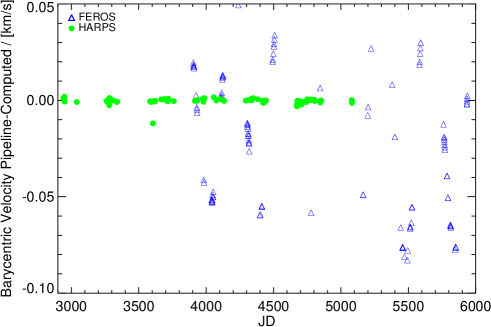
In Figure 3 we show the difference of the IDL-computed and pipeline-provided barycentric correction for HD 10700.
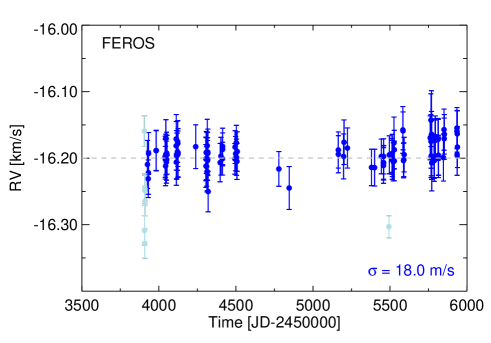
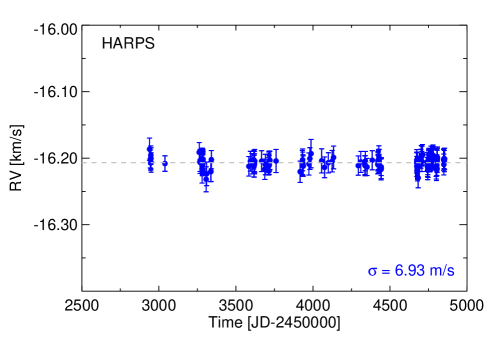
The comparison between the values computed by baryvel.pro and by the HARPS pipeline (in green) demonstrates that the adopted procedure computes the barycentric correction with the required accuracy, in contrast to the FEROS-DRS pipeline (in blue). The RMS-dispersion of the difference of the barycentric correction is 1.2 m s-1 and 34.6 m s-1 for HARPS-baryvel.pro and FEROS-baryvel.pro, respectively. Applying an accurate barycentric correction to the FEROS spectra, the RV values of HD 10700 are basically constant (see Figure 4). No indication of either a one-year period or any other period is left. We also applied this routine to the HARPS data of HD 10700. The result is shown in Figure 5. In addition to the higher signal-to-noise ratio (S/N) and spectral resolution of HARPS data with respect to the FEROS data, it should be considered that HARPS is an instrument fully optimized for high radial velocity precision (e.g. improved stability, vacuum tank).
3 Radial-velocity measurements of HIP 11952
3.1 Observations
The dataset of HIP 11952 includes the 77 observations presented in Setiawan et al. (2012) carried out from August 2009 until January 2011. We also included seven new FEROS observations not present in the analysis of Setiawan et al. (2012). All details about the observations are reported in Table LABEL:ob, including the S/N values measured at 5520Å.
We noticed that the data obtained between October 22 and 25, 2010 had poor ThAr+Ne frames.
3.2 Analysis
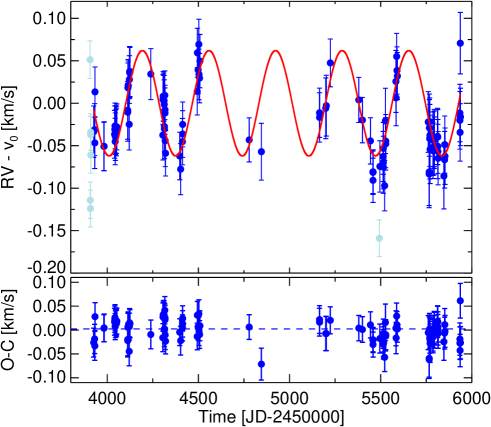
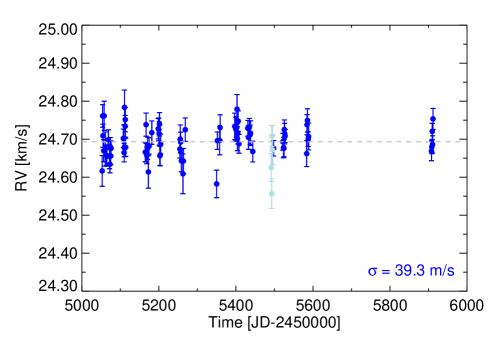
The RV of HIP 11952 was extracted by cross-correlating the stellar spectrum using two different templates and applying the newly computed barycentric correction. First, we used a synthetic spectrum created using the Synthe code based on ATLAS models with the stellar parameters determined in Setiawan et al. (2012) (e.g. =5960 K, =3.8 ( in cm s-2), dex). As a second approach, we used the stellar spectrum of HIP 11952 itself. We chose the observation with the highest S/N (S/N=170) of all observations obtained on January 3, 2010. In both cases the RV was extracted in each FEROS order. The final RV was obtained using 15 echelle orders, ranging between 4143Å and 6402Å in wavelength. These orders have the highest S/N and are free of telluric lines. The RV values together with their errors are reported in Table LABEL:ob for the synthetic template. We obtained similar results with the observed spectrum of HIP 11952. We obtained standard deviations of 36.1 m s-1 using the stellar template, and 39.3 m s-1 using the synthetic template (see Figure 6).
We applied the GLS periodogram to the RV data to search for periodicities (see Figure 7). We found no significant period in the FEROS data. In particular, we found no sign of the 290 d and 6.95 d periods claimed in Setiawan et al. (2012), in agreement with the HARPS N result presented by Desidera et al. (2013).
4 Effect of the inaccurate barycentric correction on RV measurements
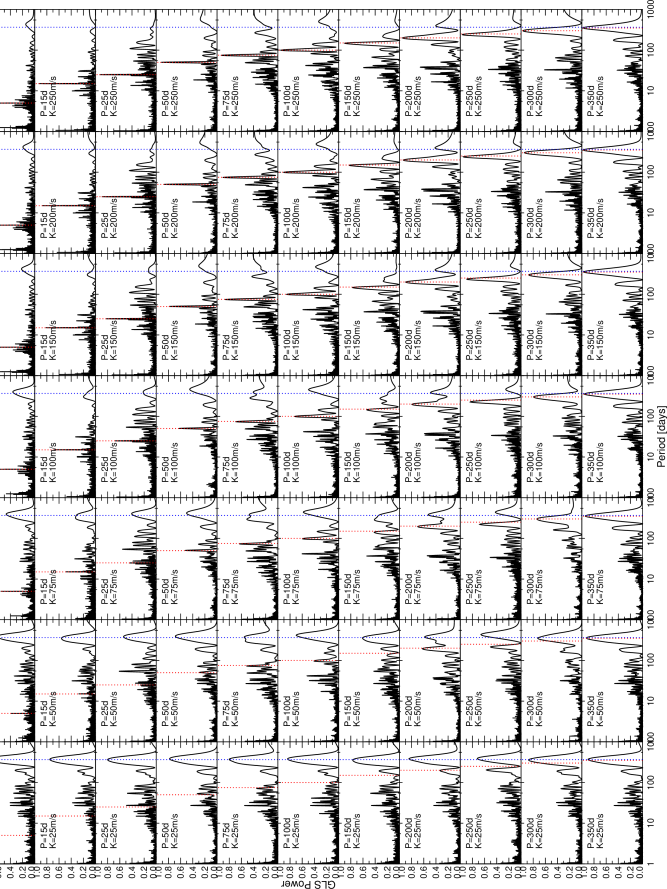
The inaccuracy of the barycentric correction of the pipeline might also affect previous RV studies carried out with FEROS. To investigate the effect on period searches using FEROS RV measurements without the applied accurate barycentric correction, we carried out a simulation using the following setup. As time basis we adopted the 77 epochs published in Setiawan et al. (2012), which cover 536 days. For periods between 5 and 350 days and velocity semi-amplitudes between 25 and 250 m s-1, sine functions with noise were computed. Error bars with a mean value of 17 m s-1 were added. The RMS-dispersion of the difference for the noisy sine functions minus the sinus function without noise is 17 m s-1, too. The sinusoidal fit displayed in Fig. 1 was added to each computed sine function to account for the inaccurate barycentric correction by the FEROS-DRS. For every setup we computed a GLS periodogram to determine whether the applied period could still be identified.
Figure 8 shows the computed GLS periodogram for each setup. The period and velocity semi-amplitude values used to
compute the individual sine functions are displayed in the legend of the individual plots. The red dashed line represents the position of the period applied to compute the individual sine functions.
For pure sinusoidal RV variations, i.e. for variations without eccentricity, we draw the following conclusions:
-
•
All periods can be identified for RV variations with semi-amplitudes greater than 150 m s-1.
-
•
For semi-amplitudes of around 100 m s-1 periods between 100 and 200 days cannot be clearly identified.
-
•
If the semi-amplitude is smaller than 100 m s-1, all periods present in the RV data set cannot be identified or are difficult to identify.
-
•
Short periods 10 days can be detected reliably if the RV amplitude is greater than about twice the RV residuals.
5 Conclusions
In this research note we presented the analysis of the HARPS and FEROS spectra of the star HD 10700 and a new detailed re-analysis of the FEROS spectra of HIP 11952, in which we included seven new observations not presented in Setiawan et al. (2012). We found that
-
1.
the barycentric correction of the FEROS pipeline was not accurate enough based on the analysis of HD 10700, and
-
2.
the RV of HIP 11952 was recomputed applying a proper barycentric correction. As a result, no significant periodicity was found in HIP 11952.
This investigation clarifies the dsicrepancy between the FEROS-based RV measurements and the HARPS-based measurements and confirms the conlcusion that we see no evidence for planets around HIP 11952.
Acknowledgements.
V.R. was supported by the DLR grant number 50 OR 1109 and by the Bayerischen Gleichstellungsförderung (BGF).References
- Castelli & Kurucz (2004) Castelli, F. & Kurucz, R. L. 2004, ArXiv Astrophysics e-prints
- Desidera et al. (2013) Desidera, S., Sozzetti, A., Bonomo, A., et al. 2013, A&A, in press
- Gray & Corbally (1994) Gray, R. O. & Corbally, C. J. 1994, AJ, 107, 742
- Kaufer et al. (1999) Kaufer, A., Stahl, O., Tubbesing, S., et al. 1999, The Messenger, 95, 8
- Mayor et al. (2003) Mayor, M., Pepe, F., Queloz, D., et al. 2003, The Messenger, 114, 20
- Setiawan et al. (2012) Setiawan, J., Roccatagliata, V., Fedele, D., et al. 2012, A&A, 540, A141
- Stumpff (1980) Stumpff, P. 1980, A&AS, 41, 1
- Tuomi et al. (2013) Tuomi, M., Jones, H. R. A., Jenkins, J. S., et al. 2013, A&A, 551, A79
- Zechmeister & Kürster (2009) Zechmeister, M. & Kürster, M. 2009, A&A, 496, 577
Appendix A GLS periodograms for simulated RV measurements
Appendix B Accompanying table
| JD / [JD-240 000 d] | Exp.Time / [second] | S/N | Airmass | Seeing / [arcsec] | RV / [m s-1] | RVerr / [m s-1] |
|---|---|---|---|---|---|---|
| 55052.83202 | 600 | 59 | 1.192 | 1.61 | 24616.40 | 40.54 |
| 55053.94928 | 600 | 62 | 1.069 | 0.83 | 24761.19 | 29.71 |
| 55054.90250 | 600 | 89 | 1.046 | 0.80 | 24708.95 | 30.31 |
| 55056.78339 | 900 | 70 | 1.385 | 1.24 | 24669.57 | 29.18 |
| 55057.94419 | 900 | 106 | 1.080 | 1.12 | 24761.33 | 38.50 |
| 55060.87386 | 960 | 41 | 1.052 | 2.16 | 24674.07 | 44.89 |
| 55063.83403 | 900 | 84 | 1.095 | 2.51 | 24656.70 | 26.10 |
| 55064.88164 | 900 | 146 | 1.045 | 0.94 | 24656.71 | 27.92 |
| 55068.89749 | 900 | 144 | 1.058 | 0.98 | 24698.63 | 25.98 |
| 55071.92782 | 900 | 154 | 1.128 | 0.79 | 24654.55 | 32.41 |
| 55072.90426 | 900 | 151 | 1.082 | 0.92 | 24633.79 | 22.48 |
| 55073.76953 | 900 | 152 | 1.207 | 1.01 | 24679.67 | 24.56 |
| 55074.91064 | 900 | 158 | 1.106 | 0.73 | 24655.54 | 22.92 |
| 55075.82762 | 900 | 127 | 1.057 | 1.30 | 24675.65 | 19.60 |
| 55107.78074 | 900 | 25 | 1.050 | – | 24702.16 | 24.39 |
| 55108.84721 | 800 | 57 | 1.192 | 1.02 | 24701.29 | 35.77 |
| 55109.76234 | 1200 | 118 | 1.046 | 1.07 | 24664.45 | 24.41 |
| 55109.78002 | 800 | 136 | 1.052 | 1.07 | 24677.58 | 23.65 |
| 55110.77245 | 800 | 53 | 1.050 | 0.75 | 24783.65 | 45.61 |
| 55112.76892 | 900 | 141 | 1.051 | 0.6 | 24734.04 | 28.53 |
| 55112.78081 | 800 | 141 | 1.061 | 0.5 | 24751.45 | 32.03 |
| 55113.76268 | 900 | 164 | 1.049 | 0.60 | 24678.47 | 23.97 |
| 55164.74363 | 900 | 150 | 1.495 | 0.63 | 24665.81 | 25.04 |
| 55166.74047 | 1000 | 151 | 1.522 | 0.54 | 24738.16 | 30.37 |
| 55167.63152 | 1000 | 169 | 1.063 | 0.66 | 24664.44 | 24.32 |
| 55168.64106 | 900 | 161 | 1.080 | 0.65 | 24657.06 | 21.53 |
| 55170.73747 | 1000 | 139 | 1.603 | 0.65 | 24676.07 | 29.07 |
| 55172.68382 | 900 | 115 | 1.244 | 0.84 | 24613.74 | 42.86 |
| 55174.66913 | 1200 | 170 | 1.211 | 1.21 | 24681.98 | 21.38 |
| 55181.54032 | 1000 | 157 | 1.054 | 0.70 | 24717.05 | 30.76 |
| 55198.52849 | 900 | 163 | 1.048 | 0.64 | 24727.36 | 26.69 |
| 55199.60741 | 900 | 171 | 1.231 | 0.71 | 24725.67 | 30.05 |
| 55200.62188 | 900 | 135 | 1.322 | 1.00 | 24714.64 | 30.84 |
| 55201.58493 | 900 | 150 | 1.164 | 1.28 | 24739.26 | 30.82 |
| 55202.61649 | 900 | 140 | 1.322 | 0.69 | 24656.11 | 25.17 |
| 55203.59183 | 900 | 132 | 1.211 | 1.21 | 24658.71 | 28.74 |
| 55204.63889 | 900 | 128 | 1.537 | 1.03 | 24686.85 | 26.46 |
| 55254.54266 | 900 | 67 | 2.132 | 1.06 | 24674.11 | 24.01 |
| 55255.52721 | 900 | 116 | 1.889 | 0.98 | 24700.37 | 37.09 |
| 55256.53307 | 900 | 133 | 2.045 | 0.82 | 24692.35 | 26.00 |
| 55258.52795 | 900 | 92 | 2.053 | 1.42 | 24642.86 | 28.91 |
| 55262.54577 | 329 | 73 | 2.757 | 0.62 | 24608.74 | 52.33 |
| 55263.54114⋆ | 546 | 103 | 2.294 | 0.80 | 24642.47 | 33.24 |
| 55268.50341 | 900 | 97 | 2.110 | – | 24724.85 | 30.84 |
| 55349.93534 | 800 | 60 | 1.889 | – | 24582.13 | 36.08 |
| 55351.92877 | 800 | 98 | 1.908 | 1.22 | 24696.06 | 23.07 |
| 55357.92508 | 800 | 95 | 1.718 | – | 24696.46 | 37.54 |
| 55358.92916 | 800 | 84 | 1.635 | 1.65 | 24730.74 | 33.41 |
| 55396.85224 | 1000 | 69 | 1.381 | 2.67 | 24733.71 | 34.97 |
| 55399.84778 | 800 | 125 | 1.363 | 1.12 | 24725.86 | 31.32 |
| 55400.91858 | 800 | 49 | 1.083 | 1.21 | 24732.45 | 27.47 |
| 55401.88071 | 800 | 80 | 1.172 | 1.24 | 24729.91 | 22.26 |
| 55402.87577 | 3000 | 46 | 1.147 | 3.45 | 24778.73 | 38.66 |
| 55403.80577 | 800 | 47 | 1.640 | 1.23 | 24701.03 | 31.49 |
| 55404.87298 | 800 | 143 | 1.171 | 0.49 | 24715.76 | 28.34 |
| 55405.85977 | 800 | 118 | 1.212 | 0.44 | 24747.55 | 26.98 |
| 55407.86952 | 800 | 101 | 1.155 | 1.08 | 24687.73 | 24.75 |
| 55430.81255 | 800 | 129 | 1.137 | 0.96 | 24728.70 | 20.57 |
| 55432.72912 | 800 | 71 | 1.611 | 1.40 | 24704.66 | 31.44 |
| 55434.83699 | 800 | 134 | 1.066 | 0.65 | 24731.88 | 22.53 |
| 55436.85315 | 800 | 156 | 1.048 | – | 24711.75 | 25.25 |
| 55437.81918 | 600 | 128 | 1.082 | 0.40 | 24715.80 | 32.50 |
| 55443.74436⋆ | 800 | 62 | 1.265 | 0.96 | 24667.47 | 27.30 |
| 55491.59264 | 900 | 122 | 1.387 | 0.98 | 24625.13 | 36.85 |
| 55492.72899 | 900 | 110 | 1.051 | 0.94 | 24556.40 | 38.67 |
| 55493.79359 | 900 | 139 | 1.196 | 1.03 | 24708.20 | 27.49 |
| 55494.84164 | 900 | 130 | 1.511 | 1.15 | 24672.08 | 38.83 |
| 55497.80114 | 900 | 127 | 1.281 | 0.94 | 24675.84 | 20.47 |
| 55521.65675 | 900 | 139 | 1.057 | 1.07 | 24693.18 | 22.35 |
| 55523.64966 | 900 | 145 | 1.055 | 0.82 | 24677.85 | 26.95 |
| 55524.57918 | 900 | 152 | 1.083 | 0.90 | 24675.97 | 22.39 |
| 55525.65589 | 900 | 157 | 1.069 | 0.67 | 24725.37 | 25.32 |
| 55526.64926 | 900 | 165 | 1.063 | 0.54 | 24714.46 | 27.10 |
| 55527.63150 | 900 | 147 | 1.050 | 0.51 | 24708.28 | 17.16 |
| 55583.63214 | 900 | 126 | 1.944 | 0.64 | 24661.91 | 34.04 |
| 55584.59585 | 900 | 111 | 1.510 | 1.36 | 24737.89 | 26.59 |
| 55585.61612 | 1000 | 141 | 1.785 | 0.70 | 24749.38 | 30.60 |
| 55587.60350 | 1200 | 73 | 1.706 | 1.36 | 24700.16 | 19.31 |
| 55588.62755 | 900 | 82 | 2.122 | – | 24707.08 | 35.28 |
| 55907.60665⋆ | 900 | 159 | 1.064 | 0.61 | 24668.73 | 25.30 |
| 55908.51258⋆ | 900 | 142 | 1.115 | 0.85 | 24679.38 | 17.49 |
| 55909.64810⋆ | 900 | 139 | 1.170 | 0.94 | 24720.42 | 21.30 |
| 55910.51765⋆ | 900 | 129 | 1.092 | – | 24686.16 | 22.72 |
| 55911.64670⋆ | 900 | 147 | 1.184 | 1.19 | 24753.35 | 27.62 |