Spontaneous exciton dissociation in carbon nanotubes
Abstract
Simultaneous photoluminescence and photocurrent measurements on individual single-walled carbon nanotubes reveal spontaneous dissociation of excitons into free electron-hole pairs. Correlation of luminescence intensity and photocurrent shows that a significant fraction of excitons are dissociating during their relaxation into the lowest exciton state. Furthermore, the combination of optical and electrical signals also allows for extraction of the absorption cross section and the oscillator strength. Our observations explain the reasons for photoconductivity measurements in single-walled carbon nanotubes being straightforward despite the large exciton binding energies.
pacs:
78.67.Ch, 71.35.-y, 78.55.-m, 78.56.-aEnhancement of the Coulomb interaction occurs in one dimensional systems because of limited screening Ogawa and Takagahara (1991), and single-walled carbon nanotubes (SWCNTs) are an ideal model system where such an effect manifests itself Ando (1997). Electron-hole pairs form tightly-bound excitons with a binding energy of a few hundred meV, which amounts to a significant fraction of the band gap energy Wang et al. (2005); Maultzsch et al. (2005). Such a large binding energy warrants the stability of excitons even at room temperature, and with exciton size being a few nm Lüer et al. (2009); Schöppler et al. (2011), strong fields on the order of 100 V/m would be required for exciton dissociation Perebeinos and Avouris (2007).
In contrast to the expectation that generation of free carriers from charge-neutral excitons would be difficult, photocurrent and photovoltaic measurements have proved to be simple and convenient tools for studying the properties of SWCNTs. Not only have they been used to measure potential landscapes Balasubramanian et al. (2005); Freitag et al. (2007); Ahn et al. (2007); Rauhut et al. (2012), optical absorption properties Lee et al. (2007); Mohite et al. (2008); Barkelid et al. (2012), and ultrafast carrier dynamics Prechtel et al. (2011), they have been instrumental in investigating unique effects that occur in SWCNTs, such as band-gap renormalization Lee (2007) and multiple electron-hole pair generation Gabor et al. (2009). It has been a perplexing situation where exciton dissociation has not been brought up as an obstacle for performing these experiments. In interpreting the results, quantitative discussion on the dissociation process has been scarce, and in some cases the excitonic effects have not been considered at all.
Here we resolve such an inconsistency by performing simultaneous photoluminescence (PL) and photocurrent (PC) measurements on individual SWCNTs. Non-zero photoconductivity is observed even at small fields, indicating that excitons are spontaneously dissociating. A simple model is constructed to consistently describe the excitation power and voltage dependences of the PL and PC. Using this model, we find that a good fraction, if not majority, of excitons are dissociating into free carriers. Within the same analysis framework, we are also able to extract the absorption cross section and the oscillator strength at the resonance.
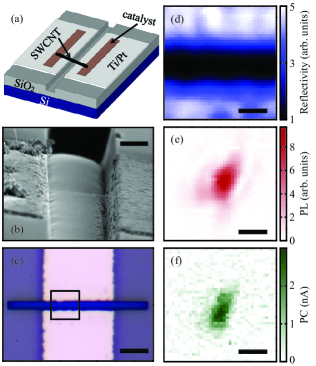
Our devices are field effect transistors with individual air-suspended SWCNTs Yasukochi et al. (2011) as shown in Fig. 1(a). We start with a Si substrate with 1-m-thick oxide, and etch 500-nm-deep trenches into the oxide layer. An electron beam evaporator is used to deposit 3-nm Ti and 45-nm Pt for electrodes. Finally, catalyst particles are placed on the contacts and alcohol chemical vapor deposition is performed to grow SWCNTs Maruyama et al. (2002); Imamura et al. (2013). A scanning electron micrograph of a typical device is shown in Fig. 1(b).
We look for devices that show nanotube PL at the trench in between the electrodes using a confocal microscope Moritsubo et al. (2010); Watahiki et al. (2012). A continuous-wave Ti:sapphire laser is used for excitation and PL is detected by an InGaAs photodiode array attached to a spectrometer. The PC measurements are performed by monitoring the current through the device in the presence of a bias voltage . We apply and to the two contacts, respectively, and ground the Si substrate. Although we do not expect much electrostatic doping because of the relatively thick oxide, this configuration ensures that the effective gate voltage at the center of the trench is zero. The current is averaged while a PL spectrum is collected, and the PC is obtained by subtracting the dark current measured in a similar manner with the laser blocked by a shutter. All measurements are done in air at room temperature.
Figure 1(c) is an optical microscope image of the device, and in the area indicated by the black box, we perform reflectivity, PL, and PC imaging simultaneously at an excitation laser power W. The reflectivity image [Fig. 1(d)] shows the position of the trench, and a luminescent nanotube suspended over the trench can be seen in the PL image [Fig. 1(e)]. The PC image shows that the signal is maximized at the same spot as PL [Fig. 1(f)]. In contrast to the case of Schottky barrier imaging Balasubramanian et al. (2005); Freitag et al. (2007); Ahn et al. (2007); Rauhut et al. (2012), we do not observe PC when the laser spot is near or on the contacts. This confirms that band bending and electrostatic doping near the contacts are negligible in our voltage configuration.
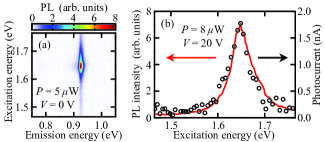
PL excitation spectroscopy performed on this nanotube at zero bias voltage shows a clear single peak [Fig. 2(a)], and we identify the nanotube chirality to be . By performing such an excitation spectroscopy under an application of bias, we obtain PL and PC excitation spectra simultaneously [Fig. 2(b)]. Both PL and PC have a peak at the same excitation energy corresponding to the resonance. The spatial and spectral coincidence of the PL and PC signals show that both are indeed coming from the same nanotube.
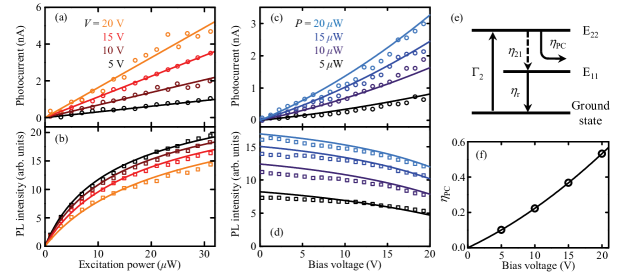
On this device, the excitation power and bias voltage dependences are investigated in Fig. 3(a-d). We first discuss the excitation power dependence. For all of the voltages, the PC signal shows a linear increase with excitation power [Fig. 3(a)], whereas PL shows a sublinear increase [Fig. 3(b)]. The latter behavior is known to be caused by exciton-exciton annihilation Matsuda et al. (2008); Murakami and Kono (2009); Xiao et al. (2010); Moritsubo et al. (2010). If the observed PC is caused by dissociation of the excitons, then we expect PC to scale with PL, as both of the signals should be proportional to the number of excitons.
Rather, the linear behavior suggests that the PC is proportional to the number of excitons injected at the energy, and that dissociation of excitons is negligible. There are at least two different processes that can result in the dissociation of excitons. It is possible that the applied electric field induces the dissociation, and in this case one would expect some threshold voltage at which the dissociation occurs Perebeinos and Avouris (2007). Another conceivable scenario is the dissociation that happens spontaneously in the course of relaxation down to exciton states.
The two pictures can be distinguished by examining the voltage dependence of the PC [Fig. 3(c)]. We observe that the PC has a slightly superlinear dependence on the applied voltage, but there exists some slope near . This implies that the conductivity is non-zero even at zero applied bias, supporting the interpretation that the injected excitons are spontaneously dissociating.
We note that the lack of field-induced dissociation for excitons is consistent with the interpretation of the intensity dependences that exciton dissociation is negligible. The binding energy for excitons is larger than excitons Perebeinos et al. (2004), and therefore we do not expect field-induced dissociation of excitons if excitons are still intact.
The voltage dependence of the PL [Fig. 3(d)] shows decrease of PL with increasing voltage. Because of more photocarriers that flow into the contacts at higher voltages, we do expect that less excitons relax into the states. As the current gives the absolute rate of electron-hole pairs extracted from the nanotube, we can deduce the number of excitons removed from the system. By modeling such a fractioning in the exciton population, we are able to determine the number of injected excitons, and in turn the absorption cross section.
Figure 3(e) shows a schematic of our model. excitons are generated at a rate
| (1) |
where nm-1 is the number of atoms per length, is the absorption cross section per carbon atom, nm is the radius of the laser spot, and is the laser photon energy. The fraction of the excitons that are extracted by PC is denoted by , while represents the fraction that relax down to the sublevel. The fraction of the excitons that recombine radiatively and contribute to PL is represented by a non-linear function which includes the effects of exciton-exciton annihilation. Here, is the rate at which the excitons are populated.
The absolute values of can be obtained from the excitation power dependence of PL [Fig. 3(b)]. At , there are no PC and therefore and . When voltages are applied, decreases by a factor . By scaling the excitation power to match the dependence at , the values of are obtained for the four voltages. We plot in Fig. 3(f).
Having obtained the explicit values of , we can now determine . Within our model, the PC is given by
| (2) |
where is the electron charge, and the only unknown parameter is . We find that a value of cm2 best matches the PC data in Fig. 3(a). This value is comparable to recent measurements of at the resonance in micelle-encapsulated tubes Oudjedi et al. (2013) and on-substrate tubes Joh et al. (2011).
In addition to , the oscillator strength is obtained using its relation to integrated absorption cross section Sakurai and Napolitano (2011). We fit the resonance with a Lorentzian profile and obtain a linewidth of meV where is the Planck constant, and we use , where is the vacuum permittivity, is the electron mass, and is the speed of light. We find which is somewhat larger compared to (6,5) nanotubes Schöppler et al. (2011).
To verify the validity of our model, we simulate the intensity and voltage dependences of PC and PL using the parameters obtained above. For the voltage dependence of , we fit the data in Fig. 3(f) with a linear term and a quadratic term. We use an analytic expression derived in Ref. Murakami and Kono (2009) for the form of , with the parameters adjusted to fit our data. As shown as solid lines in Fig. 3(a-d), the model consistently explains all the data simultaneously.
The behavior of shows that a large fraction of the injected excitons are dissociating, reaching a value as high as at V. We expect PC to saturate above a certain voltage when all free carriers are extracted, but we do not see any signs of such saturation. This suggests that there are much more free carriers available even at the highest bias voltage we used, implying that the majority of the injected excitons are dissociating.
In order to check the reproducibility and to obtain for other chiralities, we have performed similar measurements on other devices and the results are summarized in Table 1. For four tubes with a chirality of , we find that falls within . We have observed that can differ by a factor of three or so for other chiralities.
| Chirality | ||||
|---|---|---|---|---|
| (eV) | (meV) | ( cm2) | ||
| (8,7) | 1.724 | 66.6 | 2.1 | 0.020 |
| (8,7) | 1.712 | 58.4 | 2.6 | 0.022 |
| (8,7) | 1.717 | 71.3 | 1.7 | 0.017 |
| (8,7) | 1.725 | 69.1 | 2.5 | 0.025 |
| (9,7) | 1.593 | 44.2 | 9.5 | 0.060 |
| (9,8) | 1.555 | 50.5 | 7.1 | 0.052 |
| (10,6) | 1.652 | 44.5 | 2.4 | 0.015 |
| (10,8) | 1.452 | 51.5 | 1.3 | 0.009 |
We note that our model does not consider any direct recombination of excitons which occurs prior to relaxation to the state, for example exciton-exciton annihilation at the level Harrah et al. (2011). Such a process would lead to an underestimate of the number of injected excitons, and would be larger than what we have deduced from our model. In addition, free carrier generation from exciton-exciton annihilation Santos et al. (2011) is not taken into account explicitly. In principle, such a process can be identified by the behavior of PC at low powers, but the strong exciton-exciton annihilation in air-suspended nanotubes Xiao et al. (2010); Moritsubo et al. (2010) makes such an identification difficult. Further measurements at different excitation energies are expected to illuminate the relaxation kinetics of excitons.
In summary, we have performed simultaneous PL and PC spectroscopy on individual SWCNTs and constructed a model that consistently explains the excitation power and voltage dependences. Within the voltage range explored, we did not find evidences of field-induced exciton dissociation, for either of the and excitons. Instead, a considerable fraction of the injected excitons are found to spontaneously dissociate into free electron-hole pairs. We have also obtained the absorption cross section and the oscillator strength from these air-suspended SWCNTs. Our findings explain why the large exciton binding energies do not impede photoconductivity measurements in SWCNTs.
Acknowledgements.
We thank R. Saito, Y. Miyauchi and S. Maruyama for helpful discussions, T. Kan and I. Shimoyama for the use of the evaporator, and S. Chiashi and S. Maruyama for the use of the electron microscope. Work supported by KAKENHI (21684016, 23104704, 24340066, 24654084), SCOPE, and KDDI Foundation, as well as the Photon Frontier Network Program of MEXT, Japan. The devices were fabricated at the Center for Nano Lithography & Analysis at The University of Tokyo.References
- Ogawa and Takagahara (1991) T. Ogawa and T. Takagahara, Phys. Rev. B 44, 8138 (1991).
- Ando (1997) T. Ando, J. Phys. Soc. Jpn. 66, 1066 (1997).
- Wang et al. (2005) F. Wang, G. Dukovic, L. E. Brus, and T. F. Heinz, Science 308, 838 (2005).
- Maultzsch et al. (2005) J. Maultzsch, R. Pomraenke, S. Reich, E. Chang, D. Prezzi, A. Ruini, E. Molinari, M. S. Strano, C. Thomsen, and C. Lienau, Phys. Rev. B 72, 241402 (2005).
- Lüer et al. (2009) L. Lüer, S. Hoseinkhani, D. Polli, J. Crochet, T. Hertel, and G. Lanzani, Nature Phys. 5, 54 (2009).
- Schöppler et al. (2011) F. Schöppler, C. Mann, T. C. Hain, F. M. Neubauer, G. Privitera, F. Bonaccorso, D. Chu, A. C. Ferrari, and T. Hertel, J. Phys. Chem. C 115, 14682 (2011).
- Perebeinos and Avouris (2007) V. Perebeinos and P. Avouris, Nano Lett. 7, 609 (2007).
- Balasubramanian et al. (2005) K. Balasubramanian, M. Burghard, K. Kern, M. Scolari, and A. Mews, Nano Lett. 5, 507 (2005).
- Freitag et al. (2007) M. Freitag, J. C. Tsang, A. Bol, P. Avouris, D. Yuan, and J. Liu, Appl. Phys. Lett. 91, 031101 (2007).
- Ahn et al. (2007) Y. H. Ahn, A. W. Tsen, B. Kim, Y. W. Park, and J. Park, Nano Lett. 7, 3320 (2007).
- Rauhut et al. (2012) N. Rauhut, M. Engel, M. Steiner, R. Krupke, P. Avouris, and A. Hartschuh, ACS Nano 6, 6416 (2012).
- Lee et al. (2007) J. U. Lee, P. J. Codella, and M. Pietrzykowski, Appl. Phys. Lett. 90, 053103 (2007).
- Mohite et al. (2008) A. D. Mohite, P. Gopinath, H. M. Shah, and B. W. Alphenaar, Nano Lett. 8, 142 (2008).
- Barkelid et al. (2012) M. Barkelid, G. A. Steele, and V. Zwiller, Nano Lett. 12, 5649 (2012).
- Prechtel et al. (2011) L. Prechtel, L. Song, S. Manus, D. Schuh, W. Wegscheider, and A. W. Holleitner, Nano Lett. 11, 269 (2011).
- Lee (2007) J. U. Lee, Phys. Rev. B 75, 075409 (2007).
- Gabor et al. (2009) N. M. Gabor, Z. Zhong, K. Bosnick, J. Park, and P. L. McEuen, Science 325, 1367 (2009).
- Yasukochi et al. (2011) S. Yasukochi, T. Murai, S. Moritsubo, T. Shimada, S. Chiashi, S. Maruyama, and Y. K. Kato, Phys. Rev. B 84, 121409(R) (2011).
- Maruyama et al. (2002) S. Maruyama, R. Kojima, Y. Miyauchi, S. Chiashi, and M. Kohno, Chem. Phys. Lett. 360, 229 (2002).
- Imamura et al. (2013) S. Imamura, R. Watahiki, R. Miura, T. Shimada, and Y. K. Kato, Appl. Phys. Lett. 102, 161102 (2013).
- Moritsubo et al. (2010) S. Moritsubo, T. Murai, T. Shimada, Y. Murakami, S. Chiashi, S. Maruyama, and Y. K. Kato, Phys. Rev. Lett. 104, 247402 (2010).
- Watahiki et al. (2012) R. Watahiki, T. Shimada, P. Zhao, S. Chiashi, S. Iwamoto, Y. Arakawa, S. Maruyama, and Y. K. Kato, Appl. Phys. Lett. 101, 141124 (2012).
- Matsuda et al. (2008) K. Matsuda, T. Inoue, Y. Murakami, S. Maruyama, and Y. Kanemitsu, Phys. Rev. B 77, 033406 (2008).
- Murakami and Kono (2009) Y. Murakami and J. Kono, Phys. Rev. B 80, 035432 (2009).
- Xiao et al. (2010) Y.-F. Xiao, T. Q. Nhan, M. W. B. Wilson, and J. M. Fraser, Phys. Rev. Lett. 104, 017401 (2010).
- Perebeinos et al. (2004) V. Perebeinos, J. Tersoff, and P. Avouris, Phys. Rev. Lett. 92, 257402 (2004).
- Oudjedi et al. (2013) L. Oudjedi, A. N. G. Parra-Vasquez, A. G. Godin, L. Cognet, and B. Lounis, J. Phys. Chem. Lett. 4, 1460 (2013).
- Joh et al. (2011) D. Y. Joh, J. Kinder, L. H. Herman, S.-Y. Ju, M. A. Segal, J. N. Johnson, G. K.-L. Chan, and J. Park, Nature Nanotech. 6, 51 (2011).
- Sakurai and Napolitano (2011) J. J. Sakurai and J. Napolitano, Modern Quantum Mechanics, 2nd ed. (Addison-Wesley, San Francisco, 2011).
- Harrah et al. (2011) D. M. Harrah, J. R. Schneck, A. A. Green, M. C. Hersam, L. D. Ziegler, and A. K. Swan, ACS Nano 5, 9898 (2011).
- Santos et al. (2011) S. M. Santos, B. Yuma, S. Berciaud, J. Shaver, M. Gallart, P. Gilliot, L. Cognet, and B. Lounis, Phys. Rev. Lett. 107, 187401 (2011).