Structures in the Planck map of the CMB
Daniel An1, Krzysztof A. Meissner2, Paweł Nurowski3
1Science Department SUNY Maritime College, 6 Pennyfield Av., New York 10465, USA
2 Faculty of Physics, University of Warsaw, Hoża 69, 00-681 Warsaw, Poland
3 Center for Theoretical Physics of PAS, Al. Lotników 32/46, 02-688 Warsaw, Poland
Abstract.
We present the results of the quest for ring-type structures on the maps observed by the Planck satellite.
In this brief note we announce the results of a preliminary quest for the ring-type structures on the CMB maps observed by the Planck collaboration [1]. This work corroborates our earlier analysis on WMAP data [2] which was inspired by predictions of Roger Penrose [3].
The present paper reports on analysis of the real CMB temperature map in the frequency band 70 GHz as measured by the Planck collaboration. To manipulate the maps we used the HEALPix code [4]. 300 simulated maps (all with ) were created and analyzed in the same way for a comparison with the real map.
The procedure applied to look for the ring-type structures consisted in the following.
-
(1)
a grid of points with HEALPix parametrization spreading over the entire celestial sphere has been created
-
(2)
we have excluded from all the maps the Milky Way belt, radians above and below the Galactic equator
-
(3)
We were considering circles with a spherical radius centered at the points , , from the grid on the sphere. Each circle was surrounded by two rings - an inner ring , and an outer ring - each of width . The inner (respectively, outer) ring consisted of (respectively, ) points, whose spherical angle from the point was between and (respectively, between and ). The points in the rings where taken from the HEALPix grid with .
-
(4)
For each , each , 0.04, 0.08, 0.12, 0.16, 0.20, 0.24, 0.28, 0.3, 0.32, 0.34 radians, and each , 0.02, 0.04, 0,08 radians, we calculated the difference between the average temperature in the inner ring and outer ring, i.e. the quantity
with being the temperatures at the points in the respective rings as given by the Planck data team.
-
(5)
We were looking for the points for which had large absolute values.
4. Results
It is commonly taken for granted (with the notable exception of [5]) that the temperature distribution in the Cosmic Microwave Background is purely statistical being produced by the quantum fluctuations usually assumed to have taken place during inflation (as evolution of quantum fields in De Sitter space suggests).
Our comparison between the distributions of large values of quantities for the real Planck temperature map and purely statistical HEALPix maps may weaken this belief. We see differences between the real and artificial maps which are both qualitative and quantitative.
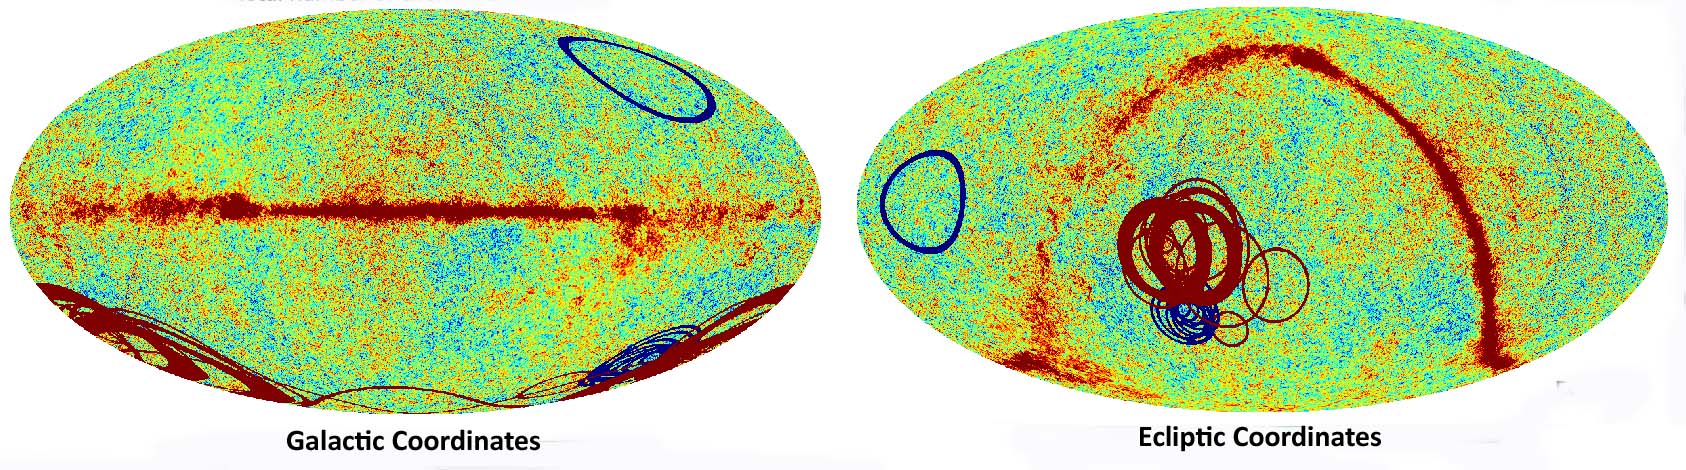
First of all, for we find two directions around which there is a significant concentration of circular structures distinguished by the large values of confirming the earlier findings in [2]. The Galactic coordinates of these two directions are approximately (which correlates with the so called “cold spot”) and (this spot with opposite values of the integral was first noticed in [2] and is confirmed by the present analysis). Actually, looking at Figures 1 and 2, one sees two significant centers of the red circles. The center of the dominant red circles has coordinates , and the center of the fainter ones is .
The quantitative comparison between the real and simulated maps is deferred to the future publication [6]. Here we only note that for the measure of the extremality of (positive or negative) values, as introduced in [7, 2], gives on the real map a value bigger than any calculated on 298 (out of 300) artificial maps.
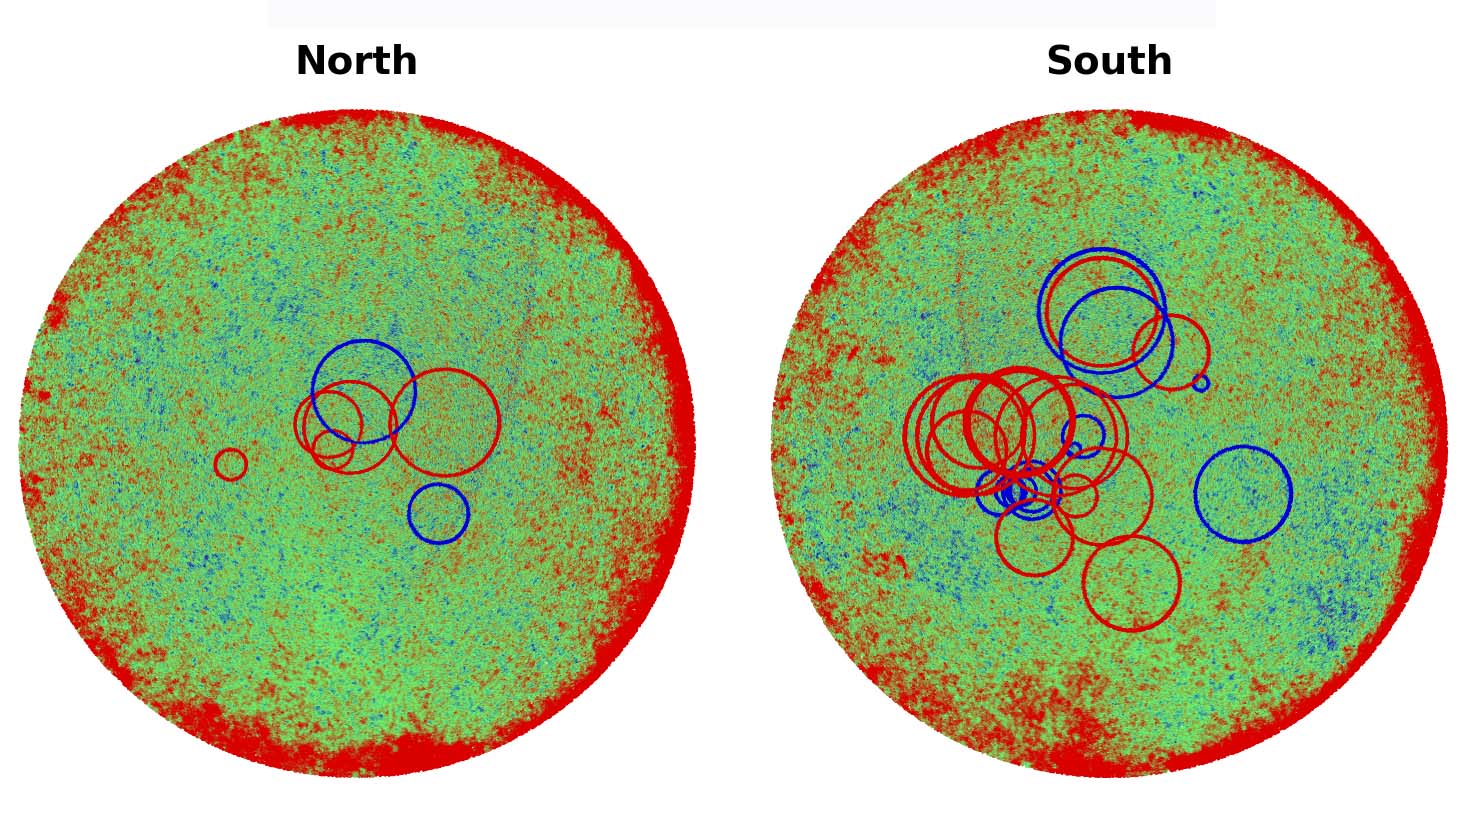
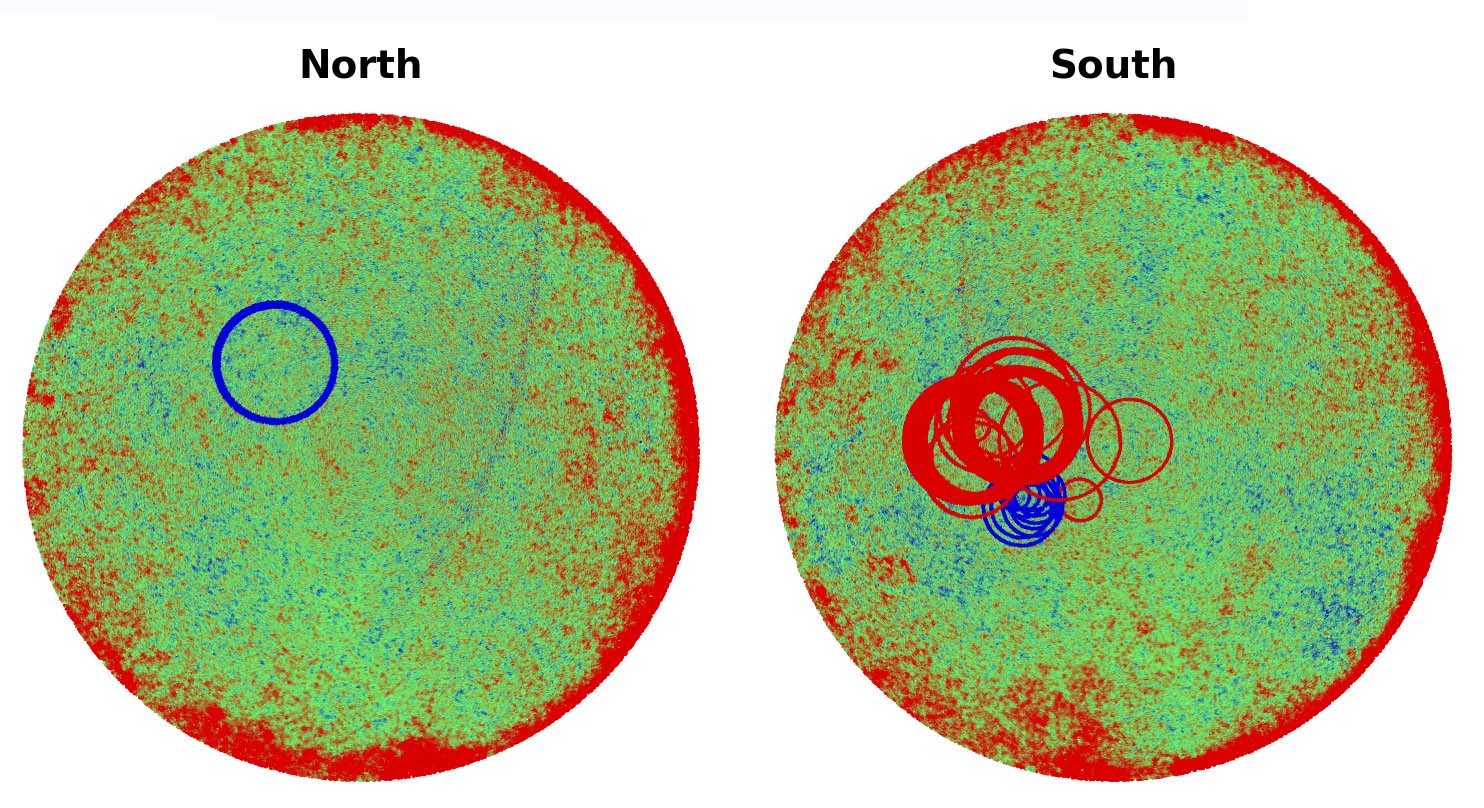
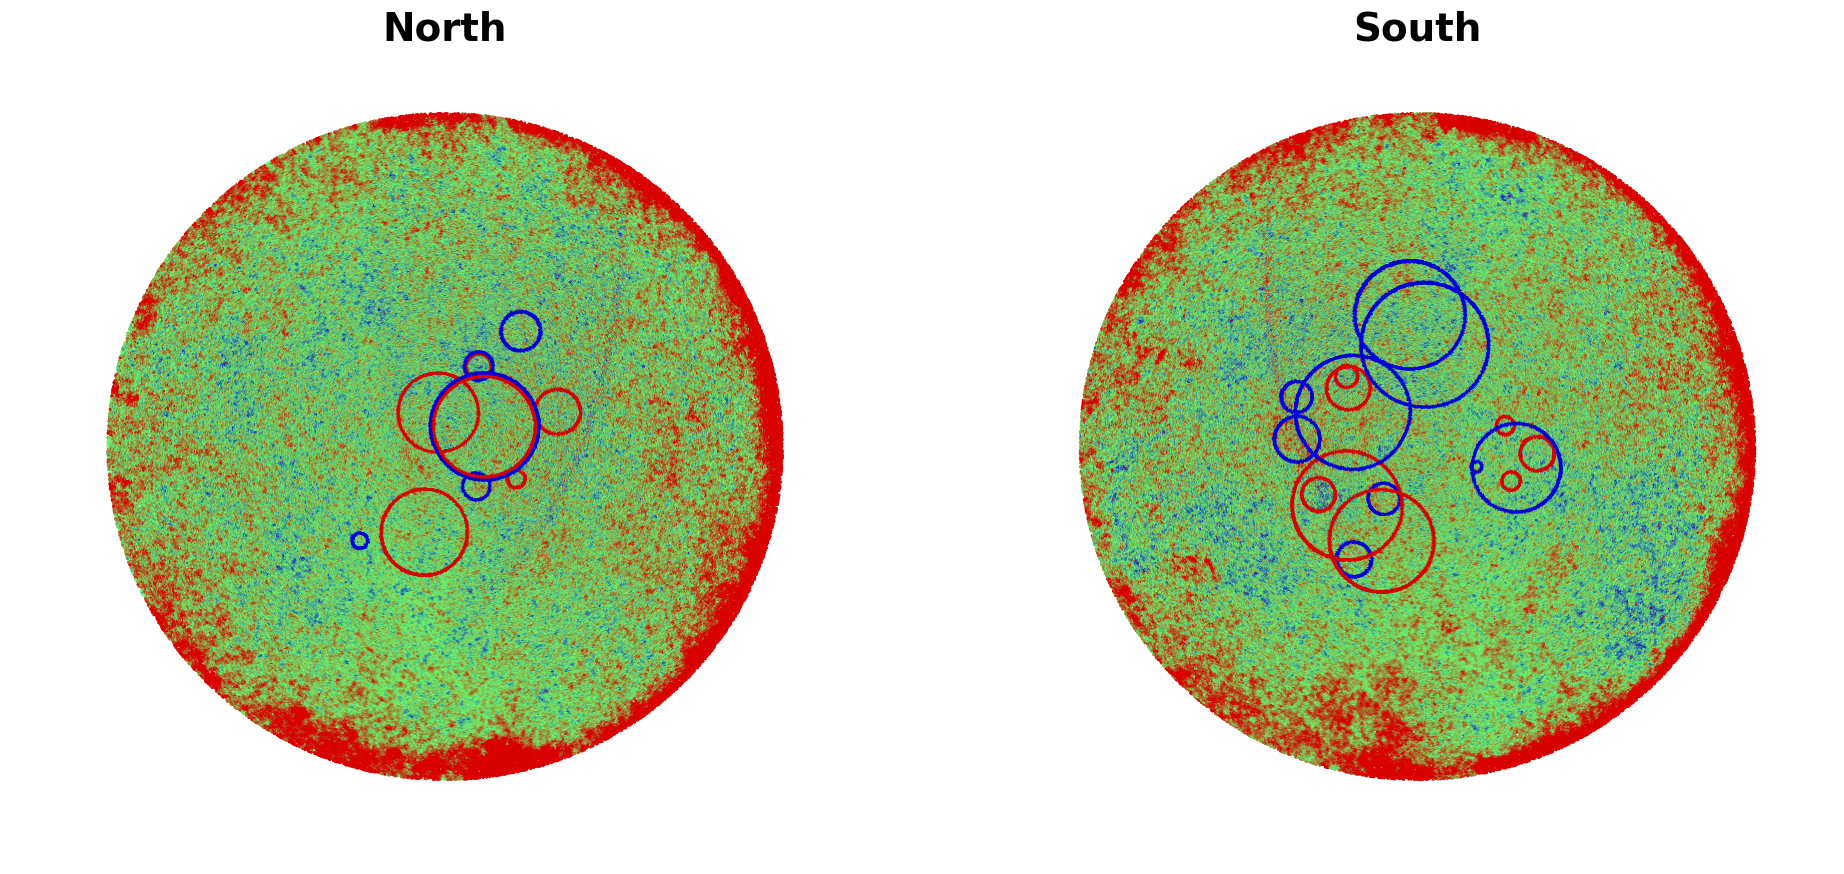
We can also note that the Southern Galactic hemisphere is remarkably different than the Northern one: the number of circular structures with large absolute values of the overlap integral is significantly larger in the South than in the North with respect to the Milky Way disk.
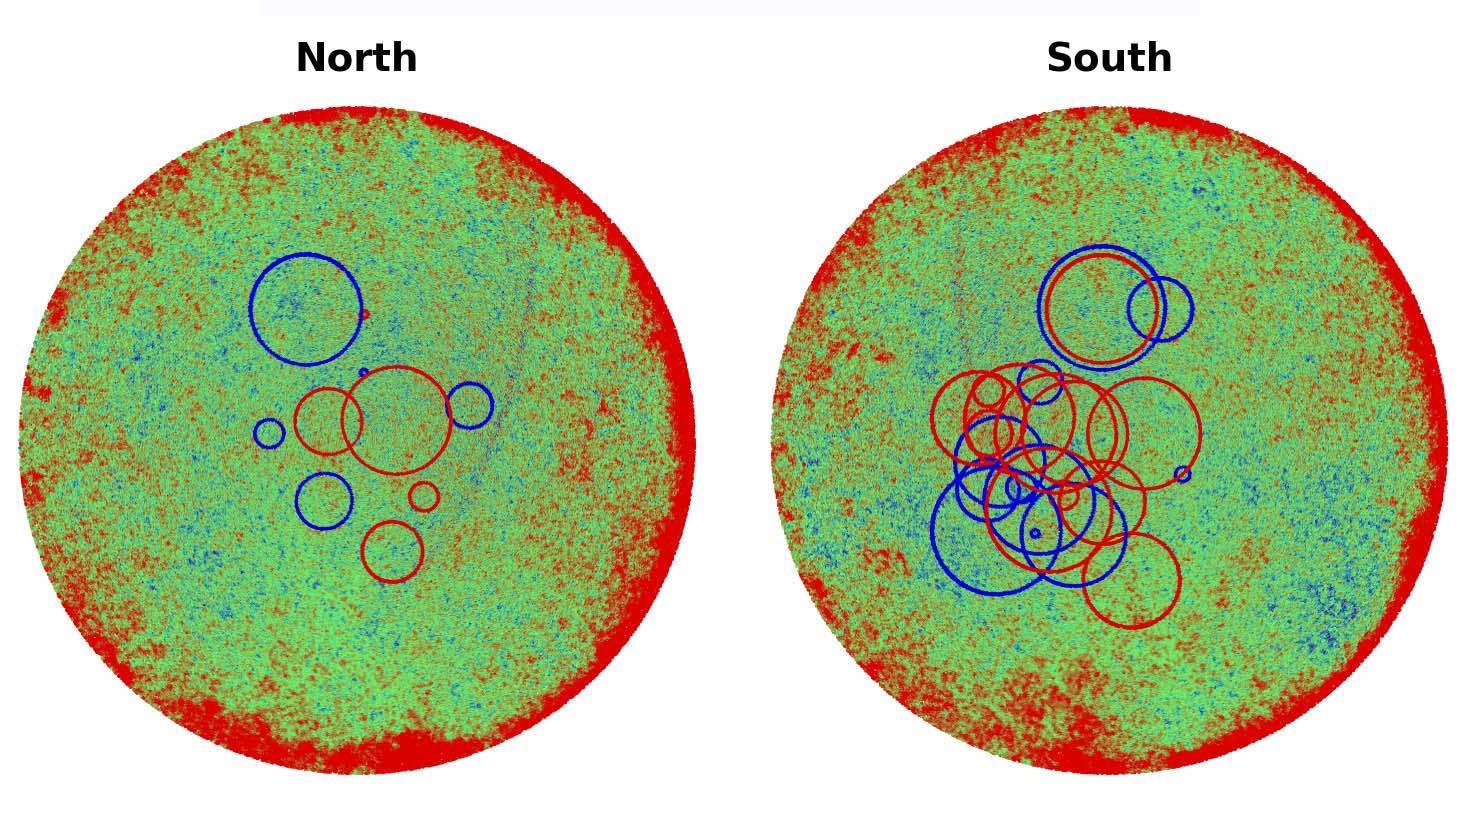
In Figure 1 we have plotted the views of the circular structures on the Planck map with two projection with respect to the Milky Way disk. In Figures 2, 3, 4 and 5 we have plotted the circular structures on the Planck map on the Southern and Northern hemispheres for respectively (using the stereographic projection from the appropriate pole and inverting)
Acknowledgments: We gratefully acknowledge helpful discussions with Paweł Bielewicz, Marek Demiański, C. Denson Hill, George Efstathiou, E. Ted Newman, Roger Penrose and Błażej Ruszczycki.
References
- [1] Planck Collaboration, Planck 2013 results, http://planck.caltech.edu/publications2013Results.html
- [2] K. A. Meissner, P. Nurowski and B. Ruszczycki (2013) Structures in the microwave background radiation, Proc. R. Soc. A469:2155, 20130116 (2013), arXiv:1207.2498[astro-ph.CO]
- [3] R. Penrose, Cycles of Time: An Extraordinary New View of the Universe, Bodley Head, 2010.
- [4] K. M. Górski at al., HEALPix: A Framework for High-Resolution Discretization and Fast Analysis of Data Distributed on the Sphere, Astroph. J. 622 (2005) 759-771.
- [5] V.G. Gurzadyan and R. Penrose (2013) On CCC-predicted concentric low-variance circles in CMB sky. Eur. Phys. J. Plus (2013) 128, 22-38.
- [6] D. An, K.A. Meissner, P. Nurowski and R. Penrose, in preparation
- [7] K.A. Meissner, (2012) A Tail Sensitive Test for Cumulative Distribution Functions, http://arxiv.org/pdf/1206.4000.pdf