X-ray Nuclear activity in S4G barred galaxies:
no link between bar strength and co-occurrent supermassive black hole fueling
Abstract
Stellar bars can lead to gas inflow toward the center of a galaxy and stimulate nuclear star formation. However, there is no compelling evidence on whether they also feed a central supermassive black hole: by measuring the fractions of barred active and inactive galaxies, previous studies have yielded conflicting results. In this paper, we aim to understand the lack of observational evidence for bar-driven active galactic nucleus (AGN) activity by studying a sample of 41 nearby ( Mpc) barred galaxies from the Spitzer Survey for Stellar Structure in Galaxies. We use Chandra observations to measure nuclear 2–10 keV X-ray luminosities and estimate Eddington ratios, together with Spitzer 3.6 m imaging to quantify the strength of the stellar bar in two independent ways: (1) from its structure, as traced by its ellipticity and boxiness, and (2) from its gravitational torque , taken as the maximum ratio of the tangential force to the mean background radial force. In this way, rather than discretizing the presence of both stellar bars and nuclear activity, we are able to account for the continuum of bar strengths and degrees of AGN activity. We find nuclear X-ray sources in 31 out of 41 galaxies with median X-ray luminosity and Eddington ratio of = erg s-1 and / = respectively, consistent with low-luminosity AGN activity. Including upper limits for those galaxies without nuclear detections, we find no significant correlation between any of the bar strength indicators and the degree of nuclear activity, irrespective of galaxy luminosity, stellar mass, Hubble type, or bulge size. Strong bars do not favor brighter or more efficient nuclear activity, implying that at least for the low-luminosity regime, supermassive black hole fueling is not closely connected to large scale features.
Subject headings:
galaxies: active — galaxies: evolution — galaxies: nuclei — galaxies: structure1. Introduction
Supermassive black holes (BHs), expected to reside in the centers of most massive galaxies (Kormendy & Richstone, 1995; Richstone et al., 1998), experienced the bulk of their growth around 10 billion years ago in short periods of vigorous mass accretion (Lynden-Bell, 1969; Soltan, 1982; Yu & Tremaine, 2002; Ueda et al., 2003; Marconi et al., 2004; Shankar et al., 2004). During these phases, BHs can be observed as quasars, the extremely bright-end of the active galactic nucleus (AGN) family. While compared to earlier times, our present-day universe can be considered quiescent in terms of BH activity, there happens to be a very significant fraction of nearby galaxies showing some level of AGN activity: the Palomar spectroscopic survey of local galaxies revealed that 40% of them display nuclear activity likely due to BH fueling (Ho et al., 1997a), yet they represent the faint-end of the AGN luminosity function and feature very modest accretion rates (Ho, 2009).
The mechanisms through which these BHs are fed are still a matter of investigation (for reviews, see Wada, 2004; Martini, 2004). The basic requirement is that a fraction of the galaxy’s interstellar medium, distributed over kiloparsec scales, has to be deprived of its angular momentum in such a way that is able to reach the innermost regions of the galaxy, close to the BH. Secular processes, i.e., those that take longer than a dynamical timescale to be relevant (for a review, see Kormendy & Kennicutt, 2004), are expected to be the dominant mechanisms feeding low-luminosity AGNs (LLAGNs) and even moderate luminosity ones out to (e.g., Gabor et al., 2009; Georgakakis et al., 2009; Cisternas et al., 2011a, b) and even (e.g., Jahnke et al., 2009; Bennert et al., 2011; Kocevski et al., 2012). In this regard, non-axisymmetric structures such as stellar bars can lead to internal instabilities and gas inflows, the necessary elements to bring gas to the center and, perhaps, fuel the BH.
Bars can play a major role in the overall evolution of a galaxy by driving its gaseous interstellar medium toward its inner regions. Through their non-axisymmetric potential, large-scale stellar bars exert torques that accumulate gas and dust at the leading end of the bar where they get shocked, lose angular momentum, and fall inward the central regions of the galaxy (Athanassoula, 1992b; Knapen et al., 1995; Regan et al., 1999; Maciejewski et al., 2002; Sheth et al., 2002; Kim et al., 2012). A diversity of observational studies support this picture: gas kinematics have revealed streaming motions inward along the bar (e.g., Regan et al., 1997; Mundell & Shone, 1999; Erroz-Ferrer et al., 2012); against their unbarred counterparts, barred galaxies show higher central concentrations of molecular gas (Sakamoto et al., 1999; Sheth et al., 2005), as well as enhanced nuclear star formation rates (e.g., Devereux, 1987; Hummel et al., 1990; Martin, 1995; Ho et al., 1997b; Sheth et al., 2000; Ellison et al., 2011; Wang et al., 2012), and a higher rate of bulges with young stellar populations (Coelho & Gadotti, 2011). The possibility that these bar-induced inflows could reach the central few parsecs and fuel a BH led large-scale bars to be proposed early-on as a plausible mechanism to trigger AGN activity (Simkin et al., 1980; Shlosman et al., 1989).
While the spatial scales involved in transporting gas from a large-scale bar to a central BH differ by a few orders of magnitude, Hubble Space Telescope (HST) observations of the central regions of barred galaxies revealed nuclear dust spiral structure connecting the kiloparsec-scale bar all the way down to the central tens of parsecs, at the resolution limit of these observations (Martini et al., 2003a). These nuclear dust structures tend to be found in a minority of galactic centers, and with comparable frequencies on both active and inactive galaxies. This suggests that (1) the AGN lifetime is less than the inflow time of these spiral structures and (2) no unique fueling mechanism can be traced at these intermediate spatial scales (Martini et al., 2003b). On the other hand, most current dynamical models agree on long-lived stellar bars (see, e.g., Athanassoula et al., 2013), and therefore if the gas being currently consumed by an active BH was initially driven by a large-scale stellar bar, one would expect some correlation between bars and galaxies with ongoing nuclear activity.
A number of studies have searched for the appealing “bar-AGN connection”, mainly by looking at samples of active and inactive galaxies and measuring their bar fractions, or conversely, by studying the AGN fraction among samples of barred and unbarred galaxies. Results have been mixed: while some studies have found tentative evidence in favor of an observable link between barred galaxies and AGNs (Arsenault, 1989; Knapen et al., 2000; Laine et al., 2002; Maia et al., 2003; Laurikainen et al., 2004a; Coelho & Gadotti, 2011; Oh et al., 2012), others have not found a causal connection between the presence of bars and AGN activity (Moles et al., 1995; McLeod & Rieke, 1995; Mulchaey & Regan, 1997; Ho et al., 1997b; Hunt & Malkan, 1999; Lee et al., 2012), and others have even found hints for an anti correlation between the presence of a bar and nuclear activity (Shlosman et al., 2000; Zhang et al., 2009).
In general, the aforementioned studies tend to discretize either (or both) bars or AGNs. Stellar bars can have a wide range of properties which will define their strength: a strong bar will induce a different level of inflow than a weak bar. AGNs, on the other hand, have a continuous distribution in luminosity and BH accretion rate that spans a few orders of magnitude implying that there are very different levels of nuclear activity. In this paper we explore the possibility of a hitherto overlooked link between bar strength and degree of AGN activity. We select a sample of barred galaxies from the Spitzer Survey of Stellar Structure in Galaxies (S4G, Sheth et al., 2010) and take advantage of the 3.6 m imaging, a reliable tracer of the old stellar population which makes up the bar, to characterize its strength through its structural properties and relative torque.
To characterize the level of BH activity, we opt to use Chandra X-ray observations, which offer a number of advantages with respect to optical diagnostics when attempting to uniformly study the low-luminosity regime. While optical emission lines such as H can suffer from contamination from extranuclear sources not related to the central engine, X-ray emission originates much closer to where the accretion is taking place, and given Chandra’s high resolution, one can identify and isolate the X-ray nuclear source from other sources of emission. X-ray observations have proven to be highly efficient in revealing previously undetected AGNs (e.g., Martini et al., 2002; Tzanavaris & Georgantopoulos, 2007; Pellegrini et al., 2007; Gallo et al., 2008; Ghosh et al., 2008; Grier et al., 2011), most notably in galaxies lacking classical bulges and conventionally thought to be unlikely BH (and hence AGN) hosts (e.g., Desroches & Ho, 2009; Araya Salvo et al., 2012).
Starting from a sample of S4G barred galaxies, as described in Section 2, we gather all the available archival Chandra data. In Section 3 we present the X-ray data analysis and asses the level of nuclear activity, and in Section 4 we describe how the strength of the stellar bars was quantified. We report our results in Section 5 and discuss their implications within the context of previous findings from the literature in Section 6.
| Galaxy | -type | Nuclear | Spec. | Obs.ID | X-ray | Counts | log | ||||||
|---|---|---|---|---|---|---|---|---|---|---|---|---|---|
| (Mpc) | Bar/Ring | Class | (ks) | Class | (erg s-1) | ||||||||
| (1) | (2) | (3) | (4) | (5) | (6) | (7) | (8) | (9) | (10) | ||||
| NGC 255 | 20. | 0 | 4. | 0 | … | … | 7844 | 4. | 6 | IV | 2 | 36.4 | |
| NGC 685 | 15. | 1 | 5. | 4 | … | … | 7857 | 4. | 6 | IV | 3 | 37.8 | |
| NGC 1036 | 11. | 1 | 0. | 0 | … | … | 7119 | 3. | 0 | IV | 2 | 36.5 | |
| NGC 1073 | 15. | 1 | 5. | 3 | … | … | 4686 | 5. | 6 | I | 27 | 38.3 | |
| NGC 1097 | 20. | 0 | 3. | 2 | nb,nr | L | 2339 | 5. | 6 | II | 1828 | 40.9 | |
| NGC 1232 | 18. | 6 | 5. | 0 | … | … | 10798 | 52. | 9 | I | 81 | 38.6 | |
| NGC 1291 | 8. | 6 | 0. | 1 | nb | L | 11272 | 69. | 0 | II | 812 | 39.2 | |
| NGC 1300 | 18. | 0 | 4. | 0 | nr | … | 11775 | 29. | 7 | II | 125 | 38.6 | |
| NGC 1302 | 20. | 0 | 0. | 1 | … | … | 7847 | 4. | 9 | I | 13 | 37.3 | |
| NGC 1341 | 16. | 8 | 1. | 2 | … | … | 7846 | 4. | 9 | IV | 2 | 35.9 | |
| NGC 1367 | 23. | 2 | 1. | 1 | … | … | 7277 | 14. | 8 | I | 455 | 40.7 | |
| NGC 1493 | 11. | 3 | 6. | 0 | … | … | 7145 | 10. | 0 | I | 51 | 38.5 | |
| NGC 1637 | 10. | 6 | 5. | 0 | … | … | 766 | 38. | 5 | I | 179 | 38.2 | |
| NGC 1640 | 19. | 1 | 3. | 0 | … | … | 7891 | 5. | 0 | I | 23 | 38.6 | |
| NGC 1672 | 14. | 5 | 3. | 2 | nr | S | 5932 | 39. | 5 | II | 91 | 38.4 | |
| NGC 2787 | 10. | 2 | -1. | 0 | nr | L | 4689 | 30. | 7 | I | 500 | 40.0 | |
| NGC 3344 | 6. | 0 | 4. | 0 | … | … | 7087 | 1. | 7 | I | 12 | 38.0 | |
| NGC 3351 | 10. | 1 | 3. | 0 | nr | … | 5931 | 39. | 5 | III | 32 | 37.3 | |
| NGC 3368 | 10. | 8 | 2. | 2 | nb,nr | … | 391 | 2. | 0 | II | 8 | 36.3 | |
| NGC 3627 | 10. | 0 | 3. | 0 | … | L | 9548 | 49. | 5 | II | 48 | 37.8 | |
| NGC 4136 | 9. | 6 | 5. | 1 | … | … | 2921 | 19. | 7 | I | 15 | 37.4 | |
| NGC 4245 | 9. | 6 | 0. | 1 | nr | … | 7107 | 2. | 2 | IV | 6 | 38.2 | |
| NGC 4303 | 16. | 4 | 4. | 0 | nb,nr | S2 | 2149 | 28. | 0 | II | 154 | 38.8 | |
| NGC 4314 | 9. | 6 | 1. | 0 | nr | … | 2062 | 16. | 1 | II | 26 | 37.8 | |
| NGC 4394 | 16. | 7 | 3. | 0 | … | … | 7864 | 5. | 0 | III | 8 | 36.2 | |
| NGC 4450 | 16. | 5 | 2. | 4 | … | L | 3997 | 3. | 4 | I | 479 | 40.2 | |
| NGC 4548 | 16. | 2 | 3. | 0 | … | L | 1620 | 2. | 7 | I | 27 | 38.6 | |
| NGC 4579 | 19. | 5 | 2. | 9 | nr | S2 | 807 | 33. | 9 | II | 26437 | 41.4 | |
| NGC 4596 | 16. | 7 | 0. | 1 | … | … | 11785 | 31. | 0 | I | 45 | 38.3 | |
| NGC 4639 | 22. | 3 | 3. | 5 | … | S1 | 408 | 1. | 3 | I | 417 | 42.0 | |
| NGC 4713 | 16. | 3 | 6. | 8 | … | … | 4019 | 4. | 9 | I | 9 | 38.3 | |
| NGC 4725 | 13. | 6 | 2. | 2 | nb | S2 | 2976 | 24. | 6 | I | 397 | 41.1 | |
| NGC 5350 | 31. | 2 | 3. | 5 | … | … | 5903 | 4. | 5 | II | 13 | 38.8 | |
| NGC 5371 | 29. | 4 | 4. | 0 | … | S | 13006 | 5. | 4 | I | 19 | 39.2 | |
| NGC 5584 | 26. | 7 | 6. | 0 | … | … | 11229 | 7. | 0 | IV | 3 | 36.0 | |
| NGC 5728 | 30. | 5 | 1. | 2 | nb,nr | S1.9 | 4077 | 18. | 7 | II | 503 | 40.2 | |
| NGC 5964 | 26. | 5 | 6. | 9 | … | … | 12982 | 9. | 8 | IV | 2 | 37.8 | |
| NGC 7479 | 33. | 8 | 4. | 3 | … | S1.9 | 11230 | 24. | 7 | I | 105 | 39.0 | |
| NGC 7552 | 17. | 1 | 2. | 4 | nr | H2 | 7848 | 5. | 0 | II | 131 | 39.1 | |
| NGC 7743 | 21. | 4 | 0. | 1 | … | S2 | 6790 | 13. | 8 | I | 88 | 38.4 | |
| PGC 3853 | 12. | 6 | 7. | 0 | … | … | 12981 | 9. | 8 | IV | 6 | 37.7 | |
Note. — Column (1): galaxy name; Column (2): redshift independent distances from NED; Column (3): morphological -type from HyperLeda (Paturel et al., 2003); Column (4): nuclear bars (nb) and nuclear rings (nr) are indicated if present, based on Buta et al. (2010), Laine et al. (2002), Erwin (2004), and Comerón et al. (2010); Column (5): nuclear spectroscopic classification from Ho et al. (1997a), Véron-Cetty & Véron (2006), and Smith et al. (2007). where L=LINER, S=Seyfert, and its attached number indicating its particular type, and H2=H ii nucleus; Column (6): Chandra observation ID; Column (7): net exposure time of processed observation; Column (8): X-ray nuclear classification as illustrated in Figure 2; Column (9): effective background-subtracted broadband counts or upper limit when no nuclear point source was detected; Column (10): Intrinsic X-ray luminosity in the 2–10 keV band or upper limit.
2. Sample and Data
In this paper we analyze a sample of barred galaxies drawn from the S4G data set with the goal of studying whether bar strength and X-ray nuclear activity are connected. Below we briefly describe the S4G survey, as well as the parent sample of barred galaxies for which we searched for archival Chandra X-ray data.
2.1. S4G Barred Galaxy Sample
S4G is a post-cryogenic Cycle 9 Science Exploration Program aiming to provide near-infrared (NIR) imaging of over 2300 nearby ( Mpc) galaxies at 3.6 and 4.5 m with the Infrared Array Camera (IRAC; Fazio et al., 2004) onboard the Spitzer Space Telescope. Galaxy images are uniformly processed with the S4G reduction pipeline (for details, see Sheth et al., 2010), with the final mosaics having a 075/pixel scale and a resolution of 17.
In this paper, we use the parent sample of barred galaxies selected by T. Kim et al. (in preparation), in which the structure of stellar bars is explored in detail. At the time of the sample selection (November 2011), over 50 percent of the S4G sample had already been processed by the basic pipelines, providing science-ready images. Barred galaxies were identified as such through a visual inspection of the NIR images by members of the S4G team. From these, a total of 144 barred galaxies were selected based on the following criteria: sample selection focussed firstly on avoiding doubtful cases, galaxies which were highly inclined (), significantly disturbed by an ongoing close interaction or merger, overly faint or irregular, or simply unsuitable for image fitting (e.g. because of a bright foreground star in a critical position). Secondly, the selection was done in a way in which a good coverage of all disk Hubble types is obtained. While this means that the sample is not complete, these selection procedures assure that the sample is (1) representative of the local population of barred galaxies, and (2) suitable for structural analysis via image decomposition, meaning that the structural parameters can be accurately derived.
2.2. Chandra X-ray Data
To identify possible X-ray emission from AGNs we look for archival observations carried out with the Advanced CCD Imaging Spectrometer (ACIS; Garmire et al., 2003) onboard Chandra. Compared to other X-ray observing facilities, ACIS offers excellent angular resolution, featuring a point-spread function (PSF) with a full width at half maximum of 1′′. This allows us to search for point like emission coincident with the NIR center, and at the same time avoid confusion with other X-ray emitting sources, such as surrounding diffuse hot gas and unresolved X-ray binaries.
Forty-one out of 144 galaxies from our parent sample have publicly available ACIS observations from the Chandra Data Archive111http://cxc.harvard.edu (as of October 2012). When more than one observation was available for a given galaxy, the one with the longest exposure time was selected. ACIS consists of 10 CCDs arranged in two configurations: a 22 array (ACIS-I) and a 16 array (ACIS-S), with the former designed for imaging, and the latter used for both imaging and grating spectroscopy. Out of the 41 ACIS observations, 39 were carried out with the S-array and the remaining two (NGC 1232 and NGC 5350) with the I-array. The data analysis is performed on data collected by the on-axis chips, meaning both S2 and S3 chips for the S-array observations and all of the four I chips when the I-array was used.
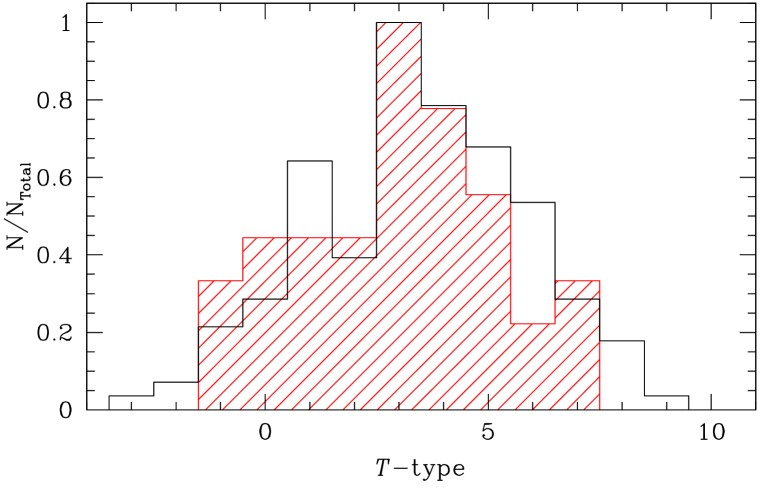
Given that these are archival observations from individual programs and not part of a uniform X-ray survey, we could in principle be biased towards X-ray luminous active galaxies. Nevertheless, not all of the Chandra observations analyzed here were designed to study nuclear activity in nearby galaxies. Many of these galaxies were observed with the aim of studying supernovae or other ultra luminous X-ray sources (ULXs), and hence a wide range of luminosities is expected. We also expect a random sampling in terms of morphological type, but to check whether a bias exists, in Figure 1 we compare the distribution of -types of the parent sample of barred galaxies to the Chandra sample, finding that both distributions roughly agree with each other and no significant bias should be present.
3. X-ray Data Analysis
The retrieved Chandra/ACIS level 2 event files were processed and analyzed uniformly using the Chandra Interactive Analysis of Observations (CIAO) v4.3, following the reduction procedure described in González-Martín et al. (2006). We reprocessed each observation to account for possible background flares that could incorrectly enhance the count rate of our sources using the task lc_clean.sl. To identify the extraction regions in the ACIS images, we used the positions from the Two Micron All Sky Survey (2MASS; Skrutskie et al., 2006) for all galaxies in our sample except for NGC 5964, for which we use the position from Leon & Verdes-Montenegro (2003).
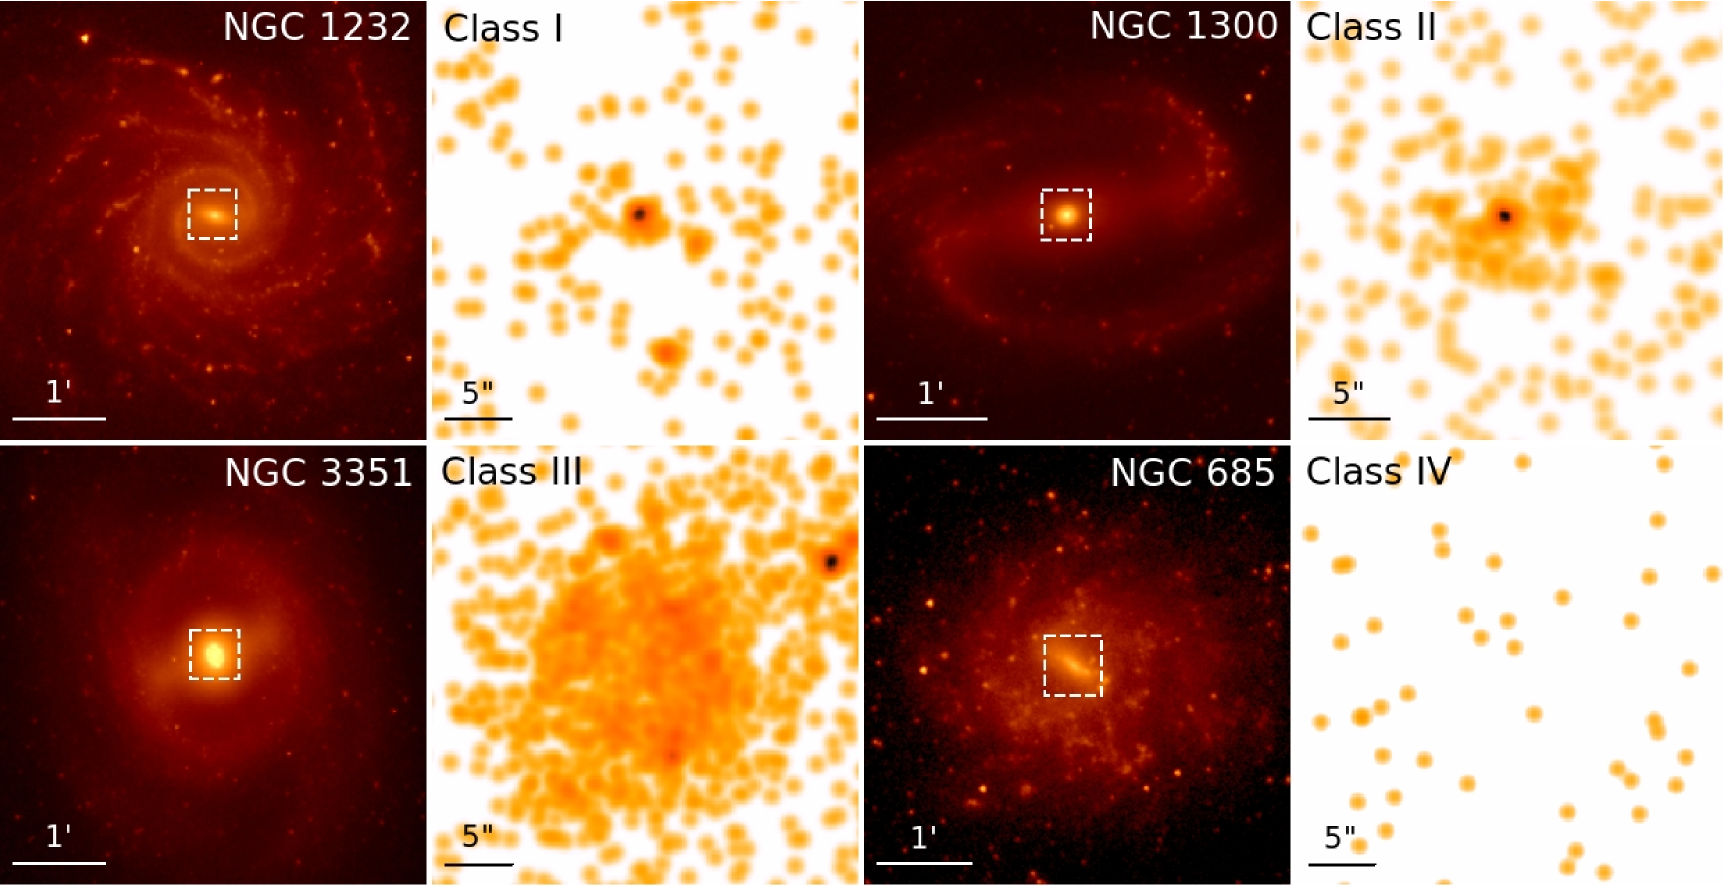
Defining the source and background regions will depend on the morphology of the X-ray emission in the nuclear region. Following the classification from Zhang et al. (2009), we group the nuclear morphologies into four distinct classes: (I) a dominant point source, (II) a nuclear point source embedded in extended diffuse emission, (III) extended emission without a point source, and (IV) no nuclear source or diffuse emission present above the background level. In Figure 2 we give representative examples of these four classes.
For class I nuclei, we defined the source region as a 2′′ radius circular aperture. The background region was defined as a source-free circular annulus around the nuclear position, or alternatively, as several circular apertures if other point-like sources were present in the vicinity. In the case of class II nuclei, source regions were defined as 1.5–2′′ radius apertures depending on the extension of the surrounding diffuse emission. We carefully defined the background to correctly characterize the spatial variations of the diffuse emission in which the nuclear source is embedded. For classes III and IV, in which there is no distinct point source, we derive upper limits on the nuclear source by considering the background-subtracted counts within a 2′′ aperture at the photometric center. In a few cases with class IV nuclei and low exposure times, no counts were detected with the standard aperture size and hence larger apertures of up to 5′′ were required to compute upper limits.
3.1. X-ray Luminosities
For all but nine sources (see below) we estimate X-ray luminosities in the hard 2–10 keV band (hereafter referred to as ) by using a single power law model with Galactic interstellar absorption obtained using the nH task included in FTOOLS (Kalberla et al., 2005; Dickey & Lockman, 1990). We assumed a typical photon index for low luminosity AGNs of (Ho et al., 2001), which has been shown to derive reliable luminosities when compared against results from a dedicated spectral fitting (González-Martín et al., 2006). All parameters are held fixed expect for the power-law normalization, which is found by fitting the aforementioned model using XSPEC v12.7.0 (Arnaud, 1996).
Nine sources in our sample present more than 200 net counts and allow for a detailed characterization of their spectra. For these objects, we perform a spectral analysis using XSPEC following the approach by González-Martín et al. (2009), in which an ensemble of models including both thermal and non-thermal components is used to better dissect the true nature of our sources contributing to the observed nuclear emission. Details on the modeling and results from the spectral fitting are presented in the Appendix, and the resulting 2–10 keV X-ray luminosities for the whole sample are presented in Table 1.
| Galaxy | Ref. | log | log | |||||
|---|---|---|---|---|---|---|---|---|
| (km s-1) | (AB) | () | ||||||
| (1) | (2) | (3) | (4) | (5) | (6) | (7) | ||
| NGC 255 | .. | . | … | -19.26 | 0.00 | … | … | |
| NGC 685 | .. | . | … | -19.36 | 0.00 | … | … | |
| NGC 1036 | .. | . | … | -17.20 | 0.00 | … | … | |
| NGC 1073 | 24. | 7 | 1 | -19.62 | 0.00 | 4.3 | -2.9 | |
| NGC 1097 | 196. | 0 | 2 | -22.74 | 0.24 | 8.1 | -4.2 | |
| NGC 1232 | .. | . | … | -21.50 | 0.04 | 6.9 | -5.3 | |
| NGC 1291 | 186. | 0 | 3 | -21.46 | 0.38 | 8.0 | -5.8 | |
| NGC 1300 | .. | . | … | -21.06 | 0.11 | 7.8a | -6.2 | |
| NGC 1302 | 158. | 0 | 3 | -21.06 | 0.39 | 7.7 | -7.3 | |
| NGC 1341 | 80. | 4 | 4 | -18.95 | 0.00 | 6.4 | -7.5 | |
| NGC 1367 | .. | . | … | -21.47 | 0.13 | 7.4 | -3.6 | |
| NGC 1493 | 25. | 0b | 5 | -18.82 | 0.00 | 4.3 | -2.8 | |
| NGC 1637 | .. | . | … | -19.52 | 0.12 | 6.6 | -5.4 | |
| NGC 1640 | .. | . | … | -20.03 | 0.25 | 7.1 | -5.4 | |
| NGC 1672 | 110. | 0 | 6 | -21.45 | 0.28 | 7.0 | -5.6 | |
| NGC 2787 | .. | . | … | -20.06 | 0.42 | 7.6c | -4.5 | |
| NGC 3344 | 73. | 5 | 1 | -18.90 | 0.06 | 6.3 | -5.3 | |
| NGC 3351 | 119. | 9 | 1 | -20.82 | 0.19 | 7.2 | -6.8 | |
| NGC 3368 | .. | . | … | -21.33 | 0.29 | 6.9d | -7.5 | |
| NGC 3627 | 124. | 0 | 1 | -21.66 | 0.12 | 7.2 | -6.4 | |
| NGC 4136 | 38. | 4 | 1 | -18.15 | 0.03 | 5.1 | -4.7 | |
| NGC 4245 | 82. | 6 | 1 | -19.03 | 0.36 | 6.5 | -5.2 | |
| NGC 4303 | 84. | 0 | 1 | -21.53 | 0.09 | 6.5 | -4.7 | |
| NGC 4314 | 117. | 0 | 1 | -19.86 | 0.33 | 7.1 | -6.2 | |
| NGC 4394 | 115. | 5 | 1 | -20.44 | 0.26 | 7.1 | -7.9 | |
| NGC 4450 | 135. | 0 | 1 | -21.32 | 0.16 | 7.4 | -4.1 | |
| NGC 4548 | 113. | 4 | 1 | -21.31 | 0.25 | 7.1 | -5.4 | |
| NGC 4579 | 165. | 0 | 1 | -22.32 | 0.17 | 7.8 | -3.3 | |
| NGC 4596 | .. | . | … | -21.19 | 0.28 | 7.9c | -6.6 | |
| NGC 4639 | 96. | 0 | 1 | -20.40 | 0.17 | 6.8 | -1.7 | |
| NGC 4713 | 23. | 2 | 1 | -19.24 | 0.00 | 4.2 | -2.8 | |
| NGC 4725 | 140. | 0 | 1 | -21.73 | 0.19 | 7.5 | -3.3 | |
| NGC 5350 | .. | . | … | -21.09 | 0.07 | 7.0 | -5.1 | |
| NGC 5371 | 179. | 8 | 1 | -22.00 | 0.12 | 7.9 | -5.7 | |
| NGC 5584 | .. | . | … | -20.27 | 0.00 | … | … | |
| NGC 5728 | 209. | 0 | 3 | -21.76 | 0.28 | 8.2 | -5.0 | |
| NGC 5964 | .. | . | … | -20.27 | 0.00 | … | … | |
| NGC 7479 | 154. | 6 | 1 | -22.30 | 0.12 | 7.7 | -5.6 | |
| NGC 7552 | 104. | 0 | 7 | -21.31 | 0.37 | 6.9 | -4.8 | |
| NGC 7743 | 89. | 3 | 1 | -20.47 | 0.31 | 6.6 | -5.2 | |
| PGC 3853 | .. | . | … | -18.93 | 0.00 | … | … | |
Note. — Column (1): galaxy name; Column (2): central stellar velocity dispersion; Column (3): Reference for either or : (1) Ho et al. (2009); (2) Lewis & Eracleous (2006); (3) McElroy (1995); (4) Wegner et al. (2003); (5) Walcher et al. (2005); (6) Garcia-Rissmann et al. (2005) (7) Oliva et al. (1995). Column (4): absolute magnitude from Muñoz-Mateos et al. (2013); Column (5): bulge-to-total light ratio; Column (6): BH mass derived using the – relation from equation (1), or if noted, direct BH mass measurement; Column (7): Eddington ratio.
a Direct measurement from gas kinematics (Atkinson et al., 2005).
b Velocity dispersion of the nuclear star cluster.
c Direct measurement from gas kinematics (Sarzi et al., 2001).
d Direct measurement from stellar kinematics (Nowak et al., 2010).

3.2. Eddington Ratios
While the X-ray luminosity attributed to the BH feeding process is a good proxy of the degree of nuclear activity, a clearer picture of the actual level of accretion will come from the Eddington ratio (), where and correspond to the bolometric and Eddington luminosities respectively. The X-ray bolometric correction, , has been found to depend strongly on Eddington ratio (Vasudevan & Fabian, 2007), with LLAGNs and their modest accretion rates requiring lower correction values when compared to higher-luminosity AGNs and quasars. While the Eddington ratios of LLAGNs span over six orders of magnitude (–) and adopting a single bolometric correction might seem too simplistic, the strongest dependence between these two quantities starts above , below which the behavior of the bolometric correction is rather flat. Therefore, we use =15.8 from Ho (2009), derived from a sample of nearby LLAGNs with robust spectral energy distributions.
The Eddington luminosity will normalize the X-ray luminosities by BH mass and it is defined as erg s-1. Only four galaxies from our sample (NGC 1300, NGC 2787, NGC 3368, and NGC 4596) have direct measurements derived either from stellar or gas kinematics. For the remaining galaxies of the sample, it is possible to predict their BH masses through the empirical scaling relations between and galaxy properties such as bulge luminosity (Kormendy & Richstone, 1995; Magorrian et al., 1998), central stellar velocity dispersion (Ferrarese & Merritt, 2000; Gebhardt et al., 2000; Tremaine et al., 2002), and bulge stellar mass (Marconi & Hunt, 2003; Häring & Rix, 2004). Among these, the correlation between BH mass and central stellar velocity dispersion () has been found to be the most significant one (Gebhardt et al., 2003). Twenty-six of the remaining galaxies have available measurements from the literature, allowing us to apply the – relation under the assumption that it holds true for the galaxies probed in the present study222We caution that it is still under debate whether the – holds universally other than for classical bulges and elliptical galaxies (e.g., Kormendy & Ho, 2013).. Since the establishment of this scaling relation, the number of measurements has been substantially expanded, and hence we opt to use the updated relation from Gültekin et al. (2009), given by:
| (1) |
For the rest of our sample lacking measurements, BH masses can be predicted by employing the correlation with bulge luminosity at 3.6 m () obtained by Sani et al. (2011):
| (2) |
Bulge luminosities in solar units at 3.6 m are derived using the bulge-to-total light ratios () from the two-dimensional image decomposition (see section 4.1 for details) together with the 3.6 m absolute magnitude of the galaxies (Muñoz-Mateos et al., 2013). To estimate luminosities in solar units, we use the 3.6 m solar absolute magnitude value of derived by Oh et al. (2008). Within these galaxies, six were best-modeled without a bulge component (), making it not possible to estimate their through this method, yet all of them had class IV nuclei, i.e., no X-ray nuclear source.
Both – and – relations used here have an intrinsic scatter of 0.4 dex, being the dominant source of uncertainty in our estimates. We assess the consistency of both methods at predicting BH masses through a direct comparison: in Figure 3, we plot estimates using both methods on 22 galaxies with measurements as well as . In the figure, the solid line indicates the exact correspondence between both methods, and the dashed lines mark the 0.4 dex intrinsic scatter from the scaling relations. The bulk of the galaxies obey the relation within the uncertainties, and derived from bulge luminosities are, on average, 0.1 dex higher than those from . This is particularly interesting, as it has been argued that barred galaxies appear systematically offset -0.5 dex from the – relation (Graham, 2008; Gadotti & Kauffmann, 2009) and hence these BH masses could be overestimated. At least for the galaxies probed here, this effect is not observed, and both methods can be considered consistent within the scatter. The resulting BH masses and corresponding Eddington ratios, along with the relevant parameters used for their calculation, are presented Table 2.
4. Quantifying bar strength
Stellar bars come in very different shapes and sizes, and therefore it would be unfair to simply categorize them as a single group. Bars have different strengths which will determine how efficiently they can drive the interstellar medium to central regions of the galaxy. As bars evolve with time, their pattern speeds slow down, allowing them to become more elongated and eccentric, and therefore stronger (for a review, see Athanassoula, 2012). While the pattern speed of bars is difficult to measure, their structure can be quantified from two-dimensional image modeling of the galaxy components. A different approach comes from quantifying the gravitational torques due to non-axisymmetric structures (e.g., Stark, 1977; Combes & Sanders, 1981; Zaritsky & Lo, 1986). Given that the NIR imaging mostly probes old stars (and hence stellar mass), one can infer the gravitational potential from the bar without the need of defining its structure. Below we describe and apply these two independent approaches at quantifying bar strength: one based on its structure and the other on its gravitational potential.
| Galaxy | |||||
|---|---|---|---|---|---|
| (1) | (2) | (3) | (4) | ||
| NGC 255 | 0.60 | 0.02 | 2.64 | 0.18 | |
| NGC 685 | 0.63 | 0.02 | 2.75 | 0.61 | |
| NGC 1036 | 0.37 | 0.01 | 2.66 | 0.20 | |
| NGC 1073 | 0.72 | 0.01 | 2.78 | 0.55 | |
| NGC 1097 | 0.45 | 0.09 | 2.77 | 1.19 | |
| NGC 1232 | 0.35 | 0.01 | 2.76 | 1.07 | |
| NGC 1291 | 0.64 | 0.01 | 2.78 | 0.01 | |
| NGC 1300 | 0.75 | 0.01 | 3.16 | 0.20 | |
| NGC 1302 | 0.48 | 0.01 | 2.81 | 0.01 | |
| NGC 1341 | 0.61 | 0.01 | 3.00 | 0.51 | |
| NGC 1367 | 0.54 | 0.01 | 2.72 | 0.28 | |
| NGC 1493 | 0.63 | 0.03 | 2.64 | 0.75 | |
| NGC 1637 | 0.65 | 0.01 | 2.73 | 0.12 | |
| NGC 1640 | 0.65 | 0.01 | 2.92 | 0.28 | |
| NGC 1672 | 0.63 | 0.09 | 3.90 | 2.17 | |
| NGC 2787 | 0.69 | 0.01 | 2.77 | 0.32 | |
| NGC 3344 | 0.46 | 0.03 | 2.63 | 0.62 | |
| NGC 3351 | 0.70 | 0.02 | 2.95 | 0.33 | |
| NGC 3368 | 0.51 | 0.01 | 2.51 | 0.29 | |
| NGC 3627 | 0.67 | 0.05 | 2.99 | 1.14 | |
| NGC 4136 | 0.68 | 0.05 | 2.95 | 0.77 | |
| NGC 4245 | 0.62 | 0.02 | 2.83 | 0.20 | |
| NGC 4303 | 0.57 | 0.02 | 3.12 | 0.17 | |
| NGC 4314 | 0.75 | 0.01 | 2.76 | 0.13 | |
| NGC 4394 | 0.62 | 0.02 | 2.85 | 0.45 | |
| NGC 4450 | 0.34 | 0.01 | 3.10 | 0.15 | |
| NGC 4548 | 0.68 | 0.06 | 2.87 | 0.97 | |
| NGC 4579 | 0.49 | 0.10 | 2.68 | 1.26 | |
| NGC 4596 | 0.68 | 0.01 | 2.78 | 0.41 | |
| NGC 4639 | 0.60 | 0.01 | 2.94 | 0.11 | |
| NGC 4713 | 0.15 | 0.04 | 2.78 | 0.48 | |
| NGC 4725 | 0.54 | 0.09 | 3.00 | 1.74 | |
| NGC 5350 | 0.70 | 0.01 | 2.71 | 0.33 | |
| NGC 5371 | 0.58 | 0.05 | 2.97 | 0.24 | |
| NGC 5584 | 0.61 | 0.01 | 2.71 | 0.25 | |
| NGC 5728 | 0.51 | 0.02 | 2.93 | 0.52 | |
| NGC 5964 | 0.55 | 0.01 | 3.04 | 0.38 | |
| NGC 7479 | 0.68 | 0.01 | 2.80 | 0.43 | |
| NGC 7552 | 0.64 | 0.01 | 2.60 | 0.07 | |
| NGC 7743 | 0.54 | 0.04 | 2.68 | 0.81 | |
| PGC 3853 | 0.63 | 0.04 | 2.78 | 0.68 | |
Note. — Column (1): galaxy name; Column (2): deprojected bar ellipticity; Column (3): bar boxiness; Column (4): maximum relative torque.
4.1. Bar Structure: Ellipticity and Boxiness
Suggested early on by analytical models as a fundamental parameter describing a barred galaxy and its dynamical evolution (Athanassoula, 1992a), the deprojected bar ellipticity was proposed by Martin (1995) as quantifiable measure of bar strength, in the sense that the smaller the axial ratio, the stronger the non-axisymmetric force the bar will be able to exert. Interestingly, Martin found that for a small sample of galaxies with nuclear starbursts, the majority were hosted by galaxies with highly eccentric bars. Bar ellipticity has been widely used in the literature (e.g., Rozas et al., 1998; Abraham et al., 1999; Aguerri, 1999; Knapen et al., 2000; Shlosman et al., 2000; Laine et al., 2002; Gadotti, 2011; Wang et al., 2012) and has the advantage of being readily available from photometric images and is independent on assumptions of the galaxy’s physical properties. Additionally, N-body simulations have shown that as a bar grows stronger, it does not only get more eccentric but also more boxy in shape (Athanassoula & Misiriotis, 2002). This was observed by Gadotti (2011) who found that bar ellipticity and boxiness were correlated, and defined their product as a proxy for bar strength.
In this paper, we use the structural parameters derived for the parent sample of S4G barred galaxies to be presented in detail in T. Kim et al. (in preparation). The two-dimensional image decomposition code BUDDA (de Souza et al., 2004; Gadotti, 2008) was used to model the galaxies: three components, described by concentric ellipses, were used to represent the bulge, disk, and bar. When necessary, a central point source component was included to account for a bright AGN or nuclear star cluster. In some cases, nuclear rings were masked and disk breaks, i.e., disk light profiles with two slopes, were accounted for. The careful procedures adopted assure that the structural properties of the bar are always accurately measured. The structural parameters of interest are derived from the equation of a generalized ellipse (Athanassoula et al., 1990):
| (3) |
where and are the pixel coordinates, and are the semimajor- and semiminor-axes respectively, and the exponent describes the bar boxiness: if , the bar is boxy, the bar is disky, and if the shape of bar is a perfect ellipse. The observed ellipticity of the bar, defined as , is deprojected following the analytical expressions from Gadotti et al. (2007). The boxiness parameter is kept fixed at for the bulge and disk components, which are thus always described using perfect ellipses. In terms of surface brightness, we model the disk with an exponential profile (Freeman, 1970) allowing the disk to have a break. Both bulge and bar were modeled using a Sérsic (1968) profile.
The resulting deprojected ellipticity and boxiness measurements are presented in Table 3.
4.2. Gravitational Torques
Proposed by Combes & Sanders (1981), a more sophisticated approach at measuring bar strengths comes from directly estimating tangential forces in the bar region and comparing them to the axisymmetric potential of the disk. This force ratio represents a measure of the bar-induced gravitational torque, and it is defined as:
| (4) |
where, at a given radius , corresponds to the maximum amplitude of the tangential force and is the mean axisymmetric radial force at that radial distance. The force ratio parameter varies with radius, and in order to implement a single measure of bar strength for the whole galaxy, is adopted as the maximum value of at the bar region. Based on the practical implementation of the gravitational torque method by Quillen et al. (1994), Buta & Block (2001) measured the force ratio parameter for 36 nearby spiral galaxies from NIR images. They found that galaxies categorized from their apparent bar strength through the de Vaucouleurs (1959) classification scheme could have a wide range of true bar strengths. From hydrodynamic simulations, it has been shown that is directly related to the bar-driven mass inflow rate (Kim et al., 2012), making it a highly relevant parameter when studying the impact of bar strength on nuclear activity.
For this study, we use the bar strength measurements to be presented in detail by Simón Díaz-García et al. (in preparation), who compute non-axisymmetric forces on an extended sample of S4G spiral galaxies. The calculations are performed with the polar grid method, also accounting for artificial bulge stretch due to deprojection (see Salo et al., 2010). Gravitational potentials were inferred under two main assumptions: (1) 3.6 m light traces stellar mass with a constant mass-to-light ratio333This assumption has been shown to be fairly reasonable (Eskew et al., 2012), although see Meidt et al. (2012) for a careful treatment of the separation of old stellar light in 3.6 m images from the emission of polycyclic aromatic hydrocarbons, hot dust, and young stars., and (2) the vertical scale height of the disk, , scales with the disk size as (Speltincx et al., 2008), where is the K-band surface brightness isophote of 20 mag arcsec-2 from 2MASS. For further technical details on the method, see, e.g., Buta et al. (2004); Laurikainen et al. (2004a, b). The resulting measurements for our sample are presented in Table 3.
5. Results
5.1. Nuclear X-ray Sources
Out of the 41 galaxies analyzed, we detected X-ray nuclear point-like sources (classes I and II as described in Section 3) in 31 of them. Within these, nine have been previously classified as Seyferts, six as low-ionization nuclear emission line regions (LINERs), and one as an H ii nucleus, as indicated in Table 1. None of the galaxies without a nuclear detection (classes III and IV) has been previously classified as active based on optical diagnostics.
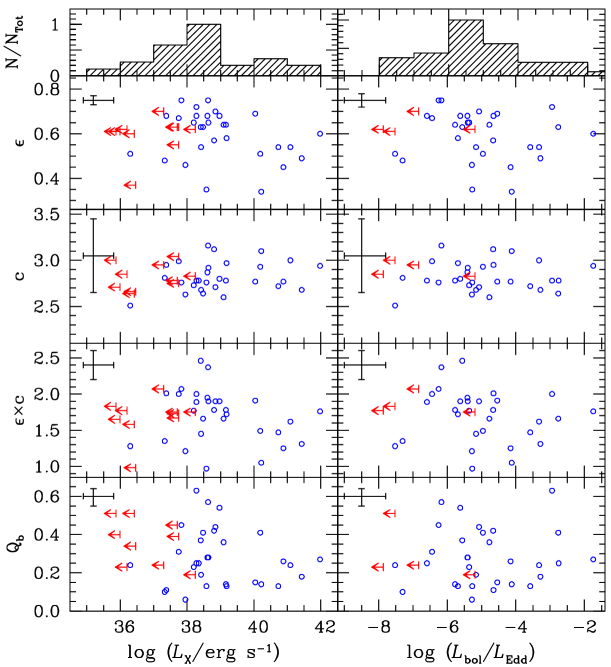
The distributions of X-ray luminosities and Eddington ratios are shown in the top panels of Figure 4. For both quantities, our sample as a whole spans around six orders of magnitude in agreement with previous studies of X-ray nuclear activity in nearby galaxies (e.g., Zhang et al., 2009; Ho, 2009), with a median = erg s-1 and a median / = . If we consider only those galaxies with nuclear detections (classes I and II), the median values are = erg s-1 and / = , consistent with the median values of the AGN sample from the Palomar Survey reported by Ho (2009).
A caveat concerning X-ray studies of low-luminosity AGNs lies in the possibility that these nuclear X-ray point-sources could not necessarily be accreting BHs. Possible confusion with other sources such as low-mass X-ray binaries (LMXBs) has been discussed extensively in the literature, and different arguments have been invoked in favor of the AGN nature of nuclear point-like sources coincident with the independently determined center (e.g., Gallo et al., 2008; Desroches & Ho, 2009; Zhang et al., 2009; Grier et al., 2011; Jenkins et al., 2011). Perhaps one of the most compelling arguments comes from the probability to get an X-ray binary precisely at the nuclear position: based on the LMXB population study by Gilfanov (2004), the analyses by Gallo et al. (2008) and Zhang et al. (2009) estimate of the order of 10-2 LMXBs brighter than 1038 erg s-1 within an aperture of the size of the Chandra PSF. Together with the excellent agreement between the nuclear and NIR position, comparable to their astrometric uncertainties of 1″, as well as the lack of other point-like X-ray sources in the immediate vicinity (5″) for the vast majority of our sample, the existence of any significant contamination from LMXBs can be likely ruled out.
5.2. Bar Strength Versus Nuclear Activity
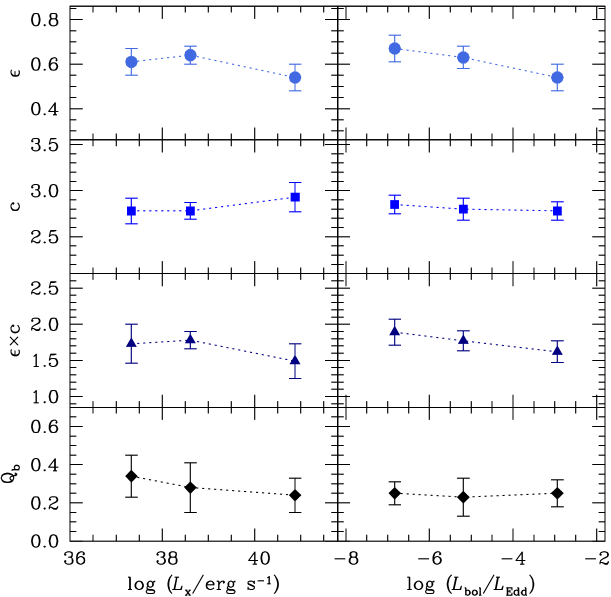
In Figure 4, we plot the different measurements of bar strength against nuclear activity as described in the previous sections. Deprojected ellipticity , boxiness , their product , and gravitational torque parameter are shown from top to bottom; on the left-side panels against 2–10 keV X-ray luminosity , and on the right-side panels against Eddington ratio /. One can immediately observe that no clear correlations are present: for any given luminosity or Eddington ratio there is a wide range of possible bar strengths, as quantified through the four methods presented before. To better explore possible trends in our sample, a more practical representation of our results is shown in Figure 5. Here, we plot the median of each bar strength indicator versus AGN activity, binning our sample in both X-ray luminosity and Eddington ratio with boundaries at = 1038, 1040 erg s-1 and / = 10-6, 10-4 respectively. In this plot, the lack of any relevant positive trend between bar strength and AGN activity is even more evident. On the contrary, in a few cases there seems to be a negative trend of bar strength with increasing AGN luminosity or accretion rate, yet the large dispersions cast doubt on their significance.
| All galaxies | Classes I+II | “Faint” ( -20.82) | “Bright” ( -20.82) | |||||||||
|---|---|---|---|---|---|---|---|---|---|---|---|---|
| Significance | Significance | Significance | Significance | |||||||||
| vs | ||||||||||||
| -0.11 | 0.51 | -0.20 | 0.28 | 0.16 | 0.50 | -0.36 | 0.11 | |||||
| 0.12 | 0.44 | 0.14 | 0.45 | -0.02 | 0.93 | -0.08 | 0.72 | |||||
| -0.10 | 0.54 | -0.21 | 0.25 | 0.09 | 0.72 | -0.40 | 0.07 | |||||
| -0.19 | 0.24 | 0.01 | 0.97 | -0.31 | 0.18 | -0.09 | 0.70 | |||||
| vs | ||||||||||||
| -0.28 | 0.11 | -0.28 | 0.13 | -0.15 | 0.60 | -0.42 | 0.06 | |||||
| -0.17 | 0.33 | -0.08 | 0.65 | -0.13 | 0.67 | -0.06 | 0.78 | |||||
| -0.34 | 0.04 | -0.31 | 0.09 | -0.30 | 0.30 | -0.40 | 0.07 | |||||
| -0.03 | 0.87 | 0.00 | 1.00 | -0.04 | 0.89 | 0.00 | 0.98 | |||||
| “Early” (-type 3.1) | “Late” (-type 3.1) | “Bulgy” ( 0.13) | “Disky” ( 0.13) | |||||||||
| Significance | Significance | Significance | Significance | |||||||||
| vs | ||||||||||||
| -0.37 | 0.10 | 0.15 | 0.51 | -0.35 | 0.14 | 0.05 | 0.82 | |||||
| 0.09 | 0.71 | 0.21 | 0.37 | 0.15 | 0.52 | 0.14 | 0.54 | |||||
| -0.34 | 0.13 | 0.17 | 0.48 | -0.32 | 0.16 | 0.06 | 0.79 | |||||
| -0.06 | 0.79 | -0.02 | 0.94 | 0.00 | 0.99 | -0.11 | 0.62 | |||||
| vs | ||||||||||||
| -0.36 | 0.11 | -0.17 | 0.55 | -0.35 | 0.13 | -0.23 | 0.40 | |||||
| 0.04 | 0.85 | -0.48 | 0.08 | 0.12 | 0.63 | -0.50 | 0.06 | |||||
| -0.36 | 0.11 | -0.31 | 0.27 | -0.35 | 0.13 | -0.36 | 0.18 | |||||
| -0.08 | 0.74 | -0.12 | 0.69 | 0.00 | 0.99 | -0.14 | 0.62 | |||||
Note. — Spearman’s rank correlation coefficient and its significance are measured for the whole sample as well as for subsamples excluding upper limits, and divided according to the median 3.6 m absolute magnitude, morphological -type, and bulge-to-total light ratio of the sample: -20.82 (or ), -type = 3.1, and = 0.13 respectively. When a perfect correlation (or anticorrelation) occurs, adopts 1 (or -1), whereas if no correlation is present. The significance of the correlation is a value within [0,1], and should be consistent with zero in case of a significant correlation.
To quantitatively investigate whether any of these trends are significant and could reveal a link between bar strength and nuclear activity, we test the dependence between X-ray luminosity and Eddington ratio against the different bar strength proxies using Spearman’s rank correlation. Besides performing this statistical test for our entire sample, we also test for correlations excluding galaxies with nuclear classes III or IV: even though we are operating under the assumption that all of these galaxies have a BH at their centers, we account for the possibility that the lack of detection in those cases for which we present upper limits may be due to the lack of a BH. In such a case, these galaxies should not be part of the correlation and might be affecting the overall result. Therefore, we test this possibility by performing the correlation test only on those galaxies with nuclear detections (classes I and II). Additionally, we test whether any correlation shows up when probing different subsamples based on luminosity, morphological -type, and bulge-to-total light ratio cuts at their respective median values. The effect of bar strength on nuclear activity in different galaxy luminosity –and hence stellar mass– regimes is tested by defining “Faint” and “Bright” subsamples based on a luminosity cut at =-20.82, which corresponds to following the conversion presented in the Appendix of Muñoz-Mateos et al. (2013); “Early” and “Late” morphological subsamples are defined dividing at -type = 3.1; and “Bulgy” and “Disky” subsamples based on the bulge-to-total light ratio from the image decomposition are defined by a cut at = 0.13.
In Table 4, we show the Spearman’s rank correlation coefficient and its significance for every combination of bar strength and AGN activity measurement for the eight samples analyzed, i.e., whole sample, galaxies with nuclear X-ray point source, and subsamples divided by 3.6 m absolute magnitude, morphological -type, and bulge-to-total light ratio. No significant correlation is obtained in any of the subsamples. The Spearman’s coefficient and significance values for the whole sample reflect the trends shown in Figure 5, and no major changes happen by excluding upper limits from the analysis. Dividing the sample of galaxies by their 3.6 m absolute magnitude does not particularly change the trends, yet it strengthens the, albeit still not significant, anticorrelation between and AGN activity as traced by both X-ray luminosity and Eddington ratio for the more luminous, massive end of our sample. As one could expect from the correspondence between Hubble type and bulge extent relative to the galaxy, both pairs of subsamples, “Early”/“Bulgy” and “Late”/“Disky” show a very good agreement in terms of their correlation scores. However, no significant correlation shows up in neither of them, suggesting that the presence or absence of a significant bulge component does not affect the influence of the stellar bar on the nuclear fueling. This is particularly interesting for the case of , which is directly affected by the bulge: the relative torque parameter is diluted in the presence of a stronger axisymmetric component, i.e., a more massive bulge. Therefore, if there was a direct connection between the non-axisymmetric gravitational potential from the stellar bar and the level of AGN activity, one would have expected to see it at least in the subsample of galaxies with less massive bulges.
In summary, no significant correlation is found for any of the subsamples probed, and therefore our analysis indicates an independence between bar strength and degree of nuclear activity irrespective of galaxy luminosity, stellar mass, morphology, or bulge relative size.
6. Discussion
From the point of view of both, simulations and observations, stellar bars have been shown to be able to drive material toward the central regions of a galaxy. The notion that bars are also able to feed a BH however, has not been supported by empirical results. Most studies investigating whether bars had any impact on AGN activity did so by measuring bar fractions among samples of active and inactive galaxies, or alternatively, by measuring the AGN fraction between barred and unbarred galaxies. Since bars have a wide range of strengths, and AGN activity has a continuous distribution in luminosity and mass accretion rate spanning a few orders of magnitude, perhaps most previous attempts at connecting bars and AGN oversimplified on their approach by discretizing these quantities. Among the few studies taking this into account, Ho et al. (1997b) investigated AGN luminosity distributions, as traced by the nuclear H emission, on barred and unbarred galaxies finding that the presence of a bar had no influence on the observed nuclear luminosity. On the other hand, Laurikainen et al. (2002, 2004a) quantified bar strengths using the gravitational torque parameter for samples of barred active and non-active galaxies and found no evidence that would suggest that stronger bars, as traced by , tend to favor AGN host galaxies. In fact, they found weaker values among active galaxies against their inactive counterparts, yet they highlight that this is a side-effect of being tied to Hubble type, in the sense that a more massive bulge relative to the disk will induce a stronger axisymmetric potential, washing out the bar-induced torque. Therefore, early-type spirals, where the optically classified AGNs analyzed in these studies were preferentially found, will have intrinsically weak bars according to . The inverse effect was observed by Laurikainen et al. (2004a) when comparing Fourier amplitude of density of the bar, in the sense that early-type spirals have larger values when compared to later-types, in which inactive galaxies were mostly found. Both effects, however, go away if Hubble-type is kept fixed, with active and inactive galaxies showing comparable values of these bar strength indices.
In the context of BH accretion rates, Crenshaw et al. (2003) compared the fraction of bars between two subclasses of active galaxies: narrow-line and broad-line Seyfert 1s (NLS1s and BLS1s respectively). At a fixed luminosity, the former have lower-mass BHs compared to the latter, and given their near-Eddington accretion rates, NLS1s are thought to be AGNs in an early stage of their activity (Mathur, 2000). Additionally, NLS1s tend to host pseudo-bulges (Orban de Xivry et al., 2011; Mathur et al., 2012), making them ideal test-cases for the study of secular processes driving the evolution of galaxy and BH. Crenshaw et al. found that bars are indeed more frequent in NLS1s, suggesting a scenario in which their higher accretion rates are related to the bar-induced fueling. Other studies have tackled the impact of bars on the Eddington ratio using large samples of galaxies from the Sloan Digital Sky Survey (York et al., 2000) with mixed results: while Alonso et al. (2013) argue that barred active galaxies show higher mean accretion rates against their unbarred counterparts, Lee et al. (2012) found that both barred and unbarred active galaxies have consistent Eddington ratio distributions.
A connection between AGN activity and host galaxy on kiloparsec scales has been pursued not only from the point of view of stellar bars, but also from the perspective of the kinematics of the galaxy. On a comparison between the stellar and gaseous kinematics within the central kiloparsec of Seyfert and inactive galaxies, Dumas et al. (2007) found no remarkable differences on large scales, with both stars and gas showing regular rotation patterns and a general alignment with each other. On smaller scales however, within the inner few hundred parsecs, the ionized gaseous component of active galaxies is more disturbed compared to their inactive counterparts, leading to the reasonable conclusion that signatures of the ongoing BH feeding can only be found in the innermost regions of the galaxy.
In this respect, HST programs have targeted the nuclear regions of active galaxies to study their nuclear dust structure (e.g., Regan & Mulchaey, 1999; Martini & Pogge, 1999). The morphology of the circumnuclear dust can reveal whether the influence of the bar extends to the unresolved nucleus in the shape of straight dust lanes. Surprisingly, these studies found these signatures only in a minority of active galaxies, and found that another observed mechanism, nuclear dust spirals, might be responsible of driving the gas further down to parsec scales. Nevertheless, comparisons between the circumnuclear dust structure of active and inactive galaxies have shown that nuclear dust spirals are equally common on both samples, without a preference for active nuclei (Martini et al., 2003b), hinting at the possibility that the lifetime of AGN activity has to be less than the inflow time from these structures. Furthermore, there is no correlation between the structure of the circumnuclear dust and the strength of the stellar bar: Peeples & Martini (2006) found that strongly barred galaxies can have a wealth of nuclear dust morphologies, ranging from a clearly defined nuclear dust spiral to a chaotic structure unlikely to be able to drive material to the very central regions, suggesting that a strong bar does not necessarily imply an efficient nuclear fueling.
6.1. On the Stability of Bars
Based on the results presented here, nuclear luminosity and BH accretion rate are not influenced by the strength of the large-scale bar. Do our findings imply that bars play no role in driving the gas that would eventually fuel an AGN? The only safe conclusion one can draw from our results is that the current strength of the stellar bar has no impact on the level of co-occurrent AGN activity, and hence, if bars were to weaken over time while driving gas down to the galactic centers, we could be missing its true influence on nuclear activity.
Early simulations of the dynamical evolution of bars in galaxies suggested that bar-induced gas inflows initiate the growth of a central ( 250 pc) mass concentration, which in turn can dramatically decrease the strength of the bar: as the central mass increases it can significantly perturb and eventually destroy the orbital structure supporting the bar (Hasan & Norman, 1990; Pfenniger & Norman, 1990; Friedli & Benz, 1993). It has been argued, however, that the sole central concentration of mass is not enough to significantly weaken the bar unless its mass is a few percent of the disk mass (Shen & Sellwood, 2004; Athanassoula et al., 2005), which is inconsistent with BHs by at least one order of magnitude on the conservative side. On the other hand, models incorporating the gas response revealed that a frequently overlooked bar-weakening mechanism, namely the transfer of angular momentum between the stellar bar and the infalling gas, can have a significant impact on the bar dissolution, which can take 2 Gyr (Bournaud et al., 2005). Interestingly, Bournaud et al. also showed that a noticeable increase in the central mass only happens once the bar has significantly weakened. These results would imply that a bar-driven build-up of gas in the central regions of the galaxy can be hardly connected to the current strength of the bar. If said gas was eventually expected to reach and feed the central BH, then it would not surprising that our results show no relation between nuclear activity and the strength of the bar.
In the context of our findings, the above scenario would be particularly appealing. However, most recent simulations from various groups converge toward long-lived and stable bars. Models in which bars are destroyed tend to use rigid halos, not allowing for angular momentum redistribution which promotes bar growth (Athanassoula, 2002). When live halos are used, neither the central mass concentration nor the transfer of angular momentum from the gas to the stellar bar are able to significantly weaken them (Berentzen et al., 2007; Villa-Vargas et al., 2010; Kraljic et al., 2012; Athanassoula et al., 2013), and therefore bar weakening can be likely ruled out as the cause of the disconnection between bar strength and ongoing nuclear activity.
6.2. Nuclear Bars and Nuclear Rings
Shlosman et al. (1989) proposed a cascade of instabilities in a galaxy as a possible way of fueling BH activity–the “bars within bars” scenario. Gas inflows driven by a large-scale bar would result in a circumnuclear gaseous disk, which could in turn suffer from further instabilities and form a randomly-oriented nested bar within the large-scale bar. This nuclear bar could drive gaseous material further down into the galactic nucleus and feed an AGN. HST observations of nearby Seyfert galaxies, however, have found nuclear bars in only a minority of them (Martini et al., 2001; Laine et al., 2002).
Nuclear rings can be found in around one fifth of barred galaxies (Comerón et al., 2010). They are thought to be signposts of inflowing gas slowing down near the inner Lindblad resonances (Simkin et al., 1980; Combes & Gerin, 1985; Knapen et al., 1995). Their relation to the fueling of nuclear activity could be twofold: as they trace a recent gas inflow to the nuclear regions, nuclear rings could be expected to be more common in active galaxies (e.g., Knapen, 2005), or alternatively, they could indicate that the bulk of the inflowing gas is piling up at the resonances, hindering further significant inflows to smaller scales beyond the nuclear ring (e.g., García-Burillo et al., 2005). The latest observational results show that the fraction of galaxies with nuclear rings that also exhibit nuclear activity is consistent with the overall fraction of active galaxies in the nearby universe (Comerón et al., 2010).
We check whether the degree of nuclear activity of those galaxies from our sample with either of these nuclear features differs from the average by resorting to the morphological classifications by Buta et al. (2010). In their study, a preliminary sample of roughly 10% of the S4G galaxies were classified using the de Vaucouleurs revised Hubble-Sandage system (de Vaucouleurs, 1959), which accounts for the presence of nuclear rings as well as nuclear bars among various other features. Currently, classifications exist for the bulk of the S4G sample (R. Buta, private communication), and hence we are able to assess whether the presence of any of these nuclear features makes a difference in the nuclear fueling. We complement the classifications with those in the catalogs on nuclear bars by Laine et al. (2002) and Erwin (2004), and on nuclear rings by Comerón et al. (2010).
In Table 1, we indicate which galaxies present nuclear bars and/or rings based on the classifications mentioned above. Only six galaxies in our sample have nuclear bars, with their median X-ray luminosities and Eddington ratios being = erg s-1 and / = respectively, meaning higher luminosities than the average, yet their accretion rates are similar to those of the parent sample. Their median morphological -type of 2.2 indicates a mild preference for earlier-types when compared to the parent sample. Hence, the detected nuclear bars are preferentially found in more massive, earlier-type spirals, implying more massive BHs which in turn accounts for the higher X-ray luminosities yet ordinary Eddington ratios.
Twelve galaxies in our sample feature nuclear rings, with a median -type of 2.9, typical for galaxies hosting nuclear rings (Comerón et al., 2010), and consistent with the parent sample. Their median X-ray luminosities and Eddington ratios are = erg s-1 and / = respectively, suggesting that the level of nuclear activity in galaxies those hosting nuclear rings is not different from those in the general population.
6.3. How to Sustain Low-luminosity AGN Activity
Early simulations suggested typical bar-driven gas inflow rates into the inner kiloparsec of the order of 0.1–10 yr-1 (Friedli & Benz, 1993). These numbers were empirically confirmed by Sakamoto et al. (1999), who estimated a lower limit for the inflow rate into the central kiloparsec of 0.1–1 yr-1 from their observations of molecular gas on nearby spiral galaxies. Down to smaller scales, the influence of the non-axisymmetric stellar potential on the gas content of nearby active galaxies has been observed to be efficient at driving the gas down to 100 parsec at rates of 0.01–50 yr-1 (García-Burillo et al., 2005; Haan et al., 2009). At these scales, these studies have observed that gas inflows are halted and gravity torques can be positive. From that point on, other competitive mechanisms such as viscous torques could be responsible of driving gas down to smaller scales and potentially reach the BH (e.g., Combes, 2001).
The mass accretion rates required to sustain typical low-luminosity AGNs, however, are minuscule in comparison to the previously mentioned bar-driven inflow rates: LLAGN activity is thought to be the product of BHs being fed through radiatively inefficient accretion flows (for a review, see Narayan & McClintock, 2008). In this model of mass accretion, for the typical bolometric luminosities and Eddington ratios of our sample, i.e., erg s-1 and respectively, Ho (2009) estimates mass accretion rates of the order of – yr-1. In the context of these extremely modest accretion rates, Ho (2009) argues that most galaxies have their innermost regions a readily available steady supply of fuel in the form of (1) stellar mass loss from evolved stars, and (2) Bondi accretion of hot gas. These fuel sources can exceed the estimated BH mass accretion rates by 2 orders of magnitude, and hence bar-driven gas inflows, while sufficient, might not be a necessary condition to sustain typical low-level AGN activity observed in the nearby universe and could account for the independence between nuclear activity and bar strength found in the present study.
7. Conclusions
In this work, we quantified both the bar strengths of a sample of 41 nearby barred galaxies from Spitzer/IRAC imaging, and the level of BH activity using Chandra/ACIS archival data. Based on the observational and theoretical evidence that bars drive material toward the central regions of a galaxy, our goal was to determine whether bar strength has an impact on the level of BH fueling by investigating possible correlations between different measures of bar strength and AGN activity. Our findings can be summarized as follows:
-
1.
We found a nuclear X-ray point source coincident with the NIR position in 31 out of 41 galaxies indicative of ongoing BH fueling. The median 2–10 keV X-ray luminosity and Eddington ratio of = erg s-1 and / = respectively are consistent with the levels of low-luminosity nuclear activity in the nearby universe (Ho, 2009). For those sources without detections, upper limits were derived.
-
2.
We estimated the strength of the stellar bar in two independent ways: from its structure, as traced by its ellipticity and boxiness, and from its maximum relative gravitational torque. No significant correlation was found between any of the bar strength proxies and the level of AGN activity: statistical tests on our sample did not reveal any significant trend between bar strength and BH fueling, irrespective of galaxy luminosity, stellar mass, Hubble type, or bulge size. This suggests that the strength the stellar bar, and therefore the extent of the bar-driven inflow, is not directly connected with the degree of ongoing BH fueling, at least for the low-luminosity regime probed here.
-
3.
We checked whether the presence of nuclear rings and/or nuclear bars had any impact on the ongoing BH fueling. We found that galaxies with nuclear rings show similar levels of nuclear activity compared to the parent sample, while galaxies with nuclear bars tend to have slightly higher luminosities yet ordinary Eddington ratios, mainly because they tend to be found in earlier-type galaxies with higher mass BHs.
-
4.
Assessing our findings in the broader context of previous results from the literature, we discuss possible scenarios concluding that (1) because strong bars are not necessarily related to more efficient BH fueling, the mechanisms responsible for LLAGN activity can not be traced on scales larger than a few hundred parsec; and (2) the mass accretion rates required to sustain LLAGN activity are minuscule in comparison to the observed bar-driven inflow rates, and therefore other sources readily available at the centers of most galaxies must provide a steady supply of fuel without the need of kiloparsec scale inflows.


Appendix A Spectral Modeling
For the nine sources in our sample with more than 200 net counts, we perform a spectral analysis using XSPEC v12.7.0 (Arnaud, 1996). The spectra were binned using the GRPPHA task included in FTOOLS so that each spectral bin had at least 20 counts, allowing us to use statistics to select a best fitting model. While a single power law model is a good representation of the AGN emission, bright sources with high count rates require a more detailed analysis in order to properly characterize their nature and disentangle additional components contributing to the observed emission, e.g., thermal plasma emission or a prominent iron line at 6.4 KeV. An ensemble of five models, as in González-Martín et al. (2009), is used to better represent the true nature of the emitting source. These correspond to: a power-law model (PL) with intrinsic absorption, accounting for non-thermal AGN emission; a single-temperature thermal plasma model (MEKAL) to account for emission from unresolved binaries or supernova remnants; a combined MEKAL+PL model in which the spectrum shows a contribution from both thermal and non-thermal emission mechanisms in the soft and hard X-rays respectively; a double power-law model (2PL), in which a second power law is used to account for possible AGN continuum emission scattered off the surrounding medium and showing up in the soft X-rays, with both described by the same spectral index; and a MEKAL+2PL model, similar as the previous one but adding a thermal component also at lower energies.
In order to choose the best model, we require the resulting parameters to have realistic values with a physical meaning, e.g., photon index = 0–3 for the PL and temperature = 0–2 keV for the MEKAL model. In the case that multiple models return reasonable parameters, preference is given to the simplest model (ie., the one with the least number of components) by checking that the quality of the fit does not improve significantly by adding additional components using the -test task within XSPEC. In order to discern between models with the same number of components, the one with the closest to unity is chosen. The best-fitting models together with their corresponding parameters are presented in Table 5; the spectra together with the chosen model are shown in Figure 6; and our findings are briefly discussed below:
| Galaxy | Model | |||||
|---|---|---|---|---|---|---|
| ( cm-2) | ( cm-2) | (keV) | ||||
| (1) | (2) | (3) | (4) | (5) | (6) | |
| NGC 1097 | PL | … | … | 0.96 | ||
| NGC 1291 | MEPL | 0.80 | ||||
| NGC 1367 | PL | … | … | 0.97 | ||
| NGC 2787 | PL | … | … | 1.13 | ||
| NGC 4450 | PL | … | … | 1.24 | ||
| NGC 4579 | 2PL | … | 1.40 | |||
| NGC 4639 | PL | … | … | 0.88 | ||
| NGC 4725 | PL | … | … | 0.98 | ||
| NGC 5728 | 2PL | … | 1.56 |
Note. — Column(1): galaxy name; Column (2): best-fitting model, in these cases either an absorbed power-law (PL) or a double power-law (2PL) model; Columns (3) and (4) : HI column densities of model components; Column (5): spectral photon index; Column (6): temperature of the thermal plasma; Column (7): reduced .
NGC 1367 - We report spectral modeling of the X-ray nuclear source in NGC 1367 for the first time, finding that its nuclear spectrum is best-fit by a single power-law with a rather hard photon index. Regarded as a non-active galaxy, it was observed with Chandra to study SN2005ke (Immler et al., 2006).
NGC 1097, NGC 2787, and NGC 4450 - The X-ray nuclei of these galaxies are best-fit by single power-law models characteristic of LLAGNs. Optically, the nuclei of these three galaxies have been found to belong to the LINER family by Phillips et al. (1984), Heckman et al. (1980), and Ho et al. (1997a) respectively, an indication of the likely non-thermal nature of the nuclear emission on this class of active nuclei.
NGC 1291 - The nucleus of this galaxy is a LINER as well (Smith et al., 2007), and is best-fit by a MEKAL+PL model, in which the thermal plasma component accounts for the soft X-ray excess. Model parameters are in agreement with the detailed study of the X-ray source population of this galaxy by Luo et al. (2012).
NGC 4579 - Similarly, NGC 4579 also features a LINER nucleus (Stauffer, 1982) which is best-fit by a 2PL model. Eracleous et al. (2002) modeled the nuclear X-ray source as a single unabsorbed power law, while González-Martín et al. (2009) find that the nuclear source is best-fit by a MEKAL+PL model. The main differences seem to arise in the soft X-ray part of the spectrum, and the 2–10 keV luminosities derived from these studies and ours agree among each other.
NGC 4639 and NGC 4725 - Both of these galaxies host Seyfert nuclei (Ho et al., 1997a) and are best-fit by single power-law models, in agreement with their known AGN nature.
NGC 5728 -
The X-ray nuclear source in NGC 5728 is best-fit by the 2PL model together with a Gaussian to account for the strong FeK feature at 6.4 KeV.
The hard power law shows an absorption two orders of magnitude larger when compared to the rest of the sources from our sample, and just at the limit for being considered Compton-thick, at cm-2.
This is in agreement with the value already reported by Comastri et al. (2010) from Suzaku observations.
References
- Abraham et al. (1999) Abraham, R. G., Merrifield, M. R., Ellis, R. S., Tanvir, N. R., & Brinchmann, J. 1999, MNRAS, 308, 569
- Aguerri (1999) Aguerri, J. A. L. 1999, A&A, 351, 43
- Alonso et al. (2013) Alonso, M. S., Coldwell, G., & Lambas, D. G. 2013, A&A, 549, A141
- Araya Salvo et al. (2012) Araya Salvo, C., Mathur, S., Ghosh, H., Fiore, F., & Ferrarese, L. 2012, ApJ, 757, 179
- Arnaud (1996) Arnaud, K. A. 1996, in Astronomical Society of the Pacific Conference Series, Vol. 101, Astronomical Data Analysis Software and Systems V, ed. G. H. Jacoby & J. Barnes, 17
- Arsenault (1989) Arsenault, R. 1989, A&A, 217, 66
- Athanassoula (1992a) Athanassoula, E. 1992a, MNRAS, 259, 328
- Athanassoula (1992b) —. 1992b, MNRAS, 259, 345
- Athanassoula (2002) —. 2002, ApJ, 569, L83
- Athanassoula (2012) —. 2012, ArXiv:1211.6752
- Athanassoula et al. (2005) Athanassoula, E., Lambert, J. C., & Dehnen, W. 2005, MNRAS, 363, 496
- Athanassoula et al. (2013) Athanassoula, E., Machado, R. E. G., & Rodionov, S. A. 2013, MNRAS, 429, 1949
- Athanassoula & Misiriotis (2002) Athanassoula, E., & Misiriotis, A. 2002, MNRAS, 330, 35
- Athanassoula et al. (1990) Athanassoula, E., Morin, S., Wozniak, H., Puy, D., Pierce, M. J., Lombard, J., & Bosma, A. 1990, MNRAS, 245, 130
- Atkinson et al. (2005) Atkinson, J. W., et al. 2005, MNRAS, 359, 504
- Bennert et al. (2011) Bennert, V. N., Auger, M. W., Treu, T., Woo, J.-H., & Malkan, M. A. 2011, ApJ, 742, 107
- Berentzen et al. (2007) Berentzen, I., Shlosman, I., Martinez-Valpuesta, I., & Heller, C. H. 2007, ApJ, 666, 189
- Bournaud et al. (2005) Bournaud, F., Combes, F., & Semelin, B. 2005, MNRAS, 364, L18
- Buta & Block (2001) Buta, R., & Block, D. L. 2001, ApJ, 550, 243
- Buta et al. (2004) Buta, R., Laurikainen, E., & Salo, H. 2004, AJ, 127, 279
- Buta et al. (2010) Buta, R. J., et al. 2010, ApJS, 190, 147
- Cisternas et al. (2011a) Cisternas, M., et al. 2011a, ApJ, 726, 57
- Cisternas et al. (2011b) —. 2011b, ApJ, 741, L11+
- Coelho & Gadotti (2011) Coelho, P., & Gadotti, D. A. 2011, ApJ, 743, L13
- Comastri et al. (2010) Comastri, A., Iwasawa, K., Gilli, R., Vignali, C., Ranalli, P., Matt, G., & Fiore, F. 2010, ApJ, 717, 787
- Combes (2001) Combes, F. 2001, in Advanced Lectures on the Starburst-AGN, ed. I. Aretxaga, D. Kunth, & R. Mújica, 223
- Combes & Gerin (1985) Combes, F., & Gerin, M. 1985, A&A, 150, 327
- Combes & Sanders (1981) Combes, F., & Sanders, R. H. 1981, A&A, 96, 164
- Comerón et al. (2010) Comerón, S., Knapen, J. H., Beckman, J. E., Laurikainen, E., Salo, H., Martínez-Valpuesta, I., & Buta, R. J. 2010, MNRAS, 402, 2462
- Crenshaw et al. (2003) Crenshaw, D. M., Kraemer, S. B., & Gabel, J. R. 2003, AJ, 126, 1690
- de Souza et al. (2004) de Souza, R. E., Gadotti, D. A., & dos Anjos, S. 2004, ApJS, 153, 411
- de Vaucouleurs (1959) de Vaucouleurs, G. 1959, Handbuch der Physik, 53, 275
- Desroches & Ho (2009) Desroches, L.-B., & Ho, L. C. 2009, ApJ, 690, 267
- Devereux (1987) Devereux, N. 1987, ApJ, 323, 91
- Dickey & Lockman (1990) Dickey, J. M., & Lockman, F. J. 1990, ARA&A, 28, 215
- Dumas et al. (2007) Dumas, G., Mundell, C. G., Emsellem, E., & Nagar, N. M. 2007, MNRAS, 379, 1249
- Ellison et al. (2011) Ellison, S. L., Nair, P., Patton, D. R., Scudder, J. M., Mendel, J. T., & Simard, L. 2011, MNRAS, 416, 2182
- Eracleous et al. (2002) Eracleous, M., Shields, J. C., Chartas, G., & Moran, E. C. 2002, ApJ, 565, 108
- Erroz-Ferrer et al. (2012) Erroz-Ferrer, S., et al. 2012, MNRAS, 427, 2938
- Erwin (2004) Erwin, P. 2004, A&A, 415, 941
- Eskew et al. (2012) Eskew, M., Zaritsky, D., & Meidt, S. 2012, AJ, 143, 139
- Fazio et al. (2004) Fazio, G. G., et al. 2004, ApJS, 154, 10
- Ferrarese & Merritt (2000) Ferrarese, L., & Merritt, D. 2000, ApJ, 539, L9
- Freeman (1970) Freeman, K. C. 1970, ApJ, 160, 811
- Friedli & Benz (1993) Friedli, D., & Benz, W. 1993, A&A, 268, 65
- Gabor et al. (2009) Gabor, J. M., et al. 2009, ApJ, 691, 705
- Gadotti (2008) Gadotti, D. A. 2008, MNRAS, 384, 420
- Gadotti (2011) —. 2011, MNRAS, 415, 3308
- Gadotti et al. (2007) Gadotti, D. A., Athanassoula, E., Carrasco, L., Bosma, A., de Souza, R. E., & Recillas, E. 2007, MNRAS, 381, 943
- Gadotti & Kauffmann (2009) Gadotti, D. A., & Kauffmann, G. 2009, MNRAS, 399, 621
- Gallo et al. (2008) Gallo, E., Treu, T., Jacob, J., Woo, J.-H., Marshall, P. J., & Antonucci, R. 2008, ApJ, 680, 154
- García-Burillo et al. (2005) García-Burillo, S., Combes, F., Schinnerer, E., Boone, F., & Hunt, L. K. 2005, A&A, 441, 1011
- Garcia-Rissmann et al. (2005) Garcia-Rissmann, A., Vega, L. R., Asari, N. V., Cid Fernandes, R., Schmitt, H., González Delgado, R. M., & Storchi-Bergmann, T. 2005, MNRAS, 359, 765
- Garmire et al. (2003) Garmire, G. P., Bautz, M. W., Ford, P. G., Nousek, J. A., & Ricker, Jr., G. R. 2003, in Society of Photo-Optical Instrumentation Engineers (SPIE) Conference Series, Vol. 4851, Society of Photo-Optical Instrumentation Engineers (SPIE) Conference Series, ed. J. E. Truemper & H. D. Tananbaum, 28–44
- Gebhardt et al. (2000) Gebhardt, K., et al. 2000, ApJ, 539, L13
- Gebhardt et al. (2003) —. 2003, ApJ, 583, 92
- Georgakakis et al. (2009) Georgakakis, A., et al. 2009, MNRAS, 397, 623
- Ghosh et al. (2008) Ghosh, H., Mathur, S., Fiore, F., & Ferrarese, L. 2008, ApJ, 687, 216
- Gilfanov (2004) Gilfanov, M. 2004, MNRAS, 349, 146
- González-Martín et al. (2009) González-Martín, O., Masegosa, J., Márquez, I., Guainazzi, M., & Jiménez-Bailón, E. 2009, A&A, 506, 1107
- González-Martín et al. (2006) González-Martín, O., Masegosa, J., Márquez, I., Guerrero, M. A., & Dultzin-Hacyan, D. 2006, A&A, 460, 45
- Graham (2008) Graham, A. W. 2008, ApJ, 680, 143
- Grier et al. (2011) Grier, C. J., Mathur, S., Ghosh, H., & Ferrarese, L. 2011, ApJ, 731, 60
- Gültekin et al. (2009) Gültekin, K., et al. 2009, ApJ, 698, 198
- Haan et al. (2009) Haan, S., Schinnerer, E., Emsellem, E., García-Burillo, S., Combes, F., Mundell, C. G., & Rix, H.-W. 2009, ApJ, 692, 1623
- Häring & Rix (2004) Häring, N., & Rix, H. 2004, ApJ, 604, L89
- Hasan & Norman (1990) Hasan, H., & Norman, C. 1990, ApJ, 361, 69
- Heckman et al. (1980) Heckman, T. M., Crane, P. C., & Balick, B. 1980, A&AS, 40, 295
- Ho (2009) Ho, L. C. 2009, ApJ, 699, 626
- Ho et al. (1997a) Ho, L. C., Filippenko, A. V., & Sargent, W. L. W. 1997a, ApJ, 487, 568
- Ho et al. (1997b) —. 1997b, ApJ, 487, 591
- Ho et al. (2009) Ho, L. C., Greene, J. E., Filippenko, A. V., & Sargent, W. L. W. 2009, ApJS, 183, 1
- Ho et al. (2001) Ho, L. C., et al. 2001, ApJ, 549, L51
- Hummel et al. (1990) Hummel, E., van der Hulst, J. M., Kennicutt, R. C., & Keel, W. C. 1990, A&A, 236, 333
- Hunt & Malkan (1999) Hunt, L. K., & Malkan, M. A. 1999, ApJ, 516, 660
- Immler et al. (2006) Immler, S., et al. 2006, ApJ, 648, L119
- Jahnke et al. (2009) Jahnke, K., et al. 2009, ApJ, 706, L215
- Jenkins et al. (2011) Jenkins, L. P., et al. 2011, ApJ, 734, 33
- Kalberla et al. (2005) Kalberla, P. M. W., Burton, W. B., Hartmann, D., Arnal, E. M., Bajaja, E., Morras, R., & Pöppel, W. G. L. 2005, A&A, 440, 775
- Kim et al. (2012) Kim, W.-T., Seo, W.-Y., & Kim, Y. 2012, ApJ, 758, 14
- Knapen (2005) Knapen, J. H. 2005, A&A, 429, 141
- Knapen et al. (1995) Knapen, J. H., Beckman, J. E., Heller, C. H., Shlosman, I., & de Jong, R. S. 1995, ApJ, 454, 623
- Knapen et al. (2000) Knapen, J. H., Shlosman, I., & Peletier, R. F. 2000, ApJ, 529, 93
- Kocevski et al. (2012) Kocevski, D. D., et al. 2012, ApJ, 744, 148
- Kormendy & Ho (2013) Kormendy, J., & Ho, L. C. 2013, ARA&A, in press (arXiv:1304.7762)
- Kormendy & Kennicutt (2004) Kormendy, J., & Kennicutt, Jr., R. C. 2004, ARA&A, 42, 603
- Kormendy & Richstone (1995) Kormendy, J., & Richstone, D. 1995, ARA&A, 33, 581
- Kraljic et al. (2012) Kraljic, K., Bournaud, F., & Martig, M. 2012, ApJ, 757, 60
- Laine et al. (2002) Laine, S., Shlosman, I., Knapen, J. H., & Peletier, R. F. 2002, ApJ, 567, 97
- Laurikainen et al. (2004a) Laurikainen, E., Salo, H., & Buta, R. 2004a, ApJ, 607, 103
- Laurikainen et al. (2004b) Laurikainen, E., Salo, H., Buta, R., & Vasylyev, S. 2004b, MNRAS, 355, 1251
- Laurikainen et al. (2002) Laurikainen, E., Salo, H., & Rautiainen, P. 2002, MNRAS, 331, 880
- Lee et al. (2012) Lee, G.-H., Woo, J.-H., Lee, M. G., Hwang, H. S., Lee, J. C., Sohn, J., & Lee, J. H. 2012, ApJ, 750, 141
- Leon & Verdes-Montenegro (2003) Leon, S., & Verdes-Montenegro, L. 2003, A&A, 411, 391
- Lewis & Eracleous (2006) Lewis, K. T., & Eracleous, M. 2006, ApJ, 642, 711
- Luo et al. (2012) Luo, B., et al. 2012, ApJ, 749, 130
- Lynden-Bell (1969) Lynden-Bell, D. 1969, Nature, 223, 690
- Maciejewski et al. (2002) Maciejewski, W., Teuben, P. J., Sparke, L. S., & Stone, J. M. 2002, MNRAS, 329, 502
- Magorrian et al. (1998) Magorrian, J., et al. 1998, AJ, 115, 2285
- Maia et al. (2003) Maia, M. A. G., Machado, R. S., & Willmer, C. N. A. 2003, AJ, 126, 1750
- Marconi & Hunt (2003) Marconi, A., & Hunt, L. K. 2003, ApJ, 589, L21
- Marconi et al. (2004) Marconi, A., Risaliti, G., Gilli, R., Hunt, L. K., Maiolino, R., & Salvati, M. 2004, MNRAS, 351, 169
- Martin (1995) Martin, P. 1995, AJ, 109, 2428
- Martini (2004) Martini, P. 2004, in IAU Symposium, Vol. 222, The Interplay Among Black Holes, Stars and ISM in Galactic Nuclei, ed. T. Storchi-Bergmann, L. C. Ho, & H. R. Schmitt, 235–241
- Martini et al. (2002) Martini, P., Kelson, D. D., Mulchaey, J. S., & Trager, S. C. 2002, ApJ, 576, L109
- Martini & Pogge (1999) Martini, P., & Pogge, R. W. 1999, AJ, 118, 2646
- Martini et al. (2001) Martini, P., Pogge, R. W., Ravindranath, S., & An, J. H. 2001, ApJ, 562, 139
- Martini et al. (2003a) Martini, P., Regan, M. W., Mulchaey, J. S., & Pogge, R. W. 2003a, ApJS, 146, 353
- Martini et al. (2003b) —. 2003b, ApJ, 589, 774
- Mathur (2000) Mathur, S. 2000, MNRAS, 314, L17
- Mathur et al. (2012) Mathur, S., Fields, D., Peterson, B. M., & Grupe, D. 2012, ApJ, 754, 146
- McElroy (1995) McElroy, D. B. 1995, ApJS, 100, 105
- McLeod & Rieke (1995) McLeod, K. K., & Rieke, G. H. 1995, ApJ, 441, 96
- Meidt et al. (2012) Meidt, S. E., et al. 2012, ApJ, 744, 17
- Moles et al. (1995) Moles, M., Marquez, I., & Perez, E. 1995, ApJ, 438, 604
- Muñoz-Mateos et al. (2013) Muñoz-Mateos, J. C., et al. 2013, ApJ, 771, 59
- Mulchaey & Regan (1997) Mulchaey, J. S., & Regan, M. W. 1997, ApJ, 482, L135
- Mundell & Shone (1999) Mundell, C. G., & Shone, D. L. 1999, MNRAS, 304, 475
- Narayan & McClintock (2008) Narayan, R., & McClintock, J. E. 2008, New Astron. Rev., 51, 733
- Nowak et al. (2010) Nowak, N., Thomas, J., Erwin, P., Saglia, R. P., Bender, R., & Davies, R. I. 2010, MNRAS, 403, 646
- Oh et al. (2012) Oh, S., Oh, K., & Yi, S. K. 2012, ApJS, 198, 4
- Oh et al. (2008) Oh, S.-H., de Blok, W. J. G., Walter, F., Brinks, E., & Kennicutt, Jr., R. C. 2008, AJ, 136, 2761
- Oliva et al. (1995) Oliva, E., Origlia, L., Kotilainen, J. K., & Moorwood, A. F. M. 1995, A&A, 301, 55
- Orban de Xivry et al. (2011) Orban de Xivry, G., Davies, R., Schartmann, M., Komossa, S., Marconi, A., Hicks, E., Engel, H., & Tacconi, L. 2011, MNRAS, 417, 2721
- Paturel et al. (2003) Paturel, G., Petit, C., Prugniel, P., Theureau, G., Rousseau, J., Brouty, M., Dubois, P., & Cambrésy, L. 2003, A&A, 412, 45
- Peeples & Martini (2006) Peeples, M. S., & Martini, P. 2006, ApJ, 652, 1097
- Pellegrini et al. (2007) Pellegrini, S., Siemiginowska, A., Fabbiano, G., Elvis, M., Greenhill, L., Soria, R., Baldi, A., & Kim, D. W. 2007, ApJ, 667, 749
- Pfenniger & Norman (1990) Pfenniger, D., & Norman, C. 1990, ApJ, 363, 391
- Phillips et al. (1984) Phillips, M. M., Pagel, B. E. J., Edmunds, M. G., & Diaz, A. 1984, MNRAS, 210, 701
- Quillen et al. (1994) Quillen, A. C., Frogel, J. A., & Gonzalez, R. A. 1994, ApJ, 437, 162
- Regan & Mulchaey (1999) Regan, M. W., & Mulchaey, J. S. 1999, AJ, 117, 2676
- Regan et al. (1999) Regan, M. W., Sheth, K., & Vogel, S. N. 1999, ApJ, 526, 97
- Regan et al. (1997) Regan, M. W., Vogel, S. N., & Teuben, P. J. 1997, ApJ, 482, L143
- Richstone et al. (1998) Richstone, D., et al. 1998, Nature, 395, A14+
- Rozas et al. (1998) Rozas, M., Knapen, J. H., & Beckman, J. E. 1998, MNRAS, 301, 631
- Sakamoto et al. (1999) Sakamoto, K., Okumura, S. K., Ishizuki, S., & Scoville, N. Z. 1999, ApJ, 525, 691
- Salo et al. (2010) Salo, H., Laurikainen, E., Buta, R., & Knapen, J. H. 2010, ApJ, 715, L56
- Sani et al. (2011) Sani, E., Marconi, A., Hunt, L. K., & Risaliti, G. 2011, MNRAS, 413, 1479
- Sarzi et al. (2001) Sarzi, M., Rix, H.-W., Shields, J. C., Rudnick, G., Ho, L. C., McIntosh, D. H., Filippenko, A. V., & Sargent, W. L. W. 2001, ApJ, 550, 65
- Sérsic (1968) Sérsic, J. L. 1968, Atlas de galaxias australes, ed. J. L. Sersic
- Shankar et al. (2004) Shankar, F., Salucci, P., Granato, G. L., De Zotti, G., & Danese, L. 2004, MNRAS, 354, 1020
- Shen & Sellwood (2004) Shen, J., & Sellwood, J. A. 2004, ApJ, 604, 614
- Sheth et al. (2000) Sheth, K., Regan, M. W., Vogel, S. N., & Teuben, P. J. 2000, ApJ, 532, 221
- Sheth et al. (2002) Sheth, K., Vogel, S. N., Regan, M. W., Teuben, P. J., Harris, A. I., & Thornley, M. D. 2002, AJ, 124, 2581
- Sheth et al. (2005) Sheth, K., Vogel, S. N., Regan, M. W., Thornley, M. D., & Teuben, P. J. 2005, ApJ, 632, 217
- Sheth et al. (2010) Sheth, K., et al. 2010, PASP, 122, 1397
- Shlosman et al. (1989) Shlosman, I., Frank, J., & Begelman, M. C. 1989, Nature, 338, 45
- Shlosman et al. (2000) Shlosman, I., Peletier, R. F., & Knapen, J. H. 2000, ApJ, 535, L83
- Simkin et al. (1980) Simkin, S. M., Su, H. J., & Schwarz, M. P. 1980, ApJ, 237, 404
- Skrutskie et al. (2006) Skrutskie, M. F., et al. 2006, AJ, 131, 1163
- Smith et al. (2007) Smith, J. D. T., et al. 2007, ApJ, 656, 770
- Soltan (1982) Soltan, A. 1982, MNRAS, 200, 115
- Speltincx et al. (2008) Speltincx, T., Laurikainen, E., & Salo, H. 2008, MNRAS, 383, 317
- Stark (1977) Stark, A. A. 1977, ApJ, 213, 368
- Stauffer (1982) Stauffer, J. R. 1982, ApJ, 262, 66
- Tremaine et al. (2002) Tremaine, S., et al. 2002, ApJ, 574, 740
- Tzanavaris & Georgantopoulos (2007) Tzanavaris, P., & Georgantopoulos, I. 2007, A&A, 468, 129
- Ueda et al. (2003) Ueda, Y., Akiyama, M., Ohta, K., & Miyaji, T. 2003, ApJ, 598, 886
- Vasudevan & Fabian (2007) Vasudevan, R. V., & Fabian, A. C. 2007, MNRAS, 381, 1235
- Véron-Cetty & Véron (2006) Véron-Cetty, M.-P., & Véron, P. 2006, A&A, 455, 773
- Villa-Vargas et al. (2010) Villa-Vargas, J., Shlosman, I., & Heller, C. 2010, ApJ, 719, 1470
- Wada (2004) Wada, K. 2004, Coevolution of Black Holes and Galaxies, 186
- Walcher et al. (2005) Walcher, C. J., et al. 2005, ApJ, 618, 237
- Wang et al. (2012) Wang, J., et al. 2012, MNRAS, 423, 3486
- Wegner et al. (2003) Wegner, G., et al. 2003, AJ, 126, 2268
- York et al. (2000) York, D. G., et al. 2000, AJ, 120, 1579
- Yu & Tremaine (2002) Yu, Q., & Tremaine, S. 2002, MNRAS, 335, 965
- Zaritsky & Lo (1986) Zaritsky, D., & Lo, K. Y. 1986, ApJ, 303, 66
- Zhang et al. (2009) Zhang, W. M., Soria, R., Zhang, S. N., Swartz, D. A., & Liu, J. F. 2009, ApJ, 699, 281