Star formation and black hole growth at
Abstract
We report Herschel/SPIRE Spitzer and WISE observations of 44 optically selected active galactic nuclei (AGNs). This flux limited sample contains the highest mass black holes (BHs) at this redshift. Ten of the objects were detected by Herschel and five show emission that is not clearly associated with the AGNs. The star formation (SF) luminosity () obtained by fitting the spectral energy distribution (SED) with standard SF templates, taking into account AGN contribution, is in the range erg s-1 corresponding to SF rates of yr-1. Fitting with very luminous submillimeter galaxy SEDs gives SF rates that are smaller by 0.05 dex when using all bands and 0.1 dex when ignoring the 250m band. A 40K gray-body fits to only the 500m fluxes reduce by about a factor two. Stacking analysis of 29 undetected sources give significant signals in all three bands. A SF template fit indicates = erg s-1 depending on the assume AGN contribution. A 40K fit to the stacked 500m flux gives =erg s-1. The mean BH mass () and AGN luminosity () of the detected sources are significantly higher than those of the undetected ones. The spectral differences are seen all the way from UV to far infrared wavelengths. The mean optical-UV spectra are similar to the ones predicted for thin accretion disks around BHs with the measured masses and accretion rates. We suggest two alternative explanations to the correlation of , and , one involving no AGN feedback and the second a moderate feedback that affects, but not totally quench SF in 3/4 of the sources. We compare our and to lower redshift samples and show a new correlation between and . We also examine several rather speculative ideas about the host galaxy properties including the possibility that the detected sources are above the SF mass sequence (MS) at , perhaps in mergers, and most of the undetected sources are on the MS.
1 Introduction
The comparison of the properties of super-massive black holes (BHs) and their host galaxies, at various redshifts, is essential for understanding galaxy evolution. In particular, the star formation (SF) history in such hosts may be related to the accretion and growth of the central BH since both are linked to the cold gas supply from the halo and the molecular gas in the disk. Such a comparison has been a very active area of research for many years with various, occasionally conflicting results about the correlation of the luminosity of the active galactic nucleus (AGN) () and the SF rate (SFR), or SF luminosity () is such systems (e.g. Rosario et al., 2012; Mullaney et al., 2012a, and references therein).
The launch of Herschel was an important mile-stone in this area. This mission allowed deeper and more accurate measurements of through sensitive, far infrared (FIR) observations. It is becoming clear that most AGNs, at all redshifts, reside in SF galaxies (Silverman et al., 2008; Santini et al., 2012; Mullaney et al., 2012b; Mainieri et al., 2011) and there is no evidence for different properties of the host, whether it contains an active or dormant BH, provided the stellar mass () is the same (Rosario et al., 2013). Several Herschel-based studies, e.g. Shao et al. (2010), Hatziminaoglou et al. (2010), Rosario et al. (2012), Harrison et al. (2012) and Page et al. (2012) show the complex dependence of on at all redshifts up to . Some of the studies (Shao et al., 2010; Rosario et al., 2012) demonstrate that the - plane can be divided into two regimes with very different behaviors. One is the “SF dominated” regime where . Here the two properties are not correlated and exceeds by a redshift dependent factor. In the second “AGN dominated” regime, where , the sources seem to confluence around a power-law line which is given roughly by . A very similar relationship was suggested in earlier works (e.g., Netzer et al., 2007; Lutz et al., 2008; Netzer, 2009). The exact distribution in the - plane is still to be verified, because of the various selection effects entering the selection of FIR-faint high redshift sources (e.g. Page et al., 2012; Harrison et al., 2012), and is still to be explained by theoretical models.
The situation at is more complex because almost all of the Herschel observations are affected by confusion noise. This is the reason why, so far, there are very few systematic FIR studies at such redshifts. At even higher redshifts there are very few known SF-dominated sources although a handful of sources with have been found mainly by sub-mm observations (e.g., Isaak et al., 2002; Priddey et al., 2003; Wu et al., 2009; Leipski et al., 2010; Omont et al., 2013; Wang et al., 2011). It is therefore important to study well defined samples, selected by their optical properties, using Herschel. This is a major aim of the present work.
Galaxy evolution scenarios suggest two modes of SF. The steadier process (hereafter “secular evolution”) is common in isolated disk galaxies and can reach SFRs of yr-1 for the most massive galaxies at high redshift. SF due to starburst is generally less common. The SFR in such cases can exceed 1000 yr-1 and the starburst activity is associated, in many cases, with mergers between galaxies (Wuyts et al., 2011a, b). The highest SFR cases are thought to be associated with mergers of similar mass, massive gas-rich galaxies (see e.g., Rodighiero et al., 2011). Both secular evolution and starburst through mergers can result in cold gas inflow into the center of the system which can trigger AGN activity Di Matteo et al. (2005); Guyon et al. (2006); Sijacki et al. (2011); Valiante et al. (2011).
A somewhat different way to address SFR, especially at high redshift, is to consider feeding of isolated galaxies by “cold streams” from the halo. Hydrodynamical simulations of such processes, like those published recently by Khandai et al. (2012), show a strong correlation between SFR and BH accretion rate at . The SFR in such systems can reach and even exceed 1000 yr-1.
It is not yet clear which of the gas supply mechanisms is more important and under what conditions. A recent semi-analytic model by Neistein & Netzer (2013) shows that many observed correlations at , including the general behavior in the - plane, can be reproduced by a model where AGN activity is triggered solely by mergers. Other numerical simulations and semi-analytic models suggest that in merger events, the fastest SMBH growth phase succeeds the peak of SF activity by several hundred Myr. A related suggestion is that the earlier stages of a major merger take place when the BH is obscured (e.g., Hopkins et al., 2006; Di Matteo et al., 2008). Some support for this idea comes from the fact that sub-mm galaxies (SMGs) with very high SFR, often exhibit little or no AGN activity. However, there is no complete census of the AGN population at high redshift to support this claim. Finally, AGN feedback, that can quench SF and BH accretion through fast winds and photoionization by the intense AGN radiation (e.g., Di Matteo et al., 2005; Springel et al., 2005; Sijacki et al., 2007), can also contribute to the relationship between and in systems hosting high luminosity AGNs.
It this paper we discuss the UV, optical and IR properties of an optically selected flux limited sample of AGNs at . The basic physical properties of the sources are given in (Trakhtenbrot et al., 2011, hereafter T11) and preliminary Herschel results for 25 of the sources where published in (Mor et al., 2012, hereafter M12). Here we expand the FIR study to all 44 sources and include also new Spitzer and WISE observations. Section 2 introduces all the observations and the flux and luminosity measurements and § 3 discusses various central issues like the correlations between , , and BH mass (). We also address the properties of the UV-FIR spectral energy distribution (SED) of the sources and suggest various evolutionary scenarios that connect the accumulation of BH and stellar mass through cosmic time. Throughout this paper we assume km s-1 Mpc-1, and .
2 Observations Reduction and Basic Analysis
2.1 Herschel observations
The AGN sample described in this work includes 44 high luminosity AGNs at . This is a flux limited sample selected from the Sloan Digital Sky Survey (SDSS, York et al 2000) to include the most luminous AGNs in a narrow redshift range 4.66–4.87. The sample was described in T11 where details of the H and K-band spectroscopy are given. BH mass measurements are available for 40 of the sources using the 3000Å continuum luminosity and the Mg ii line width (see T11 for more details). The additional 4 objects were observed by us but resulted in poor quality Mg ii observations and hence no reliable mass estimates. The observations allow good measurements of , and an estimate of the duty cycle of this population.
The Herschel observations cover all original 44 sources including the 4 objects with no reliable BH mass determination. Data reduction and analysis utilized standard Herschel tools and was explained in detail in M12. Here we summarize the more important details for clarity.
Details of the Herschel observations are given in Table 1. All sources have been observed with the SPIRE instrument Griffin et al. (2010) providing images at 250, 350, and 500 m, corresponding to the rest-frame FIR wavelength range of 43–86 m. The observations were made in the small-map mode. The data reduction process starts with the level 0.5 product of the SPIRE pipeline and uses standard tools provided by the Herschel Science Centre (HSC) via the HIPE software (Ott, 2010, version 9.0), and version 9.1 of the calibration files.
| Spitzer observationsb | Herschel observationsc | |||||||||
| Object | za | Spitzer ID | (3.6m) | (4.5m) | SPIRE | (250m) | (350m) | (500m) | FIR | |
| (SDSS J) | (AOR#) | (Jy) | (Jy) | Obs. ID | (mJy) | (mJy) | (mJy) | statuse | ||
| 000749.16+004119.6 | 4.786 | 42390016 | 40.951.31 | 37.350.76 | 1 | 1342212418 | 0.05.9 | 0.06.3 | 0.06.8 | o |
| 003525.28+004002.8 | 4.759 | 42390272 | 119.151.33 | 89.760.79 | 1342213190 | 0.05.8 | 0.06.3 | 0.06.8 | - | |
| 021043.16-001818.4 | 4.713 | 34925056 | 80.692.78 | 66.122.22 | 1342237543 | 0.05.8 | 0.06.3 | 0.06.8 | - | |
| 033119.66-074143.1 | 4.729 | 42390528 | 148.831.33 | 113.810.81 | 1 | 1342214563 | 26.46.1 | 24.66.6 | 22.17.0 | + |
| 075907.57+180054.7 | 4.804 | 42390784 | 167.701.34 | 124.090.81 | 1342229465 | 0.05.8 | 0.06.3 | 0.06.8 | - | |
| 080023.01+305101.1 | 4.677 | 42391040 | 179.711.35 | 138.800.82 | 1342229475 | 0.05.8 | 25.96.6 | 35.57.3 | - | |
| 080715.11+132805.1 | 4.885 | 42391296 | 85.661.31 | 72.700.77 | 2 | 1342230781 | 12.85.9 | 19.36.5 | 13.76.9 | + |
| 083920.53+352459.3 | 4.795 | 42391552 | 49.971.30 | 37.480.76 | 1342230757 | 0.05.8 | 0.06.3 | 0.06.8 | - | |
| 085707.94+321031.9 | 4.801 | 42391808 | 194.191.35 | 149.680.81 | 1342230758 | 0.05.8 | 0.06.3 | 0.06.8 | - | |
| 092303.53+024739.5 | 4.659 | 42392064 | 59.431.32 | 48.520.75 | 1342245156 | 0.05.8 | 0.06.3 | 0.06.8 | - | |
| 093508.49+080114.5 | 4.671 | 42392320 | 101.101.32 | 85.280.79 | 1342245560 | 0.05.8 | 0.06.3 | 0.06.9 | - | |
| 093523.31+411518.5 | 4.802 | 42392576 | 76.471.30 | 63.740.75 | 1342230746 | 0.05.8 | 0.06.3 | 0.06.8 | - | |
| 094409.52+100656.6 | 4.771 | 42392832 | 168.761.35 | 128.430.80 | 1342246601 | 0.05.8 | 0.06.3 | 0.06.8 | - | |
| 101759.63+032739.9 | 4.943 | 42393088 | 55.951.32 | 43.000.87 | 1342222673 | 0.05.8 | 0.06.4 | 0.06.8 | - | |
| 105919.22+023428.7 | 4.789 | 42393344 | 70.431.33 | 56.780.82 | 1342222891 | 0.05.9 | 20.66.5 | 0.07.0 | o | |
| 110045.23+112239.1 | 4.707∗ | 1342222887 | 0.05.8 | 0.06.3 | 0.06.8 | - | ||||
| 111358.32+025333.6 | 4.870 | 42393600 | 86.441.34 | 72.520.85 | 1 | 1342222890 | 0.05.8 | 0.06.3 | 0.06.9 | o |
| 114448.54+055709.8 | 4.790 | 42393856 | 42.611.30 | 31.840.78 | 1342234877 | 0.05.8 | 0.06.3 | 0.06.8 | - | |
| 115158.25+030341.7 | 4.687 | 42394112 | 22.791.29 | 18.540.76 | 1342234878 | 0.05.8 | 0.06.4 | 0.06.8 | - | |
| 120256.43+072038.9 | 4.810 | 42394368 | 88.401.35 | 74.900.91 | 1342234895 | 0.05.8 | 0.06.4 | 0.06.8 | - | |
| 123503.03-000331.7 | 4.700 | 42394624 | 69.661.34 | 62.810.95 | 1342234884 | 0.05.9 | 0.06.4 | 0.06.8 | - | |
| 130619.38+023658.9 | 4.860 | 42394880 | 239.701.39 | 207.720.98 | 1342224983 | 0.05.9 | 0.06.4 | 0.06.8 | - | |
| 131737.27+110533.0 | 4.744 | 42395136 | 116.791.34 | 89.780.89 | 1342224984 | 0.05.8 | 0.06.3 | 0.06.8 | o | |
| 132110.81+003821.7 | 4.726 | 42395392 | 69.191.34 | 61.810.93 | 1342224986 | 0.05.8 | 0.06.3 | 0.06.8 | - | |
| 132853.66-022441.6 | 4.658 | 42395648 | 82.861.32 | 64.650.87 | 1342234799 | 0.05.8 | 0.06.3 | 0.06.8 | - | |
| 133125.56+025535.5 | 4.762 | 42395904 | 30.331.32 | 28.640.88 | 1342224985 | 23.06.1 | 38.57.0 | 36.87.4 | o | |
| 134134.19+014157.7 | 4.689 | 42396160 | 159.691.36 | 132.010.95 | 2 | 1342234797 | 41.76.6 | 47.47.3 | 42.77.5 | + |
| 134546.96-015940.3 | 4.728 | 42396416 | 63.721.33 | 48.230.91 | 1342236167 | 0.05.8 | 0.06.3 | 0.06.8 | - | |
| 140404.63+031403.9 | 4.903 | 42396672 | 97.721.34 | 86.830.90 | 1342236163 | 25.86.1 | 31.16.7 | 22.97.0 | + | |
| 143352.21+022713.9 | 4.722 | 42396928 | 302.751.39 | 295.180.93 | 1342236160 | 28.16.2 | 25.76.6 | 12.76.9 | + | |
| 143629.94+063508.0 | 4.817 | 42397184 | 71.391.31 | 54.550.81 | 1342236156 | 0.05.8 | 0.06.3 | 0.06.8 | - | |
| 144352.94+060533.1 | 4.884 | 42397440 | 48.021.29 | 34.740.78 | 1342236159 | 0.05.8 | 0.06.3 | 0.06.8 | - | |
| 144734.09+102513.1 | 4.679 | 1342236153 | 0.05.8 | 0.06.3 | 0.06.8 | - | ||||
| 151155.98+040802.9 | 4.670 | 42397696 | 92.581.32 | 87.450.80 | 2 | 1342238320 | 26.66.1 | 38.06.9 | 28.97.2 | + |
| 161622.10+050127.7 | 4.869 | 42397952 | 151.591.33 | 122.640.83 | 1 | 1342229564 | 48.06.9 | 49.77.4 | 47.47.7 | + |
| 161931.58+123844.4 | 4.806∗ | 1342229563 | 47.76.8 | 38.57.0 | 21.67.0 | + | ||||
| 165436.85+222733.7 | 4.717 | 42398208 | 248.001.35 | 204.630.78 | 1 | 1342229582 | 21.96.0 | 15.06.4 | 5.96.8 | + |
| 205724.14-003018.7 | 4.680 | 1342218986 | 0.05.9 | 0.06.3 | 0.06.8 | - | ||||
| 220008.66+001744.9 | 4.804 | 42398464 | 135.761.34 | 101.040.79 | 1342233332 | 0.05.8 | 0.06.3 | 0.06.8 | - | |
| 221705.71-001307.7 | 4.676 | 34924288 | 57.332.32 | 51.241.64 | 1342220873 | 0.05.8 | 0.06.3 | 0.06.8 | - | |
| 222050.80+001959.1 | 4.716∗ | 34924544 | 53.972.32 | 48.541.65 | 1342220872 | 0.05.8 | 0.06.3 | 0.06.8 | - | |
| 222509.19-001406.9 | 4.890 | 34925312 | 156.342.45 | 125.591.75 | 1342220530 | 24.76.1 | 30.36.7 | 22.27.0 | + | |
| 224453.06+134631.6 | 4.656 | 42398720 | 48.041.29 | 48.860.73 | 1342211361 | 0.05.8 | 0.06.4 | 0.06.8 | - | |
| 235152.80+160048.9 | 4.694∗ | 1342213200 | 0.05.8 | 0.06.3 | 0.06.8 | - | ||||
a determined by T11 from the Mg ii line, except for objects with asterisks, for which redshifts are taken from the SDSS DR7 QSO catalog.
b flux densities are measured through an aperture of 3.6 arcsec.
c flux densities are measured through apertures centered on the SDSS source centers. For sources with , the flux measurements take into account the neighboring sources (see §2.5).
d number of nearby Spitzer sources (within PSF).
e classification of Herschel data: “+” - detected; “-” - nondetected; “o” - offset.
2.2 Herschel photometry
Nine out of 44 sources, all with measured, , are clearly detected in all three SPIRE bands. We follow the guidelines of the HSC and apply a peak fitting method to all images of these sources (M12). in order to measure the FIR flux. Due to the low resolution of the SPIRE images, and the pointing accuracy of Herschel (about ) the determination of the the exact location of the source on the image is somewhat uncertain. We therefore apply our photometry twice with the two dimensional Gaussian centered at two different locations. The first is determined by the pointing of the Herschel telescope and the second is the center of the SDSS image. Note that even with perfect pointing, the two do not necessarily agree since the first represents the peak of SF activity and the second the location of the active BH. At , corresponds to 6.4 kpc and the difference in location between the two is likely a tiny fraction of the point spread function (PSF) of the instrument. The flux measurements for the two locations agree very well with a difference which is, at most, 5%. Table 1 lists fluxes measured assuming the object location is determined by the pointing of the telescope111The other fluxes are available from the authors upon request. 350m images of several detected sources are given in M12.
There are three known sources of uncertainty related to SPIRE photometry (see the SPIRE observers‘ manual222http://herschel.esac.esa.int/Docs/SPIRE/html/spire_om.html). The first is related to the fitting procedure and includes both instrumental and confusion noise. The integration times in our program (either 222 or 296 seconds) are long enough to minimize the instrumental noise and obtain images which are dominated by the extragalactic confusion noise estimated to be 5.8, 6.3 and 6.8 mJy/beam at 250, 350 and 500 m, respectively Nguyen et al. (2010). The second uncertainty is related to the pixelization correction of the images. This introduces an additional uncertainty of about 2–3% to the flux density. The third uncertainty is associated with the calibration process and is about 7% of the flux density. These uncertainties are added in quadrature and listed together with the measured fluxes in Table 1.
Six of the sources, all with measured , show clear signs of emission within the instrument PSF in all bands. However, the overall shape is very different from a point source and the peak emission is offset by several pixels from the expected SDSS location of the AGN which corresponds to more than 100 kpc at . We refer to these objects as “offset” sources. As shown below, our prior-based analysis suggests that one of these sources includes a real detection in the location of the AGN.
2.3 Spitzer Observations and photometry
We obtained additional observations of most of the sources in our sample using the Spitzer Infrared Array Camera (IRAC; Fazio et al. 2004) in Cycle 8 (Program ID 80093, PI O. Shemmer). In total 35 of the sources were observed by Spitzer/IRAC in the 3.6 and 4.5 m bands. Details of the observations are given in Table 1. The net integration time for each observation is 360 seconds. All sources are clearly detected in both Spitzer bands. In addition, four sources in our sample have archival IRAC images (Program ID 60139; PI G. Richards). These images were reduced and analyzed in a way identical to the images obtained by us. It total, we have 39 Spitzer detections in both IRAC bands. Nine of these sources correspond to Herschel-detected AGNs with measured and 24 to Herschel-undetected AGNs with measured ..
The reduction of the IRAC observations utilized standard Spitzer routines and will not be described in detail. It is based on the version S18.5.0 of the Spitzer Science Center (SSC) pipeline and uses the specific software package mopex (version 18.5.4; Makovoz & Marleau 2005). We have measured the flux in several available apertures and used the correction factors provided in the IRAC Handbook333http://irsa.ipac.caltech.edu/data/SPITZER/docs/irac/iracinstrumenthandbook/home/. We chose to use the recommended aperture of . Array-location-dependent corrections were applied to the IRAC data but no color or pixel-phase corrections were used as these were found to have a minute (%) effect on the total flux. Table 1 presents the results of our Spitzer photometry. The statistical flux uncertainties for all mosaics are smaller than the 5% calibration accuracy of IRAC. However, the differences between the 3.6 and 6 ″ fluxes, including the aperture correction factors, are larger, of order 10%. In the table we quote this 10% uncertainty for all our measured fluxes.
The IRAC observations provide data on the AGN continuum at effective rest-frame wavelengths of about 6120 and 7760Å. The strong H line flux is included in the 3.6m band and must be taken into account when considering the SED of the AGNs. Based on observations of strong-line type-I AGNs (Stern & Laor, 2012), we estimate that the line contribution to the total flux in this band is %. Below we refer to individual Spitzer observations as well as to two sub-groups corresponding to the Herschel sub-groups of detected and undetected sources.
2.4 WISE Observations and photometry
We have used publicly available data from the Wide-Field Infrared Survey (WISE Wright et al., 2010)) to complement our Spitzer data. The all-sky point source catalog was queried for entries that are located within 5″ of the SDSS positions of the sources. This query provided detections (i.e. sources with in at least the 3.35 , or “W1”, band) for 35 sources. Of these, 31, 11 and 4 sources had significant detections () in the 4.6, 11.56 and 22.1 (“W2”, “W3” and “W4”) bands, respectively. The cataloged magnitudes were converted to flux densities using the conversion factors tabulated in Wright et al. (2010) (table 1). The specific choice of assumed SEDs has a negligible effect (a few percent) on the derived flux densities. Symmetric uncertainties on the flux densities were derived directly from the S/N ratios (SNRs) listed in the catalog. These flux densities and uncertainties are listed in Table 1. We note that the uncertainties, and thus the level of significance, differ significantly across the sample. This is due to the heterogeneous nature of the WISE coverage. Thus, the data do not provide a complete mid-IR survey of the sample.
The two shorter-wavelength WISE bands probe essentially the same wavelength range as the Spitzer observations. Indeed, the observed fluxes are very similar in all cases with median differences of less than 0.07 and 0.002 dex, and standard deviations of about 0.12 and 0.11 dex, for the first and second bands, respectively (24 and 20 overlapping objects). These bands probe the AGN-dominated continuum and some of the differences may be due to source variability.
The very small number of sources detected in the 22m (“W4”) band prevents us from making use of this information. Hence, we combine the WISE data in the two short-wavelength bands with the Spitzer data and conduct a separate analysis of the 11.6m (“W3”) band as discussed below.
2.5 Herschel Photometry Using Spitzer Priors
Perez-Gonzalez et al. (2010) have shown that using priors that are measured at shorter wavelengths can significantly improve the identification and flux measurement of high-redshift, confusion limited FIR sources. The simplest way to apply this procedure is to fit two-dimensional gaussians to all detected or suspected sources in the field, thus increasing the accuracy of the flux measurement of the prime target. In the case in question, the main candidates to affect the measurements are lower redshift sources with significant SF that produce some luminosity due to dust emission even at the long wavelength SPIRE bands.
All our nine detected objects have Spitzer observations that cover the entire SPIRE field of the source. We are therefore able to look for neighboring (non-AGN) sources and apply the prior-based flux measurement method. In eight of the cases the Spitzer sources are too far to make a significant effect on the fluxes measured with the methods described above (Herschel and SDSS centered targets). Nevertheless, we considered the prior-based measurements to be the most reliable and hence they are the ones listed in Table 1. In one case (SDSS J134134) there is an IRAC detected neighbor at 8′′ from the AGN; well within the SPIRE PSF. Using SDSS-DR9 we identify this source as a galaxy. At such an angular separation, there is no way to use the prior-based method by itself to tell which of the two is contributing more to the observed FIR flux. We note however that the DR9 spectrum of the galaxy resembles an early type red galaxy with estimated , i.e. very low specific SFR (sSFR). We also note that assuming most of the Herschel flux is from this source, the derived rest-frame SED, in particular flux ratio F(327m)/F(163m), is not consistent with any known starburst template. It is more plausible that most or perhaps all of the observed flux is due to the AGN.
All the six offset sources were observed by Spitzer. Three of those have no nearby neighbors and two others have Spitzer detected sources within a distance of 3 Herschel PSFs from the location of the AGNs. The Herschel images are entirely consistent with these neighbors being the sources of the FIR emission. Thus all these five sources remain in the offset category which we consider as non-detection. We did not include these objects in the stacking analysis since there is some residual flux at the AGN location because of the large PSF. One of the targets (SDSS J1654) clearly shows a Spitzer source near the SDSS location of the AGN. The prior analysis of this case results in a satisfactory solution with AGN FIR flux consistent with real detection. Thus, the final numbers in our sample are 10 detections, 5 offsets and 29 upper limits.
Finally, we note again that while the uncertainties are mostly due to source confusion, with small additional instrumental noise, the use of priors considerably reduce these uncertainties. In the table w keep the listed uncertainties as they are and hence, in a couple of sources, the measured fluxes fall below the nominal level yet they are highly significant.
2.6 measurements
The assumption we make in determining of individual sources is that almost all the FIR emission is associated with SF in the host galaxy. This is based on various earlier papers that investigated this issue in detail, e.g Netzer et al. (2007), Schweitzer et al. (2006) and Rosario et al. (2012). The evidence for this is discussed in detail in §3.2 and the following is a description of the procedure used to subtract the residual AGN contribution to the Herschel observation.
To estimate the likely contribution of AGN-heated dust, we assume that this comes from the central torus and made use of the published Mor & Netzer (2012) composite NIR-MIR SED. The 1–35m part of this composite spectrum was obtained by fitting a large number of intermediate luminosity, type-I AGNs with a complex model that includes a clumpy torus, hot pure graphite dust and dust emission from the narrow line region (NLR). The characteristics of this composite are a sharp rise between 1 and 2m, a wide plateau (in terms of ) between about 2 and 20 m, two broad silicate emission features, and a significant drop above 20-25m. We extended the composite to 0.5m using the data in Richards et al. (2006) and to longer wavelengths using a 100K gray-body. Mullaney et al. (2011) carried out a similar analysis using a different fitting procedure that does not take into account the NLR dust and the hot dust and employs a different procedure to subtract the SF contribution. Their mean MIR spectrum is similar to Mor & Netzer (2012) up to about 20m but suggests a drop in at longer wavelengths of about 30–40m.
The Mor & Netzer (2012) composite was normalized to the optical-UV continuum of the sources in their sample. This composite represents intermediate luminosity type-I AGNs with a total covering factor () of hot (graphite) and warm (torus) dust of . For such sources, , suitable for . We also estimated that for our sources, . The combination of all these factors result in . As shown in numerous papers (e.g. Maiolino et al., 2007; Mor & Trakhtenbrot, 2011; Ricci et al., 2013, and references therein), there is a general tendency for the covering factor of the torus to decrease with AGN luminosity, albeit with a large scatter. This suggests that the assumption of is likely to overestimate the NIR-MIR emission in our sample of very luminous objects. Thus, the above scaling of m relative to is probably an upper limit to the emission at 40m and even more so at 43m, the rest-frame wavelength corresponding to the 250m Herschel band.
The 10 individual SEDs are shown in Fig. 1. For the uncertainties on individual points, we made use of the numbers listed in Table 1. These are typically small uncertainties, 20% and occasionally even smaller, which reflect only the instrumental noise and the confusion limit. For the purpose of the fit, we do not allow any of the uncertainties to go below 0.1 dex. As for the 250m bin, we added the observational uncertainty from the table and the one due to AGN-heated dust in quadrature. In 3 of the sources (J0807, J1433 and J1654) this makes the uncertainty considerably larger which affects the SED fitting.
The diagram shows several possible fits to the data. The blue curves are starburst templates from the Chary & Elbaz (2001) SED library of SF galaxies. Such templates fit very well 9 of the 10 SEDs. The red curve shown in the diagram is the mean SED for the most luminous SMGs in the Magnelli et al. (2012) sample (B. Magnelli, private communication) scaled up or down to fit the data. This SED gives satisfactory, albeit not as good fits to the same 9 sources We note that the FIR luminosities of these SMGs are below the luminosities of most of our sources. Given the trend of higher mean dust temperature with higher discussed in detail below, we suspect that higher luminosity SMG SEDs would be closer in shape to our sources. The derived values of using this template are basically indistinguishable from the previous method, given the uncertainties. We also used the Magnelli et al. (2012) SED to fit only the 350m and 500m bands in order to avoid the shortest wavelength band, where the AGN contribution is more uncertain. These values are typically 0.05 dex below the value obtained by fitting all three bands except for the two cases showing the steep rising SED (J1619 and J1654) where they are 0.16 dex and 0.1 dex respectively.
The diagram also shows, in green curves, several gray-body SEDs. The top left panel shows the case of a T=40K SED fitted to the longest wavelength point (m) assuming that at such a long wavelength the AGN contribution to the heating of the dust is negligible. This SED is in clear contrast to the Magnelli et al. (2012) SED shown here and many luminous starburst SEDs observed by Herschel and other missions (see the detailed discussion in §3.2). We consider the SFR obtained from such an SED fit to the data, which is typically a factor 2 below the one derived from our best fits (see column 10 in Table 2), to be well below the real SFR in pure starburst systems of similar L(86m). In the top right panel we show two examples of gray-body fits to the only SED which could not be fitted by the other templates. The cases shown are and T=60K (solid green line) and T=50K (dashed green line). The two give satisfactory fits to our data given the under-estimated error bars we use. As discussed below, the derived mean dust temperatures in the most luminous starburst systems are also in the same range of temperatures.
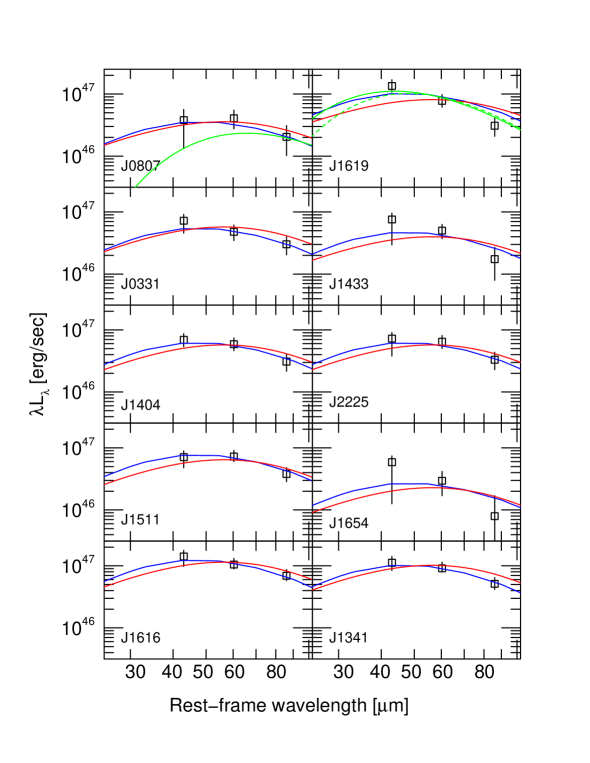
As a test of the measured , we also fitted gray-bodies with various values of dust temperature and the FIR SED of all the 10 sources. The fit quality is similar to the one obtained from the SF template fit but we prefer not to use it since there is no real meaning to a single temperature dust.
The formal errors in the Chary & Elbaz (2001) template SED fit is typically very small, of order 25% or less. However, the real uncertainty due to the various assumptions on the SED shape, must be much larger and we estimate them to be 0.2 dex. These more realistic uncertainties are the ones used in the maximum likelihood analysis described below.
Finally, we also fitted T=40K gray-bodies to to the 500/m band in all 10 sources to get an idea about the absolute minimum SFR which cannot be influenced by the central AGN. Such depend on the assumed value of and for and are typically a factor 2 below the ones measured from our other fits. As discussed below in great detail, such dust temperatures are below those measure in pure starburst systems with SF luminosities that are in the same range as measured here. Raising the dust temperature to 45K, which is more in accord with high luminosity starburst systems, reduces the mean difference with our fitted values to less than 0.2 dex, similar to the general uncertainty we adopt in the rest of the analysis.
Table 2 lists all the measured luminosities of all detected sources using the various assumptions. We also list from the SDSS spectroscopy, from our H-band spectroscopy, derived from , and and from T11. For the SFR, we use a standard conversion factor based on Chabrier (2003) initial mass function (IMF) which gives = for SFR of 1 yr-1. For this ratio, the SFR of the detected sources ranges from 1090 to 4239 yr-1, similar to the values obtained for the most luminous known SMGs (e.g. Riechers et al., 2013)
| Object | b | b | b | b | c | d | e | SFR f | ||
|---|---|---|---|---|---|---|---|---|---|---|
| (SDSS J) | (erg s-1) | (erg s-1) | (erg s-1) | () | (erg s-1) | (erg s-1) | (erg s-1) | ( yr-1) | ||
| 033119.66-074143.1 | 4.729 | 46.76 | 46.55 | 47.09 | 8.83 | 0.08 | 46.92 | 46.89 (46.82) | 46.61 | 2174 |
| 080715.11+132805.1 | 4.885 | 46.71 | 46.53 | 47.07 | 9.24 | -0.35 | 46.72 | 46.74 (46.74) | 46.44 | 1372 |
| 134134.19+014157.7 | 4.689 | 46.87 | 46.73 | 47.26 | 9.82 | -0.74 | 47.17 | 47.14 (47.08) | 46.84 | 3866 |
| 140404.63+031403.9 | 4.903 | 46.55 | 46.49 | 47.02 | 9.51 | -0.66 | 46.97 | 46.89 (46.85) | 46.62 | 2439 |
| 143352.21+022713.9 | 4.722 | 47.14 | 46.84 | 47.37 | 9.11 | 0.09 | 46.87 | 46.79 (46.79) | 46.37 | 1938 |
| 151155.98+040802.9 | 4.670 | 46.62 | 46.32 | 46.86 | 8.42 | -0.26 | 47.02 | 46.94 (46.94) | 46.71 | 2737 |
| 161622.10+050127.7 | 4.869 | 47.08 | 46.80 | 47.33 | 9.43 | -0.27 | 47.21 | 47.19 (47.14) | 46.97 | 4239 |
| 161931.58+123844.4 | 4.806∗ | 46.41 | — | 46.91∗ | — | — | 47.18 | 47.19 (47.03) | 46.62 | 3930 |
| 165436.85+222733.7 | 4.680∗ | 47.14 | 46.48 | 47.60 | 9.55 | -0.64 | 46.62 | 46.49 (46.39) | 46.03 | 1090 |
| 222509.19-001406.9 | 4.890 | 46.97 | 46.70 | 47.23 | 9.27 | -0.21 | 46.97 | 46.89 (46.86) | 46.65 | 2439 |
a Derived from the SDSS spectra.
b Derived by T11 from -band spectroscopy of the Mg ii line.
For objects with asterisks, the redshifts were taken from the SDSS DR7 QSO catalog and was estimated from , following a trend based on the samples of Shemmer et al. (2004) and Netzer et al. (2007a).
c Derived by fitting with Chary & Elbaz (2001) models to the Herschel fluxes as measured at the SDSS source centers and accounting
for priors. The uncertainties of these numbers are discussed in the text and assumed to be 0.2 dex in all cases.
d Derived by fitting the Magnelli et
al. (2012) SMG template to the Herschel fluxes, as measured at the SDSS source centers and accounting for priors.
The values in parenthesis are obtained by fitting only the 350m and 500m data points (see text).
e Derived by fitting a gray-body model with and K to (500m/(1+z)) as described in the text.
f Calculated from the Chary & Elbaz (2001) values of assuming a Chabrier IMF (see text).
2.7 Stacking analysis
Twenty nine sources were not detected above 3- level in any of the Herschel bands. Visual inspection of the images shows no significant emission at the location of the sources and no unusual emission inside the PSF like in the case of the “offset” sources. We consider the fluxes measured for these objects as upper limits.
To get the average of these sources, we applied a stacking analysis to all their images in each band, as detailed in M12. We first cut each image to a small stamp symmetrically around the center of the pixel that contains the optical location of the source. All stamps have an equal number of pixels and are approximately in size. A stacked image is constructed by assigning the images with weights according to their respective exposure times, and averaging the images pixel by pixel. Since the dominant source of uncertainty is the extragalactic confusion noise, the slightly different exposure times have negligible effects on the results. The results of the stacking procedure is a statistically significant signal in all three bands that represents the average flux of the individually undetected sources. We refer to this as the “stacked source” and measure its flux in all three bands in exactly the same way used for the Herschel detected sources.
The average values obtained for the stacked source can be biased if the (undetected) sources have a large spread in their intrinsic luminosities. In such a case, few sources that are just below the confusion noise limit might skew the result towards a higher average flux. To overcome this problem, we used a bootstrap approach to estimate the “true” value of the flux of the stacked source and its uncertainty. Out of the 29 “stamps” in each band, we choose 10000 random multisets of 29 images where each image may appear more than once. We then stacked each multiset and measured the flux of the stacked source.
The averaging of the images assumes that all objects are located at the center of the stamp. Any contribution from neighboring sources would be significantly reduced due to the fact that such contributions are expected to be randomly distributed in the images. To further minimize the effect of such contributions we randomly rotate each image by 90, 180, or 270 degrees before each stacking. The final values of the fluxes in each band are taken to be the maximum likelihood values of the corresponding distributions. The uncertainties on these values are estimated by measuring the 16th and 84th percentiles, which are assumed to represent the 1- error. Examples of the probability distribution functions (PDFs) of the bootstrap procedure, in all three SPIRE bands, including the definitions of the maximum likelihood values and the various percentiles, are shown in M12 Fig. 3. Finally, the uncertainty on the 250m luminosity was added in quadrature to the uncertainty due the possible AGN contribution, exactly as was done for the individual detected sources.
The values of the stacked source are calculated by the same fitting procedure used to measure the individually detected sources. The best value (erg s-1) corresponds to SFR yr-1 and is obtained from fitting the SED with a Chary & Elbaz (2001) template. The best gray-body fit corresponds to T=55K (see Fig. 4). As explained, the contribution due to AGN-heated dust in those sources may be larger which affects mostly the shortest wavelength band.
To further test the properties of the undetected sources, we divide the 26 sources with measured into two equal-number bins in each of the following categories: , , and . The division is done according to the median value of the property in question. For each of the bins we apply the stacking analysis described above. The results are listed in Table 3. There are no significant differences in the mean of the two subgroups in any of the three variables although the two bins show a difference in their stacked 250m flux. The difference is such that the lower objects have lower stacked 250m flux. This may indicate some dependence of on BH mass among the non-detected objects as found between detected and undetected sources (see § 3). The relatively small number of sources in each of the bins prevents us from further testing this suggestion.
| (250m) | The 250m percentiles | (350m) | The 350m percentiles | (500m) | The 500m percentiles | |||||||||||
|---|---|---|---|---|---|---|---|---|---|---|---|---|---|---|---|---|
| Group: | (mJy) | 0.15 | 16 | 84 | 99.85 | (mJy) | 0.15 | 16 | 84 | 99.85 | (mJy) | 0.15 | 16 | 84 | 99.85 | (erg s-1) |
| All non detections | 5.09 | 2.83 | 4.34 | 6.20 | 7.86 | 5.22 | 2.05 | 4.25 | 6.80 | 9.62 | 4.64 | 0.61 | 3.42 | 5.62 | 7.93 | 46.23 |
| low | 5.83 | 1.26 | 4.21 | 6.63 | 8.67 | 7.41 | 0.94 | 4.84 | 8.74 | 11.85 | 4.00 | -1.98 | 2.05 | 5.48 | 8.23 | 46.30 |
| high | 4.59 | 2.29 | 3.85 | 6.28 | 8.66 | 4.15 | 0.57 | 2.86 | 5.61 | 8.83 | 5.01 | -0.65 | 3.44 | 6.74 | 11.21 | 46.23 |
| low | 4.60 | 0.62 | 3.37 | 5.76 | 7.52 | 5.51 | 1.68 | 3.89 | 7.35 | 11.24 | 5.52 | -3.99 | 2.25 | 7.81 | 12.31 | 46.30 |
| high | 6.90 | 3.03 | 5.49 | 7.99 | 10.31 | 6.37 | 0.71 | 4.70 | 9.08 | 11.45 | 4.15 | -0.40 | 2.83 | 4.74 | 6.33 | 46.19 |
| low | 6.22 | 2.95 | 4.97 | 7.25 | 9.80 | 5.88 | 0.21 | 4.27 | 7.92 | 11.10 | 5.12 | -0.13 | 3.36 | 5.76 | 7.65 | 46.30 |
| high | 5.07 | 0.58 | 3.74 | 6.68 | 8.64 | 6.93 | 1.99 | 4.29 | 8.19 | 11.33 | 3.61 | -4.43 | 1.41 | 6.28 | 11.61 | 46.30 |
The groups are defined following the median values of the sample in the various properties: , and The uncertainties on are dominated by the fitted starburst model and are estimated to be to be 0.2 dex.
3 Discussion
3.1 and groups
The main finding of the Herschel FIR observations is that our sample consists of two distinct sub-groups, those detected and those that are undetected by Herschel/SPIRE. In what follows we investigate in detail how these sub-groups are possibly different in several other aspects: BH properties (), AGN accretion properties ( and ) and co-evolution with their host galaxies.
In the following we use luminosity proxies like and which are directly obtained from the H-band and SDSS spectroscopy and do not involve uncertainties related to the bolometric correction factor. The and distributions of the detected and undetected sources are shown in Fig. 2. They exhibit clear separations in both properties; trends that could not be found by M12 because of the smaller sample size available at that time (5 detections and 20 non-detections). We conducted two-sided Kolmogorov-Smirnov (K-S) tests to compare , various AGN luminosity indicators and of the detected and undetected sources. The distributions of for the two sub-groups are significantly different (p=0.005) where the detected Herschel sources are showing higher . As for AGN luminosity, the test shows that the two groups are significantly different (p=0.006) with the detected sources having the higher . A similar analysis using instead of gives very similar results. Finally, the K-S test for shows no significant difference between the groups.


Next we consider the mean properties of the two groups. Since the groups are small, and the uncertainties quite large, we prefer to use a statistical method that takes into account the individual uncertainties on mass and luminosity and the cumulative distribution functions (CDFs) of these properties. We assigned to all objects a 0.3 dex uncertainty on and and a 0.1 dex uncertainty on and . Regarding , similar to the case of individually detected sources, the uncertainties are mostly due to the choice of the SF template and are estimated to be 0.2 dex. We use the 16th and 84th percentiles from the stacking analysis of the 350m images and added to it, in quadrature, the 0.2 dex due to the model uncertainty. We then used a bootstrap resampling Monte-Carlo (MC) method, with 10000 simulations, that allows us to draw every object many times assuming all uncertainties are normally distributed. The results are the 16th, 50th and 84th percentiles of the distributions (note again that we prefer this over a simple mean because we are after the range of properties represented in these groups rather than the scatter in properties). For high accuracy measurements, the 50th percentile is almost identical to the median. At large uncertainties, however, the two can differ substantially and the resampled sample follows the CDF much better. The values obtained in this way are listed in Table LABEL:tab:most_likely and the two CDFs for the BH mass in the groups are shown in Fig. 3
Before continuing the analysis we comment on the - correlation and its dependence on the method used to obtain BH masses. We are using the “virial” (single-epoch) mass estimate method which, for the sample in questions, assumes FWHM(Mg ii )2. The justification and rational for this is approach are detailed in numerous earlier publications, most recently in Trakhtenbrot & Netzer (2012). We checked the distribution of FWHM(Mg ii ) against in our sample and found no significant correlation between the two. Thus, it can be argued that the separation into two groups is a direct result of the assumed dependence of on . This suggestion is not in conflict with the basic premise that the emissivity- weighted size of the broad emission line region (BLR) is controlled by the radiation field of the source and we are looking at a virialized system. Under such conditions, there is indeed a direct connection between the central BH mass and . Thus, for a sample where FWHM(Mg ii ) is independent of , indeed scales with the source luminosity.
We carried out a similar maximum likelihood analysis to obtain the mean observed fluxes of the groups in the two Spitzer bands, two WISE bands and the three Herschel bands. These values are the ones used in the SED analysis discussed below.
| Property | 9 detected sources | 26 undetected sources |
|---|---|---|
| (erg s-1) | ||
| (erg s-1) | ||
| (erg s-1) | ||
| (erg s-1) | ||
| () () | ||
| () |
a The assumed uncertainties on individual measurements are: for detected sources, 0.3 dex on and , 0.1 dex on and , and 0.2 dex on and . For , this is larger than in Tables 2 & 3 since it reflects also the uncertainty on the model rather than the fitting procedure itself. For undetected sources, same uncertainties on all quantities except for where we used the percentiles obtained for the 350m stacked image together with the individual 0.2 dex uncertainty.
3.2 Broad band SEDs
3.2.1 Median spectra and global SED shape
We compared the mean monochromatic luminosities of the two groups across the entire wavelength range available to us: SDSS spectroscopy corresponding to rest-frame 900–1630Å, H-band (rest-frame 2530–3160Å) and K-band (rest-frame 3480–4310Å) spectroscopy from T11, Spitzer photometry (effective rest frame wavelengths of 6120 and 7760Å), WISE photometry (effective rest-frame wavelengths of 5780Å, 7758Å, and 1.99m) and the Herschel photometry. The objects used in this analysis are only those with measured BH mass and Spitzer observations, i.e. 9 detected and 24 undetected sources. We combined all the available information for all objects in both groups even if they do not have K-band data444Of the 40 objects in T11, 24 have K-band spectroscopy. Six of those are Herschel-detected with Spitzer observations, 17 Herschel-undetected with Spitzer observations, and one Herschel-undetected with no Spitzer data..
We experimented with three different ways of combining the optical data: median spectra, simple mean and geometrical mean (averaging their ). We prefer the geometrical mean that is not biased by a small number of outliers (in terms of luminosity) and, at the same time, does a better job in reducing the noise of individual measurements. The geometrical mean and median spectra are quite similar but the signal-to-noise (S/N) in the first is somewhat higher. For the Spitzer bands, and the 2-WISE short wavelength bands, we used the resampling MC method to estimate the 50th percentile fluxes in both groups. For the longer wavelength WISE band (11.6m) we used the same method combined detections and non-detections. This results in a significant 11.6m detection for the group of 9 Herschel detected sources and a point which is consistent with L(11.6m)=0 in the other group.
As for the Herschel observations, we tried a variety of model SEDs. For the detected sources excluding 161931.58+123844.4 (which does not have a BH mass measurement), we used the maximum likelihood method with its 16th and 84th percentiles and included the possible AGN contribution to the 250m band. This results in a statistically significant fit with =erg s-1. The Magnelli et al. (2012) SED with the same also goes through the three points. We can also obtain satisfactory fits for a T=60K gray-body with =erg s-1 or lower temperature larger gray-bodies with very similar .. Finally, a T=40K gray-body fit to the 500m band, as attempted for the individual sources, gives an unsatisfactory fit with =erg s-1.
For the Herschel-undetected sources, we used the results of the stacking analysis but increased the uncertainty on the 250m flux according to the assumed AGN contribution. This resulted in a satisfactory SF template fit with =erg s-1. This value is % lower than the one obtained for the case with no AGN contribution lower than the one obtained for the case with no AGN contribution. A T=55K gray-body with =erg s-1 also provides a good fit. Finally, the T=40K gray-body fit to the 500m flux gives an unsatisfactory fit with =erg s-1.
The various SEDs discussed above are shown in Fig. 4. The SF template SEDs are plotted in blue and the gray-body SEDs in green. For the detected sources we also show, in gray color, the Magnelli et al. (2012) SED normalised to the same as the template SF SED.
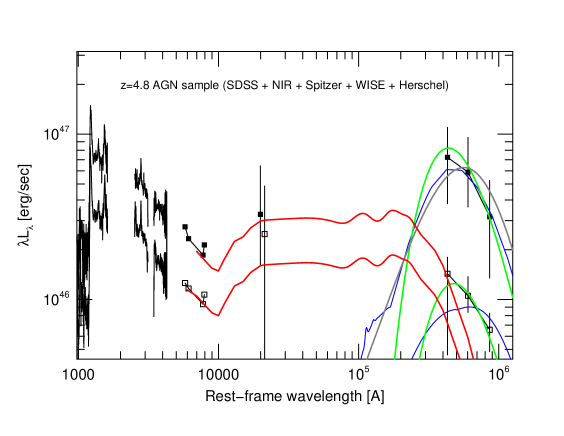
We also plot the normalized mean MIR spectrum from Mor & Netzer (2012) extended to shorter and longer wavelengths as described in §2.6.
The fitting of the FIR data of individual Herschel-detected sources was discussed in §2.6 and illustrated in Fig. 1. Here we comment on the general trend of increasing mean dust temperature with and the distance from the MS as reflected in our sample. The discussion is more relevant to the overall shape of the SED, and its peak, since fitting the FIR observations by a single temperature gray-body is obviously over simplified.
Recent studies of Spitzer-detected and Herschel-detected high SFR sources established the great similarity of the FIR SED of SF galaxies, starburst galaxies and AGNs of the same FIR luminosity. They also show the general trend of increasing mean dust temperature with increasing SFR. Schweitzer et al. (2006) and various papers since used Spitzer data to show that the FIR SEDs and L(PAH)/L(FIR) are both very similar in AGNs (mostly PG quasars) and ULIRGs of the same redshift and FIR luminosity. This suggests the SF origin of the FIR emission in these AGN-dominated and SF dominated sources. Two more recent studies, by Magnelli et al. (2013) and Symeonidis et al. (2013), focus on typical SF galaxies (mass sequence galaxies, MS, see more details in § 3.3.2) at all redshifts up to . They demonstrate the steady increase in mean dust temperature with SFR reaching TK at high SFR and high redshift (that are still well below the redshift and luminosity in our sample). Regarding objects above the MS, thought to be powered by powerful starbursts whose origin is related to major galaxy mergers, the increase in mean dust temperature is even more noticeable. For example, Magnelli et al. (2012) studied a large group of SMGs showing that the mean dust temperature is increasing with reaching peak luminosity () at around rest-frame wavelength of 55m. This can be translated to dust temperature larger than 50K (depending on the assumed ) at the highest luminosity end where erg s-1, about 0.15 dex below the median FIR luminosity of our Herschel-detected sources. Study of SMGs at somewhat higher redshifts and similar luminosities by Roseboom et al. (2012) reaches similar conclusions. Finally we note that Magdis et al. (2010) also found very high dust temperature, reaching 60K, in a sample of ULIRGs but in this case the trend with FIR luminosity is much weaker.
Out of the 11 SMGs in the Magnelli et al. (2012) group of the highest FIR luminosity sources, two show weak AGN emission with two orders of magnitude below the AGN luminosity in our sample. There is no way such AGNs can contribute more than a few percent to the FIR luminosity of these objects. The 9 other SMGs show no hint for an AGN emission confirming, again, the suggestion of SF-heated dust. As Fig. 1 shows, a scaled version of the Magnelli et al. SED, fits well the FIR SEDs of our Herschel-detected sources allowing for the hot AGN dust contribution to the shortest wavelength point in three of the sources (see details in §2.6). A 50K gray- body with and a 60K gray-body with also provide adequate fits to the mean spectra shown in Fig. 4.
There is further confirmation of high temperature dust, with FIR SED similar to the one observed in our sample, in several high SFR, high-z sources that do not show any sign of AGN activity. Examples are a sources found by Riechers et al. (2013) (TK) and several lensed starburst systems studied by Weiß et al. (2013), with and TK. Thus the FIR SEDs of our Herschel-detected sources allowing for the small hot AGN dust to the 250m bin in 3-4 of the sources, and the derived peaks of the rest-frame , are indistinguishable from those of similar FIR luminosity sources with no sign of AGN activity.
Finally, as explained in the previous section, this may not be the case in all of the undetected sources. In some of those, most likely the fainter ones, AGN-heated dust can contribute more to the 250m and perhaps even the 350m emission. This possibility cannot be ruled out given only a single stacked spectrum. The limit obtained in the previous sections from fitting the stacked 500m flux with a 40K gray body (SFR yr-1, see explanation to Fig. 4) suggests that the uncertainty on the SFR of the stack image due to such contribution is a factor of 2 at most.
3.2.2 Accretion disk models
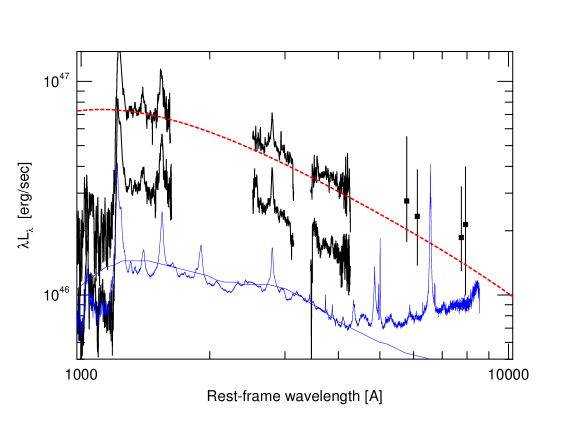
To further investigate the short wavelength parts of the SEDs, we compared them to known AGN composites and to several theoretical accretion disk models. To make a more meaningful comparison, we subtracted the estimated contribution of the H line from the flux in the Spitzer 3.6m band by assuming that the line contributes 25% of the flux in this band (Stern & Laor, 2012). An expanded view of the modified SEDs is shown in Fig. 5. The composite AGN spectra shown in the diagram (blue lines) are taken from Vanden Berk et al. (2001) and Richards et al. (2006). The first one is known to represent well the 1000–5000Å spectrum of many intermediate luminosity AGNs. It drops very steeply shortward of the L line because of the inclusion of many high redshift sources that are affected by inter-galactic absorption, and flattens longwords of about 5500Å because of the host galaxy contribution in the spectrum of lower luminosity, lower redshift sources. The second is representative of more luminous SDSS AGNs hence the galaxy contribution is less noticeable. As seen in the diagram, both composites are considerably different from the mean SEDs of the sources studied here over the common rest-frame wavelength.
A plausible origin of the UV-optical continuum of luminous AGNs is emission by optically thick, geometrically thin accretion disk. This has been studied in numerous papers (see Blaes (2007) for a review) yet the comparison with the observations is still ambiguous. In particular, there are many low and intermediate luminosity AGNs where the observed, galaxy subtracted SED deviates considerably from the predicted thin accretion disk spectrum. There are also large uncertainties to do with the host galaxy contribution at long wavelengths.
The sources studied here are very luminous and reside in host galaxies with high SFR and very little, if any, old stars that contribute significantly to the spectrum around 0.5–1m. This assures a dominant AGN contribution over the entire rest-frame range of 1000–8000Å and enables a much cleaner comparison with accretion disk models. To check this more quantitatively, we calculated several disk spectra using the code developed by Slone & Netzer (2012) who studied disk SEDs in the presence of fast disk outflows (the results shown here do not include disk winds). The face-on spectrum of one such disk model, with no mass outflow, =, ( is the BH spin) and =0.5, is shown in Fig. 5. The theoretical spectrum is in very good agreement with the mean SED of the Herschel-detected sources whose mean and are in turn very similar to the model parameters, except for the unknown spin. To the best of our knowledge, no previous AGN SED study shows such a good agreement between observed and computed accretion disk spectra. For example, the recent work of Landt et al. (2011) makes a detailed comparison of this type for several low luminosity AGNs but their fits are model dependent because of the various assumptions about the host galaxy contribution and the unknown rest-frame UV part of the spectrum. Additional information on the long wavelength spectrum of AGN disks can be found in Kishimoto et al. (2007) who studied the polarized spectrum of several objects. The long wavelength parts of these spectra are similar to the predicted disk spectrum but, again, these data do not extend to short enough wavelength to verify the predicted flattening part of the disk SED. The very high redshift sources in our sample, and the combined SDSS and H and K-band spectra, provide a unique opportunity to study such disks over a very wide wavelength bands and suggest a very good agreement with the models.
The above comparison is not meant to address in detail the optical-UV spectra of high BH mass AGNs (which is the subject of a forthcoming paper). The purpose is to check two mean SEDs with a considerable range of properties within each group. One should also be aware of the fact that the high of most of the sources may be in odds with the conditions normally assumed for thin accretion disks.
3.3 Stellar mass BH mass and star formation at
3.3.1 and at
The main premise of our work is that the sources represent the parent population of the most massive BHs, those reaching a mass of in the local universe. Such objects have now been observed in a small number of local galaxies associated with rich and massive galaxy clusters (e.g. McConnell et al., 2012, and references therein). As demonstrated in T11 (Figs. 6 and 8 there), this assumption connects the population to the more massive BHs that power the most luminous AGNs at and discussed in detail in T11. Under this hypothesis, additional BH growth from to (about yr) and (about yr) requires a mean duty cycle of 0.1–0.2 if the growth is linear (constant ) and about 0.05–0.1 if it is exponential (constant ).
A major finding of the present work is the link between , and . This was not found by M12 who analyzed a smaller sub-sample that included 5 detected and 20 undetected sources. M12 considered various possible scenarios to explain the properties of the sources. Their preferred explanation included a population of sources with similar BH mass and AGN luminosity. In this scenario, the undetected sources are those that already finished their most active phase, related to a merger of large, similar mass galaxies, and are starting their post-starburst phase, possibly in secularly evolving systems. According to this explanation, the mean in the group of undetected sources should equal or exceed the mean of the detected sources, in clear contrast with the present finding.
Here we propose two alternative scenarios that are different from the ones presented by M12, and are related to the presence or absence of AGN feedback. These are by no means the only possibilities and the reader is referred to other papers, (e.g. Aird et al., 2012; Bongiorno et al., 2012), addressing the connections between BH and stellar masses, albeit at much lower redshifts and much less robust determination of and .
Both explanations suggested here are based on the assumption that all the objects in our sample reach with basically the same properties like stellar mass, BH mass and accretion rate. The first explanation assumes that AGN feedback is very rare or inefficient in massive objects, like those in our sample, at , and does not affect the AGN and stellar mass evolution. The suggestion is that the active BHs reside in galaxies of different SFRs, possibly because of various ongoing interactions. For BHs that are hosted in lower SFR galaxies, the amount of cold gas available for SF and for BH accretion is smaller than in the other, higher SFR objects. This results in lower and slower BH growth. Other objects are hosted in systems where cold gas is more abundant. Such objects increase both their stellar and BH mass at a faster rate. Over time, the mass of the BHs in the second group will considerably exceed the mass of the BHs in the first group. Assuming uninterrupted, BH exponential growth, and using the median values of listed in Table LABEL:tab:most_likely, we can estimate that the time requires to establish the mass difference between the two groups is yr. This is shorter than the difference in cosmic time between the lowest and the highest redshift objects in our sample.
The second possibility requires AGN feedback in some but not all objects. The differences depend on the local conditions, most likely the geometry of the interaction. In this scenario, all objects start in galaxies that undergo violent mergers, and extreme SF, with rates comparable to the ones measured in the group of Herschel-detected sources. The geometry of the merger, in particular the location of the cold gas is such that in most objects the AGN activity affects the surrounding gas, either by photoionization or by fast outflowing winds (mechanical feedback). The result is a large decrease in SFR, by a factor of about 5 (the difference in the mean SFR of the two groups). The majority of the objects in our sample (75%) belong to this group. The remaining 25% are different, possibly due to the different geometry, and/or the mass outflow rate in the vicinity of the BH. These sources undergo no feedback. One can also consider variants of these scenarios, e.g. that all sources start in systems with steady SFR but some of them undergo a major merger at later times which raises both their SFR and BH accretion rate.
Both scenarios considered here link BH and stellar mass growth to the cold gas supply to the system. This naturally explains the connections between , and . We note that the feedback assumed in the second scenario is not efficient enough to shut down completely all the SF or BH accretion in those cases where it has an effect on the evolution of the system. For example, it can shut down SF in the central region but does not affect SF in the outer extended disk. Obviously, we cannot exclude the possibility that similar mass BHs at undergo very efficient feedback that results in dormant BHs in quenched galaxies that cannot be observed at that redshift. Such objects are not present in our sample.
3.3.2 The mass sequence and / at
The terminology used here is drawn from studies of lower redshift SF galaxies, in particular their distribution in the SFR vs. plane. We focus on the mass sequence (or main sequence, MS) introduced first by Noeske et al. (2007), Daddi et al. (2007), and several others. We assume that such a sequence is present also at very high redshift. As shown in the earlier works, and in numerous recent papers (e.g. Rodighiero et al., 2011; Santini et al., 2012; Wuyts et al., 2011a, b; Rosario et al., 2012; Whitaker et al., 2012), for a given , the MS SFR increases with redshift up to about where it flattens and possibly even drops with increasing redshift. The evolution beyond is still a matter of debate with some claims that observational issues such as contamination by strong emission lines, might have affected the earlier results (Stark et al., 2013).
The highest observed at high redshift differs slightly from one study to another depending on the measurement method and various systematic effects. For example, Wuyts et al. (2011a) and Wuyts et al. (2011b) show that at , = which corresponds to SFR yr-1. Other papers give, for a similar redshift and =, lower SFR of about 400 yr-1. The largest stellar masses at , where such measurements are still feasible, are about (e.g. Marchesini et al., 2009)). There are several SFR and estimates at even higher redshift, (e.g. Lidman et al., 2012, and references therein), but these are for much lower stellar mass galaxies. Numerical simulations, like the ones reported in Khandai et al. (2012), are inconclusive about this issue with some suggestion that the largest stellar mass beyond cannot exceed . In the following, we follow the assumption that the MS at is similar to the one observed at but note that the numbers derived under this assumption for may well represent upper limits. The SFR for the assumed MS is about 100 yr-1 for = and the slope in the range 0.5-0.7..
There are several possibilities regarding the location of the sources relative to the MS (which we assume exists at this redshift), but none can be proven at this stage. One possibility is that all sources are on the MS with unknown stellar masses or with stellar mass at the high mass end mentioned above. Regarding the Herschel-detected sources, this idea seems to be in conflict with the suggestion of little or no evolution at since at lower redshift, galaxies with SFRs as high as measured by us are located well above the MS. Moreover, as shown in Riechers et al. (2013), non-active galaxies at with SFR similar to those of the detected sources, show clear signs of starburst activity.
Another possibility is that the undetected sources are on the MS and the detected ones are in starburst, possibly merging systems above the MS, as is often seen at lower redshift (e.g. Rodighiero et al., 2011; Sargent et al., 2012). Given the problematics of the first hypothesis, we only explore the consequences of the latter case combined with the assumption that is as discussed above, i.e. the highest possible at this redshift. The unknown stellar mass at , does not justify, in our opinion, to explore a larger range of possibilities.
Our best estimate of the mean SFR in the group of 29 Herschel-undetected sources is 400–440 yr-1. Assuming these are all MS source with . and using the median measured value of for this group (), the mean / is about 450. The uncertainty on this number is at least as large as the one derived from the mean width of the MS at high redshifts (Whitaker et al., 2012; Rodighiero et al., 2011, e.g.), which is about dex. As for the detected sources, if their stellar mass is the largest at this redshift, i.e. similar to the stellar mass of the undetected sources, we can thus guess that their mean / is smaller by about a factor 3, similar to the difference in the mean of the two groups. This translates to /. The entire range of /, 150–450, is similar to the ratio observed in the local universe for the most massive BHs.
3.4 Black hole and stellar mass evolution from to 2.4
The larger sample size, and the division into two , and/or groups, allow us to consider in some detail the instantaneous and cumulative growth of the BH and stellar masses in our sample.
3.4.1 Instantaneous BH and stellar mass growth: vs.
As already mentioned in §1, the correlation (or lack of) between and has been debated extensively in the literature, see e.g. Netzer et al. (2007); Netzer (2009); Shao et al. (2010); Rosario et al. (2012); Harrison et al. (2012); Page et al. (2012). The work of Rosario et al. (2012) summarizes many of the earlier results and used Herschel-based measurements to illustrate the redshift dependence of this relationship and the transition from no correlation to a fix slope correlation typical of AGN dominated sources () described in Netzer (2009). Several attempts to explain this behavior are discussed in Neistein & Netzer (2013).
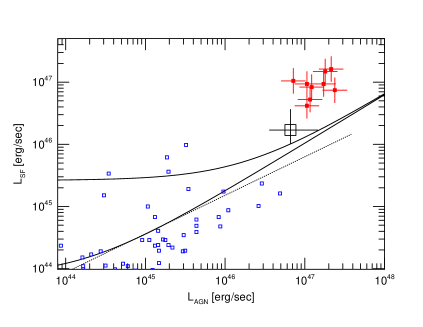
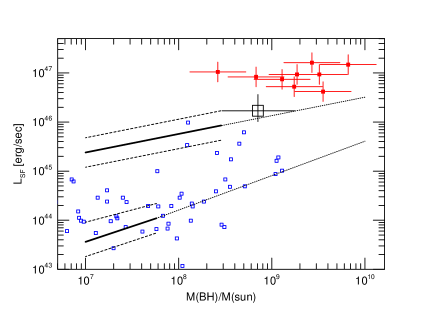
Fig. 6 shows the location of our sources in the - plane. It also shows several curves from Rosario et al. (2012) for and sources555The curves were taken from Rosario et al. (2012) and scaled up by a factor 2 to allow for the difference between L(60m) used in that paper and used here and 68 AGNs with measured L(FIR) from the work of Mor & Netzer (2012), mostly local intermediate luminosity objects. The local sources are quite similar in their properties to the brighter X-ray selected AGNs used in Rosario et al. (2012) but they do not represent a complete or flux limited sample and are shown for illustration purpose only. We also show a line based on Wang et al. (2011) which fits the most FIR luminous (as of 2011) high-z sources. This line is similar but somewhat shallower than the relationship suggested by Netzer (2009). We purposely avoid a comparison with very high-z sources observed at mm-wavelengths, e.g. the sample of Omont et al. (2013), because of the unknown level of completeness of such samples.
To continue, we assume a simple conversion of mass accretion to with efficiency (the preferred value used here is 0.1). We also assume the conversion of SFR to with efficiency (equal to for the assumed IMF). Using this terminology we can write the relative instantaneous growth rate of the stellar mass ()) and BH mass () in the following way:
| (1) |
As seen from Fig. 6, the Herschel-detected sources are all around the location where = indicating (the mean values in Table LABEL:tab:most_likely suggest ). The stacked source representing about 75% of our population is located at somewhat lower and , very close to the correlation line of AGN dominated sources where . Thus, unlike earlier studies at lower redshift, (e.g. Rosario et al., 2012), the most luminous AGNs at are hosted in galaxies with SF luminosity comparable to their AGN luminosity.
We are also in a position to investigate the correlation between and at . This correlation is shown in Fig. 7 and compared, again, with the sample used by Mor & Netzer (2012). The tendency for larger active BHs to be associated with higher SFR is clear from the diagram. This is driven partly by the correlation between and and between and of AGN dominated sources.
Considering the low redshift sources, we can make the simplistic assumption that /=700, similar to the local relationship for bulge-dominated galaxies containing BHs with masses in the range . We then used these derived values of , and the assumption , to compare with the known MS for SF galaxies at low redshift. The expression we used for the MS at is obtained from Whitaker et al. (2012). This relationship is drawn as a straight solid line which goes roughly in the middle of the low redshift AGN distribution suggesting that most of the hosts of these AGNs are MS SF galaxies. The diagram also shows, in dashed lines, the typical width of the MS obtained from Whitaker et al. (2012) and Rodighiero et al. (2011) (about 0.3 dex). We only draw these lines up to the largest measured from Whitaker et al. (2012), thus the largest mass part, reached by the dotted line, is no more than simple extrapolation.
There is no simple way to estimate from for high redshift MS galaxies because the ratio of / has never been directly measured beyond . Nevertheless, for the sake of illustration only, we repeated the same exercise for using again the Whitaker et al. (2012) expressions. The results are shown as the upper straight solid line, with the same range of uncertainty on , extending to the largest known from Whitaker et al. (2012). The dotted line is, again, a simple extrapolation of the solid line. It falls close to the location of the undetected sources and well below the location of all detected sources. This again is consistent with the idea that the detected sources are above the MS at that redshift. We stress, again, that there is no observational justification based on direct measurement of , to this estimate of although some earlier work (e.g. Aird et al., 2012) make such assumptions. Needless to say, there is no observational evidence for stellar masses as large as inferred from the dotted line () at such high redshifts.
3.4.2 Cumulative BH and stellar mass growth
Next we consider the evolution of the population to later times in the history of the universe. For this we integrate and over cosmic and follow the / evolution using various estimated duty cycles for the two processes, and . In particular, we are interested in the evolution between to 2.4 under the assumption, presented in T11, that the BHs studied here represent the population of the most massive BHs in the universe (some of which are not active). The goal is to test the suggestion that these BHs are hosted in the most massive galaxies and that beyond 2.4, the BHs and the host galaxies grow very slowly, or perhaps not at all.
We experimented with both linear (constant and ) and exponential (constant and sSFR) growth. We illustrate the case that both BH groups grew their mass by a factor 5 between and 2.4 and that throughout this period, . The calculations are similar to those discussed by T11 except for the fact that T11 considered individual BHs while here we consider mean properties of two sub-groups. For the linear growth scenario we obtained the following numbers for the mean BH duty cycles: for the Herschel-detected sources and for the undetected sources. The corresponding duty cycles obtained for the exponential growth scenario are and , respectively.
The increase in stellar mass can be expressed as the stellar mass at time () relative to the one at time (). The growth can be linear (constant SFR) or exponential (constant sSFR) and we only illustrate the a case where at = and at the mass is 5 times larger. For exponential growth, we found the following corresponding time: 250 Myr for the Herschel-detected sources (duty cycle of about 0.17) and 1.16 Gyr for the undetected sources (duty cycle of about 0.80). For linear growth we assume
| (2) |
where is a function that takes into account the stellar mass loss during the process. This function decreases from 1 to about 0.5 over a period of Gyr for a Chabrier (2003) IMF. The calculated times are about 1.26 Gyr (duty cycle of about 0.85) for Herschel-detected sources and 5.7 Gyr (duty cycle greater than 1) for the undetected sources. The latter is longer than the available time by a factor of almost 4 thus for these sources the largest stellar mass at is only about , i.e., below the mass of the most massive galaxies in the local universe.
The above numbers for the exponential growth scenarios indicate considerably shorter duty cycles for the BHs. This could in principle be verified by an accurate census of active BHs and SF galaxies in such epochs. However, the predicted final point of exponential growth of the stellar mass corresponds to enormous SFR of the host galaxies, way beyond what we measure at , sometimes between and . We are not aware of any published work that present the observations of such objects. It also involves the assumption that most of this population is not forming stars at (i.e. they are quenched sources). The linear growth combined with the assumption that we are observing MS host galaxies at is marginally consistent with SFR and measurements at (Wuyts et al., 2011a, b). This would mean that the most massive SF galaxies that are on the MS at those epochs are the hosts of the most massive BHs. In principle, this can be verified observationally. Here, again, a more complete census of SF galaxies vs. active BHs will provide a constraint on the relative duty cycles of the two populations.
Finally, we comment on alternative scenarios to reach that are different from the ones discussed here. The BH population observed by us at may be at the end of their BH growth period and will never exceed by much the measured mass of . Another population of active BHs, that is not observed because they are totally obscured at , grows very rapidly and shed their “cocoon” at redshifts 2–3 where they are recognized to have . Such a scenario has received much attention in various theoretical studies (e.g. Hopkins et al., 2006) but is yet to be verified observationally.
4 Summary and conclusions
This paper reports the results of detailed Herschel/SPIRE observations of a unique flux limited sample of 44 optically selected AGNs at known to contain the highest mass super massive BHs at this redshift. This is, so far, the largest narrow redshift range, high- sample observed by Herschel. The observations are supplemented by our own measurements (T11), publicly available SDSS spectra, WISE photometry, our own H-band and K-band spectroscopy, and newly obtained Spitzer/IRAC photometry. A subset of these observations was reported in M12 and the present paper completes the study of the sample.
The results of our study are:
-
1.
Ten of the objects were detected by Herschel with in the range erg s-1 corresponding to SFR in the range 1090–4239 yr-1. Stacking analysis of 29 undetected sources results in significant signals in all the SPIRE bands. The corresponding mean is erg s-1 if no AGN contribution is assumed and erg s-1 if AGN contribution is taken into account. We also tried T=40K gray-body fits to the 500m fluxes only. Such SEDs do not fit the other bands and their is smaller by factors of . The remaining 5 sources show significant emission in the Herschel images that is not associated with the AGNs in the field.
-
2.
There is a clear correlation between BH mass, AGN luminosity and SFR in a sense that the mean and of the Herschel-detected sources are higher than the ones of the undetected sources. The luminosity differences between the detected and undetected sources are seen across the entire spectrum from rest-frame Å to FIR wavelengths.
-
3.
The mean optical-UV SEDs of the two groups are similar to the spectrum of standard geometrically thin, optically thick accretion disks around BHs with the mean observed mass and accretion rates of the objects in those groups.
-
4.
The transitions between MIR and FIR wavelengths in the mean SEDs of two groups are quite different. The Herschel-detected objects show a more noticeable FIR bump and . We see indications of AGN-heated dust in the short wavelength (rest-frame m) bin of three of these sources. The undetected sources have and a smoother, more gradual change from MIR to FIR wavelengths with possibly more contribution by AGN-heated dust at 43m.. Unfortunately, the second result depends on an uncertain WISE photometry that was used to measure the MIR flux.
-
5.
Out of various possible ways to explain the correlations of , and , we chose to emphasize two that seem to agree best with the properties of the sample. The first connects the larger BH mass and AGN luminosity of the Herschel-detected sources to larger supply of cold gas to the entire galaxy and to the central source. This may be related to major mergers in these sources. This scenario requires no feedback to explain the differences between the two groups. The second explanation involves AGN feedback only in the hosts of the undetected sources. Because of the feedback, the sources are already beyond the peak of their SF and BH activity and hence the built-up of stellar and BH mass are slower. However, the hypothetical feedback is not enough to totally quench SF and the overall properties of these host galaxies are consistent with being on the SF MS at .
-
6.
Our measured , and , combined with the assumptions of little or no evolution of the MS at , and mean =, are consistent with the idea that the Herschel-detected sources represent SF galaxies that are above the MS at and most of the undetected sources are on the MS at this redshift. Obviously, this is a rather speculative assumption given the lack of direct stellar mass measurements.
-
7.
Following the population to redshifts 2–3, assuming they end their evolution at those epochs by becoming the most massive BHs in the most massive (quenched) galaxies, lead to duty cycles that are consistent with what is known about AGN and galaxy evolution.
References
- Aird et al. (2012) Aird, J., Coil, A. L., Moustakas, J., Blanton, M. R., Burles, S. M., Cool, R. J., Eisenstein, D. J., Smith, M. S. M., Wong, K. C., & Zhu, G. 2012, ApJ, 746, 90
- Blaes (2007) Blaes, O. 2007, The Central Engine of Active Galactic Nuclei, ASP Conference Series, 373
- Bongiorno et al. (2012) Bongiorno, A., Merloni, A., Brusa, M., Magnelli, B., Salvato, M., Mignoli, M., Zamorani, G., Fiore, F., Rosario, D., Mainieri, V., Hao, H., Comastri, A., Vignali, C., Balestra, I., Bardelli, S., Berta, S., Civano, F., Kampczyk, P., Le Floc’h, E., Lusso, E., Lutz, D., Pozzetti, L., Pozzi, F., Riguccini, L., Shankar, F., & Silverman, J. 2012, MNRAS, 427, 3103
- Chabrier (2003) Chabrier, G. 2003, Publications of the Astronomical Society of the Pacific, 115, 763
- Chary & Elbaz (2001) Chary, R. & Elbaz, D. 2001, The Astrophysical Journal, 556, 562
- Daddi et al. (2007) Daddi, E., Alexander, D. M., Dickinson, M., Gilli, R., Renzini, A., Elbaz, D., Cimatti, A., Chary, R., Frayer, D., Bauer, F. E., Brandt, W. N., Giavalisco, M., Grogin, N. A., Huynh, M., Kurk, J. D., Mignoli, M., Morrison, G., Pope, A., & Ravindranath, S. 2007, The Astrophysical Journal, 670, 173
- Di Matteo et al. (2008) Di Matteo, T., Colberg, J., Springel, V., Hernquist, L., & Sijacki, D. 2008, The Astrophysical Journal, 676, 33
- Di Matteo et al. (2005) Di Matteo, T., Springel, V., & Hernquist, L. 2005, Nature, 433, 604
- Griffin et al. (2010) Griffin, M. J., Abergel, A., Abreu, A., Ade, P. A. R., André, P., Augueres, J.-L., Babbedge, T., Bae, Y., Baillie, T., Baluteau, J.-P., Barlow, M. J., Bendo, G., Benielli, D., Bock, J. J., Bonhomme, P., Brisbin, D., Brockley-Blatt, C., Caldwell, M., Cara, C., Castro-Rodriguez, N., Cerulli, R., Chanial, P., Chen, S., Clark, E., Clements, D. L., Clerc, L., Coker, J., Communal, D., Conversi, L., Cox, P., Crumb, D., Cunningham, C., Daly, F., Davis, G. R., De Antoni, P., Delderfield, J., Devin, N., Di Giorgio, A., Didschuns, I., Dohlen, K., Donati, M., Dowell, A., Dowell, C. D., Duband, L., Dumaye, L., Emery, R. J., Ferlet, M., Ferrand, D., Fontignie, J., Fox, M., Franceschini, A., Frerking, M., Fulton, T., Garcia, J., Gastaud, R., Gear, W. K., Glenn, J., Goizel, A., Griffin, D. K., Grundy, T., Guest, S., Guillemet, L., Hargrave, P. C., Harwit, M., Hastings, P., Hatziminaoglou, E., Herman, M., Hinde, B., Hristov, V., Huang, M., Imhof, P., Isaak, K. J., Israelsson, U., Ivison, R. J., Jennings, D., Kiernan, B., King, K. J., Lange, A. E., Latter, W., Laurent, G., Laurent, P., Leeks, S. J., Lellouch, E., Levenson, L., Li, B., Li, J., Lilienthal, J., Lim, T., Liu, S. J., Lu, N., Madden, S., Mainetti, G., Marliani, P., McKay, D., Mercier, K., Molinari, S., Morris, H., Moseley, H., Mulder, J., Mur, M., Naylor, D. A., Nguyen, H., O’Halloran, B., Oliver, S., Olofsson, G., Olofsson, H.-G., Orfei, R., Page, M. J., Pain, I., Panuzzo, P., Papageorgiou, A., Parks, G., Parr-Burman, P., Pearce, A., Pearson, C., Pérez-Fournon, I., Pinsard, F., Pisano, G., Podosek, J., Pohlen, M., Polehampton, E. T., Pouliquen, D., Rigopoulou, D., Rizzo, D., Roseboom, I. G., Roussel, H., Rowan-Robinson, M., Rownd, B., Saraceno, P., Sauvage, M., Savage, R., Savini, G., Sawyer, E., Scharmberg, C., Schmitt, D., Schneider, N., Schulz, B., Schwartz, A., Shafer, R., Shupe, D. L., Sibthorpe, B., Sidher, S., Smith, A., Smith, A. J., Smith, D., Spencer, L., Stobie, B., Sudiwala, R., Sukhatme, K., Surace, C., Stevens, J. A., Swinyard, B. M., Trichas, M., Tourette, T., Triou, H., Tseng, S., Tucker, C., Turner, A., Vaccari, M., Valtchanov, I., Vigroux, L., Virique, E., Voellmer, G., Walker, H., Ward, R., Waskett, T., Weilert, M., Wesson, R., White, G. J., Whitehouse, N., Wilson, C. D., Winter, B., Woodcraft, A. L., Wright, G. S., Xu, C. K., Zavagno, A., Zemcov, M., Zhang, L., & Zonca, E. 2010, Astronomy and Astrophysics, 518, L3
- Guyon et al. (2006) Guyon, O., Sanders, D. B., & Stockton, A. 2006, The Astrophysical Journal Supplement Series, 166, 89
- Harrison et al. (2012) Harrison, C. M., Alexander, D. M., Mullaney, J. R., Altieri, B., Coia, D., Charmandaris, V., Daddi, E., Dannerbauer, H., Dasyra, K., Del Moro, A., Dickinson, M., Hickox, R. C., Ivison, R. J., Kartaltepe, J., Le Floc’h, E., Leiton, R., Magnelli, B., Popesso, P., Rovilos, E., Rosario, D., & Swinbank, A. M. 2012, ApJ, 760, L15
- Hatziminaoglou et al. (2010) Hatziminaoglou, E., Omont, A., Stevens, J. A., Amblard, A., Arumugam, V., Auld, R., Aussel, H., Babbedge, T., Blain, A., Bock, J., Boselli, A., Buat, V., Burgarella, D., Castro-Rodríguez, N., Cava, A., Chanial, P., Clements, D. L., Conley, A., Conversi, L., Cooray, A., Dowell, C. D., Dwek, E., Dye, S., Eales, S., Elbaz, D., Farrah, D., Fox, M., Franceschini, A., Gear, W., Glenn, J., González Solares, E. A., Griffin, M., Halpern, M., Ibar, E., Isaak, K., Ivison, R. J., Lagache, G., Levenson, L., Lu, N., Madden, S., Maffei, B., Mainetti, G., Marchetti, L., Mortier, A. M. J., Nguyen, H. T., O’Halloran, B., Oliver, S. J., Page, M. J., Panuzzo, P., Papageorgiou, A., Pearson, C. P., Pérez-Fournon, I., Pohlen, M., Rawlings, J. I., Rigopoulou, D., Rizzo, D., Roseboom, I. G., Rowan-Robinson, M., Sanchez Portal, M., Schulz, B., Scott, D., Seymour, N., Shupe, D. L., Smith, A. J., Symeonidis, M., Trichas, M., Tugwell, K. E., Vaccari, M., Valtchanov, I., Vigroux, L., Wang, L., Ward, R., Wright, G., Xu, C. K., & Zemcov, M. 2010, Astronomy and Astrophysics, 518, L33
- Hopkins et al. (2006) Hopkins, P. F., Hernquist, L., Cox, T. J., Di Matteo, T., Robertson, B., & Springel, V. 2006, The Astrophysical Journal Supplement Series, 163, 1
- Isaak et al. (2002) Isaak, K. G., Priddey, R. S., McMahon, R. G., Omont, A., Peroux, C., Sharp, R. G., & Withington, S. 2002, Monthly Notices of the Royal Astronomical Society, 329, 149
- Khandai et al. (2012) Khandai, N., Feng, Y., DeGraf, C., Di Matteo, T., & Croft, R. A. C. 2012, MNRAS, 423, 2397
- Kishimoto et al. (2007) Kishimoto, M., Hönig, S. F., Beckert, T., & Weigelt, G. 2007, Astronomy and Astrophysics, 476, 713
- Landt et al. (2011) Landt, H., Bentz, M. C., Peterson, B. M., Elvis, M., Ward, M. J., Korista, K. T., & Karovsaka, M. 2011, in Narrow-Line Seyfert 1 Galaxies and their Place in the Universe
- Leipski et al. (2010) Leipski, C., Meisenheimer, K., Klaas, U., Walter, F., Nielbock, M., Krause, O., Dannerbauer, H., Bertoldi, F., Besel, M.-A., de Rosa, G., Fan, X., Haas, M., Hutsemekers, D., Jean, C., Lemke, D., Rix, H.-W., & Stickel, M. 2010, Astronomy and Astrophysics, 518, L34
- Leipski et al. (2013) Leipski, C., Meisenheimer, K., Walter, F., Besel, M.-A., Dannerbauer, H., Fan, X., Haas, M., Klaas, U., Krause, O., & Rix, H.-W. 2013, ApJ, 772, 103
- Lidman et al. (2012) Lidman, C., Hayes, M., Jones, D. H., Schaerer, D., Westra, E., Tapken, C., Meisenheimer, K., & Verhamme, A. 2012, MNRAS, 420, 1946
- Lutz et al. (2008) Lutz, D., Sturm, E., Tacconi, L., Valiante, E., Schweitzer, M., Netzer, H., Maiolino, R., Andreani, P., Shemmer, O., & Veilleux, S. 2008, The Astrophysical Journal, 684, 853
- Magdis et al. (2010) Magdis, G. E., Elbaz, D., Hwang, H. S., et al. 2010, MNRAS, 409, 22
- Magnelli et al. (2012) Magnelli, B., Lutz, D., Santini, P., et al. 2012, A&A, 539, A155
- Magnelli et al. (2013) Magnelli, B., Popesso, P., Berta, S., et al. 2013, A&A, 553, A132
- Mainieri et al. (2011) Mainieri, V., Bongiorno, A., Merloni, A., Aller, M., Carollo, M., Iwasawa, K., Koekemoer, A. M., Mignoli, M., Silverman, J. D., Bolzonella, M., Brusa, M., Comastri, A., Gilli, R., Halliday, C., Ilbert, O., Lusso, E., Salvato, M., Vignali, C., Zamorani, G., Contini, T., Kneib, J.-P., Le Fèvre, O., Lilly, S., Renzini, A., Scodeggio, M., Balestra, I., Bardelli, S., Caputi, K., Coppa, G., Cucciati, O., de la Torre, S., de Ravel, L., Franzetti, P., Garilli, B., Iovino, A., Kampczyk, P., Knobel, C., Kovač, K., Lamareille, F., Le Borgne, J.-F., Le Brun, V., Maier, C., Nair, P., Pello, R., Peng, Y., Perez Montero, E., Pozzetti, L., Ricciardelli, E., Tanaka, M., Tasca, L., Tresse, L., Vergani, D., Zucca, E., Aussel, H., Capak, P., Cappelluti, N., Elvis, M., Fiore, F., Hasinger, G., Impey, C., Le Floc’h, E., Scoville, N., Taniguchi, Y., & Trump, J. 2011, A&A, 535, A80
- Maiolino et al. (2007) Maiolino, R., Shemmer, O., Imanishi, M., Netzer, H., Oliva, E., Lutz, D., & Sturm, E. 2007, Astronomy and Astrophysics, 468, 979
- Marchesini et al. (2009) Marchesini, D., van Dokkum, P. G., Förster Schreiber, N. M., Franx, M., Labbé, I., & Wuyts, S. 2009, ApJ, 701, 1765
- McConnell et al. (2012) McConnell, N. J., Ma, C.-P., Murphy, J. D., Gebhardt, K., Lauer, T. R., Graham, J. R., Wright, S. A., & Richstone, D. O. 2012, ApJ, 756, 179
- Mor & Netzer (2012) Mor, R. & Netzer, H. 2012, MNRAS, 420, 526
- Mor et al. (2012) Mor, R., Netzer, H., Trakhtenbrot, B., Shemmer, O., & Lira, P. 2012, The Astrophysical Journal, 749, L25
- Mor & Trakhtenbrot (2011) Mor, R. & Trakhtenbrot, B. 2011, The Astrophysical Journal, 737, L36
- Mullaney et al. (2011) Mullaney, J. R., Alexander, D. M., Goulding, A. D., & Hickox, R. C. 2011, MNRAS, 414, 1082
- Mullaney et al. (2012a) Mullaney, J. R., Daddi, E., Béthermin, M., Elbaz, D., Juneau, S., Pannella, M., Sargent, M. T., Alexander, D. M., & Hickox, R. C. 2012a, ApJ, 753, L30
- Mullaney et al. (2012b) Mullaney, J. R., Pannella, M., Daddi, E., Alexander, D. M., Elbaz, D., Hickox, R. C., Bournaud, F., Altieri, B., Aussel, H., Coia, D., Dannerbauer, H., Dasyra, K., Dickinson, M., Hwang, H. S., Kartaltepe, J., Leiton, R., Magdis, G., Magnelli, B., Popesso, P., Valtchanov, I., Bauer, F. E., Brandt, W. N., Del Moro, A., Hanish, D. J., Ivison, R. J., Juneau, S., Luo, B., Lutz, D., Sargent, M. T., Scott, D., & Xue, Y. Q. 2012b, MNRAS, 419, 95
- Neistein & Netzer (2013) Neistein, E. & Netzer, H. 2013, ArXiv e-prints
- Netzer (2009) Netzer, H. 2009, Monthly Notices of the Royal Astronomical Society, 399, 1907
- Netzer et al. (2007a) Netzer, H., Lira, P., Trakhtenbrot, B., Shemmer, O., & Cury, I. 2007a, The Astrophysical Journal, 671, 1256
- Netzer et al. (2007) Netzer, H., Lutz, D., Schweitzer, M., Contursi, A., Sturm, E., Tacconi, L. J., Veilleux, S., Kim, D.-C., Rupke, D., Baker, A. J., Dasyra, K., Mazzarella, J., & Lord, S. 2007, ApJ, 666, 806
- Nguyen et al. (2010) Nguyen, H. T., Schulz, B., Levenson, L., Amblard, A., Arumugam, V., Aussel, H., Babbedge, T., Blain, A., Bock, J., Boselli, A., Buat, V., Castro-Rodriguez, N., Cava, A., Chanial, P., Chapin, E., Clements, D. L., Conley, A., Conversi, L., Cooray, A., Dowell, C. D., Dwek, E., Eales, S., Elbaz, D., Fox, M., Franceschini, A., Gear, W., Glenn, J., Griffin, M., Halpern, M., Hatziminaoglou, E., Ibar, E., Isaak, K., Ivison, R. J., Lagache, G., Lu, N., Madden, S., Maffei, B., Mainetti, G., Marchetti, L., Marsden, G., Marshall, J., O’Halloran, B., Oliver, S. J., Omont, A., Page, M. J., Panuzzo, P., Papageorgiou, A., Pearson, C. P., Perez Fournon, I., Pohlen, M., Rangwala, N., Rigopoulou, D., Rizzo, D., Roseboom, I. G., Rowan-Robinson, M., Scott, D., Seymour, N., Shupe, D. L., Smith, A. J., Stevens, J. A., Symeonidis, M., Trichas, M., Tugwell, K. E., Vaccari, M., Valtchanov, I., Vigroux, L., Wang, L., Ward, R., Wiebe, D., Wright, G., Xu, C. K., & Zemcov, M. 2010, Astronomy and Astrophysics, 518, L5
- Noeske et al. (2007) Noeske, K. G., Weiner, B. J., Faber, S. M., Papovich, C., Koo, D. C., Somerville, R. S., Bundy, K., Conselice, C. J., Newman, J. A., Schiminovich, D., Le Floc’h, E., Coil, A. L., Rieke, G. H., Lotz, J. M., Primack, J. R., Barmby, P., Cooper, M. C., Davis, M., Ellis, R. S., Fazio, G. G., Guhathakurta, P., Huang, J., Kassin, S. A., Martin, D. C., Phillips, A. C., Rich, R. M., Small, T. A., Willmer, C. N. A., & Wilson, G. 2007, ApJ, 660, L43
- Omont et al. (2013) Omont, A., Willott, C. J., Beelen, A., Bergeron, J., Orellana, G., & Delorme, P. 2013, A&A, 552, A43
- Ott (2010) Ott, S. 2010, Astronomical Data Analysis Software and Systems XIX. Proceedings of a conference held October 4-8, 434
- Page et al. (2012) Page, M. J., Symeonidis, M., Vieira, J. D., Altieri, B., Amblard, A., Arumugam, V., Aussel, H., Babbedge, T., Blain, A., Bock, J., Boselli, A., Buat, V., Castro-Rodríguez, N., Cava, A., Chanial, P., Clements, D. L., Conley, A., Conversi, L., Cooray, A., Dowell, C. D., Dubois, E. N., Dunlop, J. S., Dwek, E., Dye, S., Eales, S., Elbaz, D., Farrah, D., Fox, M., Franceschini, A., Gear, W., Glenn, J., Griffin, M., Halpern, M., Hatziminaoglou, E., Ibar, E., Isaak, K., Ivison, R. J., Lagache, G., Levenson, L., Lu, N., Madden, S., Maffei, B., Mainetti, G., Marchetti, L., Nguyen, H. T., O’Halloran, B., Oliver, S. J., Omont, A., Panuzzo, P., Papageorgiou, A., Pearson, C. P., Pérez-Fournon, I., Pohlen, M., Rawlings, J. I., Rigopoulou, D., Riguccini, L., Rizzo, D., Rodighiero, G., Roseboom, I. G., Rowan-Robinson, M., Portal, M. S., Schulz, B., Scott, D., Seymour, N., Shupe, D. L., Smith, A. J., Stevens, J. A., Trichas, M., Tugwell, K. E., Vaccari, M., Valtchanov, I., Viero, M., Vigroux, L., Wang, L., Ward, R., Wright, G., Xu, C. K., & Zemcov, M. 2012, Nature, 485, 213
- Priddey et al. (2003) Priddey, R. S., Isaak, K. G., McMahon, R. G., Robson, E. I., & Pearson, C. P. 2003, Monthly Notices of the Royal Astronomical Society, 344, L74
- Ricci et al. (2013) Ricci, C., Paltani, S., Awaki, H., Petrucci, P.-O., Ueda, Y., & Brightman, M. 2013, ArXiv e-prints
- Richards et al. (2006) Richards, G. T., Lacy, M., Storrie-Lombardi, L. J., Hall, P. B., Gallagher, S. C., Hines, D. C., Fan, X., Papovich, C. J., Berk, D. E. V., Trammell, G. B., Schneider, D. P., Vestergaard, M., York, D. G., Jester, S., Anderson, S. F., Budavari, T., & Szalay, A. S. 2006, The Astrophysical Journal Supplement Series, 166, 52
- Riechers et al. (2013) Riechers, D. A., Bradford, C. M., Clements, D. L., Dowell, C. D., Perez-Fournon, I., Ivison, R. J., Bridge, C., Conley, A., Fu, H., Vieira, J. D., Wardlow, J., Calanog, J., Cooray, A., Hurley, P., Neri, R., Kamenetzky, J., Aguirre, J. E., Altieri, B., Arumugam, V., Benford, D. J., Bethermin, M., Bock, J., Burgarella, D., Cabrera-Lavers, A., Chapman, S. C., Cox, P., Dunlop, J. S., Earle, L., Farrah, D., Ferrero, P., Franceschini, A., Gavazzi, R., Glenn, J., Gonzalez Solares, E. A., Gurwell, M. A., Halpern, M., Hatziminaoglou, E., Hyde, A., Ibar, E., Kovacs, A., Krips, M., Lupu, R. E., Maloney, P. R., Martinez-Navajas, P., Matsuhara, H., Murphy, E. J., Naylor, B. J., Nguyen, H. T., Oliver, S. J., Omont, A., Page, M. J., Petitpas, G., Rangwala, N., Roseboom, I. G., Scott, D., Smith, A. J., Staguhn, J. G., Streblyanska, A., Thomson, A. P., Valtchanov, I., Viero, M., Wang, L., Zemcov, M., & Zmuidzinas, J. 2013, Nature, 496, 329
- Rodighiero et al. (2011) Rodighiero, G., Daddi, E., Baronchelli, I., Cimatti, A., Renzini, A., Aussel, H., Popesso, P., Lutz, D., Andreani, P., Berta, S., Cava, A., Elbaz, D., Feltre, A., Fontana, A., Förster Schreiber, N. M., Franceschini, A., Genzel, R., Grazian, A., Gruppioni, C., Ilbert, O., Le Floch, E., Magdis, G., Magliocchetti, M., Magnelli, B., Maiolino, R., McCracken, H., Nordon, R., Poglitsch, A., Santini, P., Pozzi, F., Riguccini, L., Tacconi, L. J., Wuyts, S., & Zamorani, G. 2011, The Astrophysical Journal, 739, L40
- Rosario et al. (2013) Rosario, D. J., Santini, P., Lutz, D., Netzer, H., Bauer, F. E., Berta, S., Magnelli, B., Popesso, P., Alexander, D., Brandt, W. N., Genzel, R., Maiolino, R., Mullaney, J. R., Nordon, R., Saintonge, A., Tacconi, L., & Wuyts, S. 2013, ArXiv e-prints
- Rosario et al. (2012) Rosario, D. J., Santini, P., Lutz, D., Shao, L., Maiolino, R., Alexander, D. M., Altieri, B., Andreani, P., Aussel, H., Bauer, F. E., Berta, S., Bongiovanni, A., Brandt, W. N., Brusa, M., Cepa, J., Cimatti, A., Cox, T. J., Daddi, E., Elbaz, D., Fontana, A., Förster Schreiber, N. M., Genzel, R., Grazian, A., Le Floch, E., Magnelli, B., Mainieri, V., Netzer, H., Nordon, R., Pérez Garcia, I., Poglitsch, A., Popesso, P., Pozzi, F., Riguccini, L., Rodighiero, G., Salvato, M., Sanchez-Portal, M., Sturm, E., Tacconi, L. J., Valtchanov, I., & Wuyts, S. 2012, A&A, 545, A45
- Roseboom et al. (2012) Roseboom, I. G., Ivison, R. J., Greve, T. R., et al. 2012, MNRAS, 419, 2758
- Santini et al. (2012) Santini, P., Rosario, D. J., Shao, L., Lutz, D., Maiolino, R., Alexander, D. M., Altieri, B., Andreani, P., Aussel, H., Bauer, F. E., Berta, S., Bongiovanni, A., Brandt, W. N., Brusa, M., Cepa, J., Cimatti, A., Daddi, E., Elbaz, D., Fontana, A., Förster Schreiber, N. M., Genzel, R., Grazian, A., Le Floc’h, E., Magnelli, B., Mainieri, V., Nordon, R., Pérez Garcia, A. M., Poglitsch, A., Popesso, P., Pozzi, F., Riguccini, L., Rodighiero, G., Salvato, M., Sanchez-Portal, M., Sturm, E., Tacconi, L. J., Valtchanov, I., & Wuyts, S. 2012, A&A, 540, A109
- Sargent et al. (2012) Sargent, M. T., Béthermin, M., Daddi, E., & Elbaz, D. 2012, ApJ, 747, L31
- Schweitzer et al. (2006) Schweitzer, M., Lutz, D., Sturm, E., Contursi, A., Tacconi, L. J., Lehnert, M. D., Dasyra, K. M., Genzel, R., Veilleux, S., Rupke, D., Kim, D.-C., Baker, A. J., Netzer, H., Sternberg, A., Mazzarella, J., & Lord, S. 2006, The Astrophysical Journal, 649, 79
- Shao et al. (2010) Shao, L., Lutz, D., Nordon, R., Maiolino, R., Alexander, D. M., Altieri, B., Andreani, P., Aussel, H., Bauer, F. E., Berta, S., Bongiovanni, A., Brandt, W. N., Brusa, M., Cava, A., Cepa, J., Cimatti, A., Daddi, E., Dominguez-Sanchez, H., Elbaz, D., Schreiber, N. M. F., Geis, N., Genzel, R., Grazian, A., Gruppioni, C., Magdis, G., Magnelli, B., Mainieri, V., Garcia, A. M. P., Poglitsch, A., Popesso, P., Pozzi, F., Riguccini, L., Rodighiero, G., Rovilos, E., Saintonge, A., Salvato, M., Portal, M. S., Santini, P., Sturm, E., Tacconi, L. J., Valtchanov, I., Wetzstein, M., & Wieprecht, E. 2010, Astronomy and Astrophysics, 518, 4
- Shemmer et al. (2004) Shemmer, O., Netzer, H., Maiolino, R., Oliva, E., Croom, S., Corbett, E., & di Fabrizio, L. 2004, The Astrophysical Journal, 614, 547
- Sijacki et al. (2007) Sijacki, D., Springel, V., Di Matteo, T., & Hernquist, L. 2007, Monthly Notices of the Royal Astronomical Society, 380, 877
- Sijacki et al. (2011) Sijacki, D., Springel, V., & Haehnelt, M. G. 2011, Monthly Notices of the Royal Astronomical Society, 414, 3656
- Silverman et al. (2008) Silverman, J. D., Lamareille, F., Maier, C., Lilly, S., Mainieri, V., Brusa, M., Cappelluti, N., Hasinger, G., Zamorani, G., Scodeggio, M., Bolzonella, M., Contini, T., Carollo, C. M., Jahnke, K., Kneib, J. P., Fevre, O. L., Merloni, A., Bardelli, S., Bongiorno, A., Brunner, H., Caputi, K., Civano, F., Comastri, A., Coppa, G., Cucciati, O., de La Torre, S., de Ravel, L., Elvis, M., Finoguenov, A., Fiore, F., Franzetti, P., Garilli, B., Gilli, R., Iovino, A., Kampczyk, P., Knobel, C., Kovac, K., Borgne, J. F. L., Brun, V. L., Mignoli, M., Pello, R., Peng, Y., Montero, E. P., Ricciardelli, E., Tanaka, M., Tasca, L., Tresse, L., Vergani, D., Vignali, C., Zucca, E., Bottini, D., Cappi, A., Cassata, P., Fumana, M., Griffiths, R., Kartaltepe, J., Marinoni, C., McCracken, H. J., Memeo, P., Meneux, B., Oesch, P., Porciani, C., & Salvato, M. 2008, The Astrophysical Journal, 696, 17
- Slone & Netzer (2012) Slone, O. & Netzer, H. 2012, MNRAS, 426, 656
- Springel et al. (2005) Springel, V., Di Matteo, T., & Hernquist, L. 2005, Monthly Notices of the Royal Astronomical Society, 361, 776
- Stark et al. (2013) Stark, D. P., Schenker, M. A., Ellis, R., Robertson, B., McLure, R., & Dunlop, J. 2013, ApJ, 763, 129
- Stern & Laor (2012) Stern, J. & Laor, A. 2012, MNRAS, 426, 2703
- Symeonidis et al. (2013) Symeonidis, M., Vaccari, M., Berta, S., et al. 2013, MNRAS, 431, 2317
- Trakhtenbrot & Netzer (2012) Trakhtenbrot, B. & Netzer, H. 2012, MNRAS, 427, 3081
- Trakhtenbrot et al. (2011) Trakhtenbrot, B., Netzer, H., Lira, P., & Shemmer, O. 2011, The Astrophysical Journal, 730, 7
- Valiante et al. (2011) Valiante, R., Schneider, R., Salvadori, S., & Bianchi, S. 2011, Monthly Notices of the Royal Astronomical Society, 416, 1916
- Vanden Berk et al. (2001) Vanden Berk, D. E., Richards, G. T., Bauer, A., Strauss, M. A., Schneider, D. P., Heckman, T. M., York, D. G., Hall, P. B., Fan, X., Knapp, G. R., Anderson, S. F., Annis, J., Bahcall, N. A., Bernardi, M., Briggs, J. W., Brinkmann, J., Brunner, R., Burles, S., Carey, L., Castander, F. J., Connolly, A. J., Crocker, J. H., Csabai, I., Doi, M., Finkbeiner, D., Friedman, S., & Frieman, J. A. a. 2001, The Astronomical Journal, 122, 549
- Wang et al. (2011) Wang, R., Wagg, J., Carilli, C. L., Neri, R., Walter, F., Omont, A., Riechers, D. A., Bertoldi, F., Menten, K. M., Cox, P., Strauss, M. A., Fan, X., & Jiang, L. 2011, AJ, 142, 101
- Weiß et al. (2013) Weiß, A., De Breuck, C., Marrone, D. P., et al. 2013, ApJ, 767, 88
- Whitaker et al. (2012) Whitaker, K. E., van Dokkum, P. G., Brammer, G., & Franx, M. 2012, ApJ, 754, L29
- Wright et al. (2010) Wright, E. L., Eisenhardt, P. R. M., Mainzer, A. K., Ressler, M. E., Cutri, R. M., Jarrett, T., Kirkpatrick, J. D., Padgett, D., McMillan, R. S., Skrutskie, M., Stanford, S. A., Cohen, M., Walker, R. G., Mather, J. C., Leisawitz, D., Gautier, T. N., McLean, I., Benford, D., Lonsdale, C. J., Blain, A., Mendez, B., Irace, W. R., Duval, V., Liu, F., Royer, D., Heinrichsen, I., Howard, J., Shannon, M., Kendall, M., Walsh, A. L., Larsen, M., Cardon, J. G., Schick, S., Schwalm, M., Abid, M., Fabinsky, B., Naes, L., & Tsai, C.-W. 2010, The Astronomical Journal, 140, 1868
- Wu et al. (2009) Wu, J., Vanden Bout, P. A., Evans, N. J., & Dunham, M. M. 2009, The Astrophysical Journal, 707, 988
- Wuyts et al. (2011a) Wuyts, S., Förster Schreiber, N. M., Lutz, D., Nordon, R., Berta, S., Altieri, B., Andreani, P., Aussel, H., Bongiovanni, A., Cepa, J., Cimatti, A., Daddi, E., Elbaz, D., Genzel, R., Koekemoer, A. M., Magnelli, B., Maiolino, R., McGrath, E. J., Pérez García, A., Poglitsch, A., Popesso, P., Pozzi, F., Sanchez-Portal, M., Sturm, E., Tacconi, L., & Valtchanov, I. 2011a, ApJ, 738, 106
- Wuyts et al. (2011b) Wuyts, S., Förster Schreiber, N. M., van der Wel, A., Magnelli, B., Guo, Y., Genzel, R., Lutz, D., Aussel, H., Barro, G., Berta, S., Cava, A., Graciá-Carpio, J., Hathi, N. P., Huang, K.-H., Kocevski, D. D., Koekemoer, A. M., Lee, K.-S., Le Floc’h, E., McGrath, E. J., Nordon, R., Popesso, P., Pozzi, F., Riguccini, L., Rodighiero, G., Saintonge, A., & Tacconi, L. 2011b, ApJ, 742, 96