Purified SASE undulator configuration to enhance the performance of the soft x-ray beamline at the European XFEL
Abstract
The purified SASE (pSASE) undulator configuration recently proposed at SLAC promises an increase in the output spectral density of XFELs. In this article we study a straightforward implementation of this configuration for the soft x-ray beamline at the European XFEL. A few undulator cells, resonant at a subharmonic of the FEL radiation, are used in the middle of the exponential regime to amplify the radiation, while simultaneously reducing the FEL bandwidth. Based on start-to-end simulations, we show that with the proposed configuration the spectral density in the photon energy range between 1.3 keV and 3 keV can be enhanced of an order of magnitude compared to the baseline mode of operation. This option can be implemented into the tunable-gap SASE3 baseline undulator without additional hardware, and it is complementary to the self-seeding option with grating monochromator proposed for the same undulator line, which can cover the photon energy range between about 0.26 keV and 1 keV.
DEUTSCHES ELEKTRONEN-SYNCHROTRON
Ein Forschungszentrum der Helmholtz-Gemeinschaft
DESY 13-135
July 2013
Purified SASE undulator configuration to enhance the performance of the soft x-ray beamline at the European XFEL
Svitozar Serkeza, Vitali Kocharyana, Evgeni Saldina, Igor Zagorodnova, Gianluca Gelonib
aDeutsches Elektronen-Synchrotron DESY, Hamburg
bEuropean XFEL GmbH, Hamburg
ISSN 0418-9833 NOTKESTRASSE 85 - 22607 HAMBURG
1 Introduction
This article discusses the potential for enhancing the capability of the soft x-ray (SASE3) beamline at the European XFEL which will be operated in the photon energy range between 0.26 keV and at least 3 keV. A high level of longitudinal coherence is the key to upgrade the baseline performance. Self-seeding is a promising approach to significantly narrow the SASE bandwidth and to produce nearly transform-limited pulses SELF -ASYM . The implementation of this method in the soft x-ray wavelength range necessarily involves gratings as dispersive elements. A grating monochromator, which can be installed in the SASE3 undulator without perturbing the electron focusing system can cover the spectral range between about 0.26 keV and 1 keV FENG3 -GRAT .
One of the main technical problems for self-seeding designers is to provide a high level of longitudinal coherence in the photon energy range between 1 keV and 3 keV. In this range, proposals exist to narrow the SASE bandwidth at the European XFEL by combining self-seeding and fresh bunch techniques. However, this requires installing additional hardware in the undulator system BIO1 , BIO3 . Here we explore a simpler method to reach practically the same result without further changes in the undulator system. The solution is based in essence on the purified SASE (pSASE) technique recently proposed at SLAC PSASE , and naturally exploits the gap tunability of the SASE3 undulator.
In the pSASE configuration, a few undulator cells resonant at a subharmonic of the FEL radiation, called altogether the ”slippage-boosted section”, are used in the high-gain linear regime to reduce the SASE bandwidth. The final characteristics of a pSASE source are a compromise between high output power, which can be reached with a conventional SASE undulator source resonant at the target wavelength, and narrow bandwidth, which can be reached with harmonic lasing BONI -SCHN .
Here we demonstrate that it is possible to cover the energy range between 1.3 keV and 3 keV using the nominal European XFEL electron beam parameters, and to reduce the SASE bandwidth by a factor 5, still having the same output power as in the baseline SASE regime. Note that the slippage-boosted section is tuned to a subharmonic (the fifth, or the seventh) of the FEL radiation. Therefore, the choice of the lowest pSASE photon energy considered in this article, 1.3 keV, is dictated by the minimal photon energy (0.26 keV) that can be reached in the conventional SASE regime.
2 Setup description
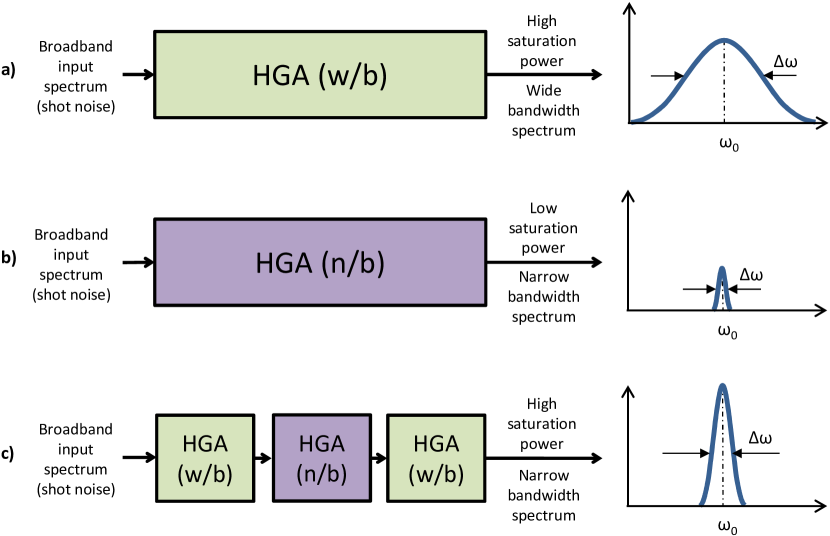
Let us consider the SASE3 undulator configured in pSASE mode as proposed in PSASE 111The first mention of what might be called a pSASE undulator configuration appears, to the best of our knowledge, in SCHN . Half a year later, the idea was much more fleshed out in PSASE . Using the LCLS-II parameters as an example, in PSASE was shown that, with the proposed pSASE configuration, the temporal coherence and spectral brightness of a SASE FEL can be significantly enhanced.. The operation of this setup can be understood from Fig. 1. Suppose that two high-gain FEL amplifiers based on the same tunable-gap undulator start from shot noise and generate SASE radiation at the same target frequency. The undulator system of the first amplifier is tuned to operate at this target frequency as the fundamental harmonic, Fig. 1(a). The undulator system of the second amplifier in Fig. 1(b) is tuned, instead, to operate at the same target frequency lasing at an harmonic of the fundamental, a mode of operation called ”harmonic lasing” BONI -SCHN . Harmonic lasing is possible once the growth of the radiation at the fundamental frequency, which is now a sub-harmonic of the target frequency, is suppressed, for example by properly tuning the phase shifters after each undulator section. The first FEL amplifier, operating at the fundamental harmonic, is capable of generating SASE radiation with a high-power level at saturation, but with a relatively wide spectrum. The second amplifier, operating in harmonic-lasing mode produces a narrower bandwidth instead, but also a lower level saturation power SCHN . Let us now consider a third configuration where, instead of using harmonic lasing up to saturation, one exploits it as an active filter in the linear regime. This configuration, illustrated in Fig. 1(c) is a pSASE configuration. In this case, at saturation one can reach both a high-power level and a narrow spectrum. We will qualitatively explain the reasons for these effects further on in this section.
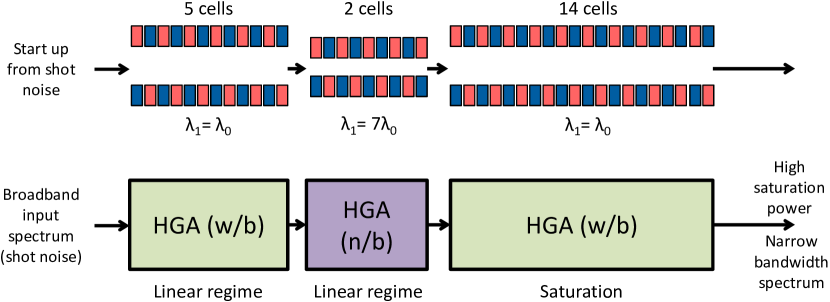
A schematic layout of the proposed pSASE configuration for the SASE3 undulator at the European XFEL is illustrated in Fig. 2. Following PSASE , the undulator consists of three parts, U1, U2, and U3. The first undulator part U1 is resonant at the target FEL frequency , and is used to produce standard SASE radiation in pulses with central frequency . The length of U1 is chosen in such a way that U1 operates in the linear high-gain regime. The SASE radiation and the electron beam then enter the second undulator part U2, which is made resonant at the nth subharmonic of the target FEL frequency by properly increasing the undulator parameter. In the slippage-boosted section U2 the SASE radiation is amplified through the harmonic interaction, while its bandwidth is simultaneously reduced.
The narrow bandwidth radiation is finally amplified to saturation in the last undulator part, U3, which is resonant again at frequency as in U1. With this configuration, the FEL reaches a high-power level with significantly reduced radiation bandwidth. The main purpose of U2 is indeed to reduce the SASE bandwidth. Operating U3 at the same frequency as U1 makes the saturation power of the SASE FEL essentially the same as in the nominal SASE configuration, which allows one to increase the output spectral brightness.
We optimized our setup based on start-to-end simulations for the nominal electron beam with 100 pC charge at GeV. At the longitudinal position corresponding to the maximum current value, kA, the electron bunch has a normalized emittance of about m, and an energy spread of about MeV ZAGO . Simulations were performed with the help of the Genesis code GENE . We first modeled the performance of the high-gain FEL amplifiers described in Fig. 1(a) and Fig. 1(b) in the steady state regime. This allowed us to calculate the gain curve of the amplifiers in these two configurations.
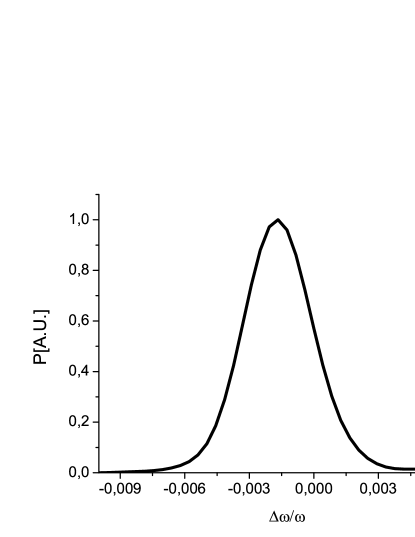

Fig. 3 shows the comparison of gain curves for these two modes of operation at a photon energy of 2 keV. For the harmonic lasing case, the right plot in Fig. 3, the SASE3 undulator is tuned to the 7th harmonic. The undulator value is tuned to produce radiation with the same frequency as in the case of lasing at the fundamental, as is illustrated in the left plot of the same figure. These simulations clearly demonstrate the possibility of producing narrow bandwidth radiation in the harmonic lasing mode. When tuned to the 7th harmonic of the undulator, the FEL amplifier is characterized by a bandwidth that is about times narrower than in the case of lasing at the fundamental.

The left and right plot in Fig. 4 respectively show the dependence of the radiation power on the undulator length in the saturation regime. It is clearly seen from these plots that the saturation power of the FEL operating in the harmonic lasing mode is about ten times lower than in the fundamental lasing mode. It is seen from these plots that the shape of the power curves at saturation is different. In other words, the high harmonic nonlinear mode of operation differs significantly from that of conventional FEL operation. Simulations show that in our case of interest, this fact is mainly related to the influence of the electron beam energy spread ( MeV) on the nonlinear amplification process. The effect of the energy spread on the harmonic lasing mode is much stronger than on the fundamental lasing mode. Another issue to keep in mind is that in practical situations the gain length is comparable in both FEL amplifier configurations. It is well-known that the bandwidth of conventional FEL amplifier , where is number of undulator periods per gain length222The power gain in the high-gain limit can be written in the form : , where is power growth rate ., . Fig. 4 illustrates the fact that is comparable in both configurations. However, we estimated from Fig. 3 that in the harmonic lasing mode the frequency bandwidth is about an order of magnitude narrower than in the case of lasing at the fundamental.
The reason for these combined effects on bandwidth and saturation power can be qualitatively explained as follows. Let us consider the interaction of an electron beam with a co-propagating electromagnetic wave in a planar undulator in terms of the exchange of energy between electron and field. For simplicity we consider an electromagnetic wave, linearly polarized along the direction and a single electron oscillating in the direction as well. The exchange of energy is proportional to the scalar product between the transverse velocity of the electron, which has only the -component (where and is the period of the planar undulator), and the electric field of the wave, which has only the -component as well, . If an effective energy exchange between electron and field has to be provided, the scalar product between the electric field and the electron velocity, should be kept nearly constant along the undulator333Here we have neglected a rapidly oscillating term on the scale , which is not resonant. , i.e synchronism should be provided. The rate of change of the phase for an electron moving along the undulator axis with velocity can be written as
| (1) |
In the our case of interest, the longitudinal velocity of the electron is close to the speed of light, . Due to the electron wiggling inside the planar undulator, the longitudinal velocity is an oscillatory function of according to
| (2) |
Since is proportional to and , the function oscillates as twice the undulator period. Hence the phase oscillates as twice the undulator period too. In order to deal with such periodical wiggling, one can use the Anger-Jacobi expansion
| (3) |
Using this relation we obtain
| (4) |
where
| (5) |
where is the relativistic Lorentz factor, and is the dimensionless undulator parameter, related to the undulator period and to the undulator peak magnetic field as . The energy change of the electron along the undulator is proportional to . The integrand does not contribute appreciably unless the arguments in the exponential, oscillating functions vanish. In other words, resonance condition requires the phase to be independent of z, and one obtains for :
| (6) |
Let us now consider the two cases in Fig. 1(a) and Fig. 1(b). In the first case, the target frequency coincides with the fundamental , and Eq. (6) simply becomes
| (7) |
where is the relativistic Lorentz factor. In the second case, the target frequency coincides with the nth harmonic of the fundamental , with , so that Eq. (6) becomes
| (8) |
By inspecting Eq. (7) and Eq. (8) it is straightforward to see that the quantity in Eq. (8) must be times larger than the quantity in Eq. (7), for the resonance condition to hold. In particular, in order to produce the same rate of phase change one needs, for example, a deviation from or a deviation from that is times smaller in Eq. (8), compared to Eq. (7). Let us now come back to our statement that the gain lengths in our two FEL amplifier configurations are comparable. It should be clear that the gain strongly depends on the rate of phase change, that is the detuning from resonance . It is important to realize that, similarly as the gain lengths, also the detuning bandwidths are comparable in the two FEL amplifier configurations under study. One qualitatively concludes that there must be a significant difference in frequency bandwidth and saturation power for the harmonic lasing mode compared to the fundamental lasing mode of FEL operation, as exemplified in Fig. 3 and Fig. 4.


Results of our simulations show that in order to operate in the deep linear regime, the number of cells in the undulator U1 should be equal to five. The output power and spectrum after the first undulator tuned to nm is shown in Fig. 5 for a single shot realization. The length of the slippage-boosted section U2 should be properly chosen to make sure that the FEL power at the fundamental wavelength is much lower than that at the chosen harmonic. This is possible because radiation at the fundamental wavelength starts from shot noise, while radiation at the target wavelength is seeded by the radiation produced in U1, and the seed power is much higher than the effective shot noise power. The output power and spectrum of fundamental and harmonic radiation pulse after the U2 undulator tuned to nm are shown in the left and right plot of Fig. 6. Since the FEL power at the fundamental wavelength of nm, which is about MW, is much lower than that at nm, which is about GW, phase shifters are not needed to suppress the lasing at fundamental harmonic.


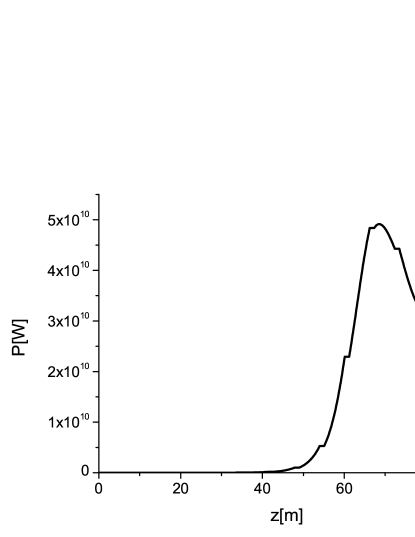
The output undulator U3 consists of two sections. The first section is composed by an uniform undulator, the second section by a tapered undulator. The purified pulse is exponentially amplified passing through the first uniform part of the output undulator. This section is long enough, cells, in order to reach saturation, which yields about 50 GW power Fig. 7 (top row). The radiation power profile and spectra for the SASE3 undulator beamline working in the nominal SASE mode is shown for comparison in Fig. 7 (bottom row). The power level for both modes of operation are similar, but the spectral density for the pSASE case is significantly higher than for the nominal SASE case. Finally, in the second part of the output undulator U3 the purified FEL output is enhanced up to about TW taking advantage of a taper of the undulator magnetic field over the last cells after saturation. The output power and spectrum of the entire setup is shown in Fig. 8. The evolution of the output energy in the photon pulse as a function of the distance inside the output undulator is reported in Fig. 9. As one can see, the photon spectral density for the output TW-level pulse is about times higher than that for the nominal SASE pulse at saturation.
3 FEL studies
In this section we present a more thorough feasibility study of the pSASE setup described in the previous section with the help of the FEL code Genesis 1.3 GENE running on a parallel machine. Results are presented for the SASE3 FEL line of the European XFEL, based on a statistical analysis consisting of runs. The overall beam parameters used in the simulations are presented in Table 1.
| Units | ||
|---|---|---|
| Undulator period | mm | 68 |
| Periods per cell | - | 73 |
| Total number of cells | - | 21 |
| Intersection length | m | 1.1 |
| Energy | GeV | 10.5 |
| Charge | nC | 0.1 |

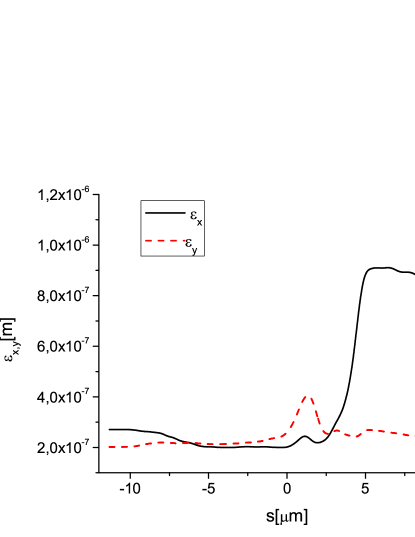


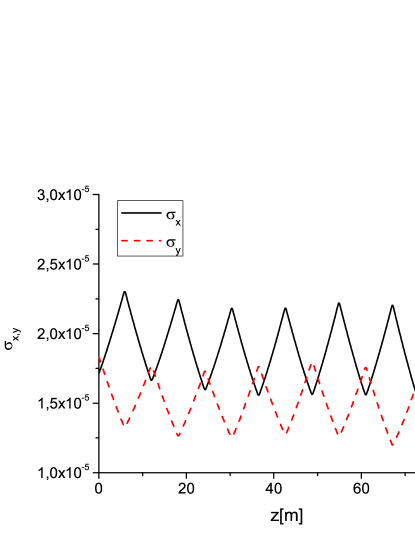
The nominal beam parameters at the entrance of the SASE3 undulator, and the resistive wake inside the undulator are shown in Fig. 10, ZAGO . The evolution of the transverse electron bunch dimensions is plotted in Fig. 11.
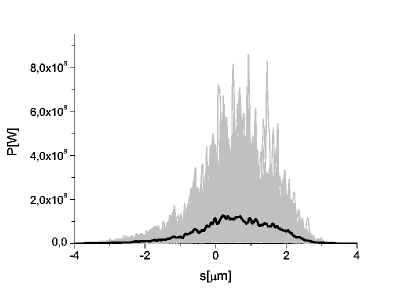
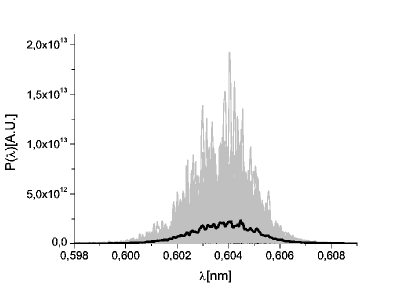
As it was previously remarked, the number of cells in the undulator U1 should be equal to five in order to optimize the final characteristics of the radiation pulse. The output power and spectrum after the first undulator tuned to nm (the corresponding rms K value is ) is shown in Fig. 12 for 100 runs. The average behavior is rendered in black. The radiation field is first dumped at the exit of U1, and then further imported in the Genesis code for simulating the 7th harmonic interaction in U2, which is resonant at a fundamental of nm. Together with the radiation pulse, also electron beam file generated using the values of energy loss and energy spread at the exit of U1 is fed in the simulation of the second undulator part. The Genesis 7th harmonic field and particle file were downloaded at the exit of the U2 undulator and used as input file for the Genesis simulations of the U3 undulator. As explained in the previous section, the length of the booster U2 is chosen to make sure that the FEL power at the fundamental wavelength is much lower than that at the chosen harmonic. The output power and spectrum of fundamental and harmonic radiation pulse after the U2 undulator tuned to nm (the corresponding rms K value is , and can be achieved by reducing the undulator gap), that is the seventh subharmonic, are shown in the left and right plot of Fig. 13. Since the FEL power at the fundamental wavelength of nm, which is about MW, is much lower than that at nm, which is about GW), phase shifters are not needed to suppress the lasing at fundamental harmonic.
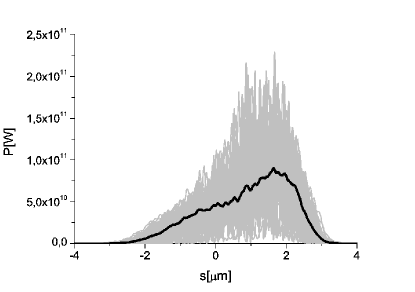
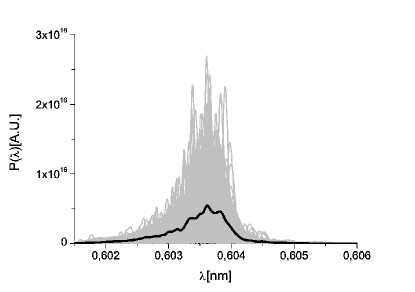
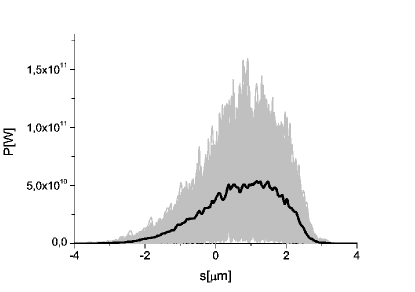
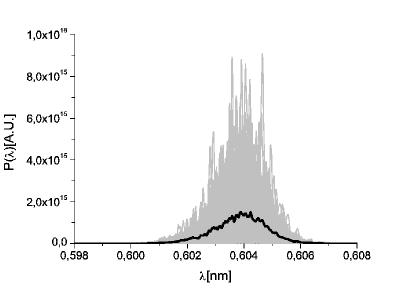
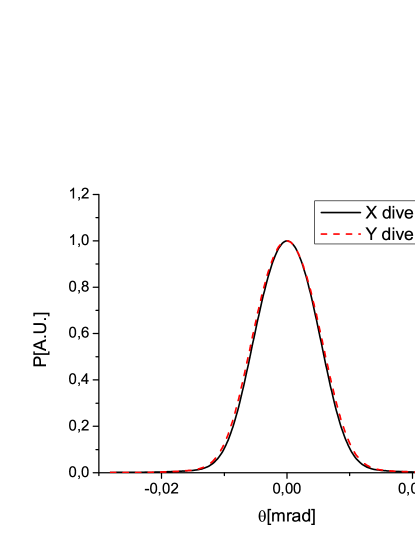
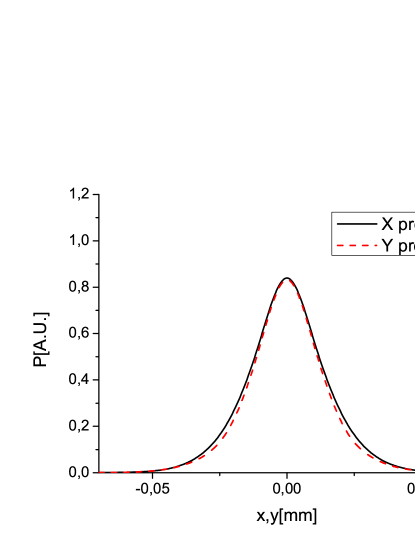
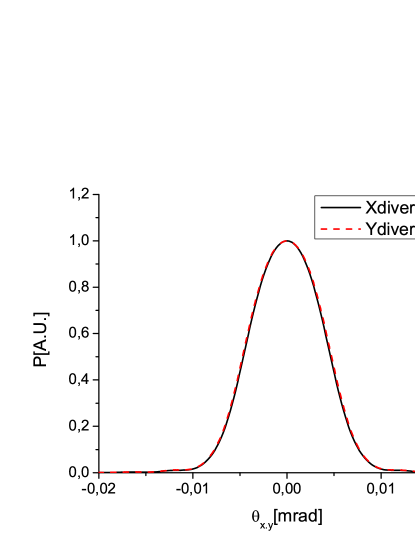


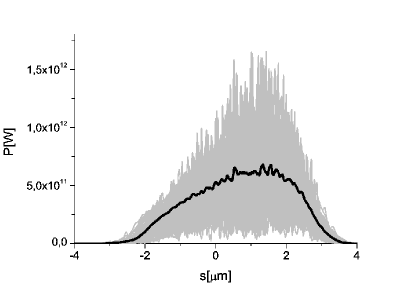
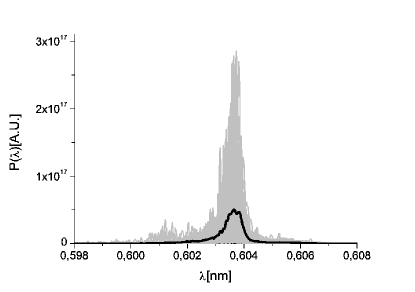

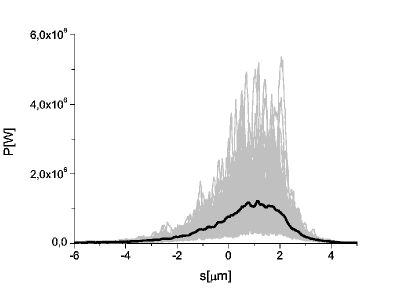
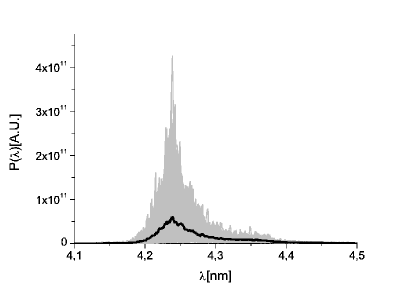
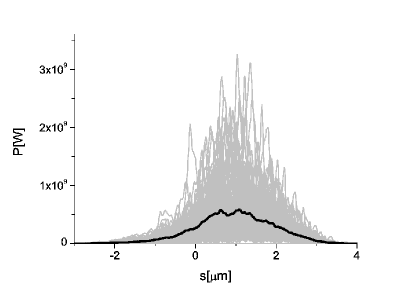
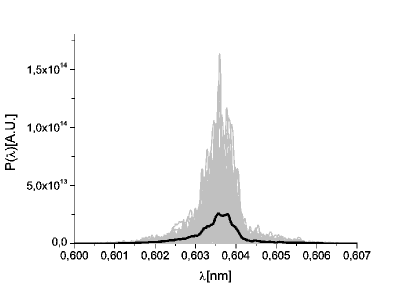
As explained in the previous section, the output undulator U3 consists of two sections. The first section is composed by an uniform undulator, the second section by a tapered undulator. The purified pulse is exponentially amplified passing through the first uniform part of the output undulator. This section is long enough, cells, in order to reach saturation, which yields about 50 GW power Fig. 14 (top row). The radiation power profile and spectra for SASE3 undulator beamline working in the nominal SASE mode is shown in Fig. 14 (bottom row). As seen before, the power level for both modes of operation are similar, but the spectral density for the pSASE case is significantly higher than for the nominal SASE case. The size and divergence of the pSASE radiation pulse at saturation are shown in Fig. 15 (top row).
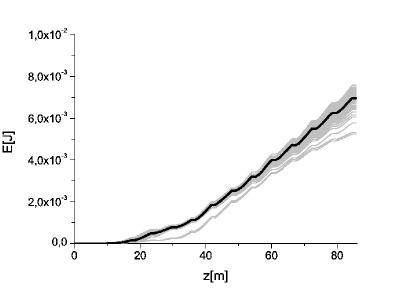
In the second part of the output undulator U3, the purified FEL output is enhanced up to about TW taking advantage of a taper of the undulator magnetic field over the last cells after saturation. The tapering law is shown in Fig. 16. The output power and spectrum of the entire setup, at the exit of U3, is shown in Fig. 17. The size and divergence of the pSASE radiation pulse at the exit of the setup including undulator tapering are shown in the bottom row of Fig. 15. By inspection, one can see that the difference with the pSASE setup at saturation, shown in the top row of the same figure, is minimal. The evolution of the output energy in the photon pulse as a function of the distance inside the output undulator is reported in Fig. 18. As reported in the previous section, the photon spectral density for the output TW-level pulse is about times higher than that for the nominal SASE pulse at saturation.
4 Conclusions
We studied the simple scheme proposed in PSASE to significantly enhance the spectral brightness of a SASE FEL with the help of numerical simulations. Using the parameters for the soft x-ray beamline SASE3 at the European XFEL we show, using the nominal electron bunch parameter set, that the SASE bandwidth at saturation can be reduced by a factor of five with respect to the proposed configuration of the baseline, variable gap SASE3 undulator, Fig. 2. In addition to the example studied in PSASE , the purified radiation after saturation is further significantly amplified (we report an order of magnitude increase in power) in the last tapered part of SASE3 undulator. With this configuration, a pSASE FEL reaches TW peak power level with significantly enhanced brightness (about two orders of magnitude) compared with the nominal SASE regime TSCH .
5 Acknowledgements
We are grateful to Massimo Altarelli, Reinhard Brinkmann, Henry Chapman, Janos Hajdu, Viktor Lamzin, Serguei Molodtsov and Edgar Weckert for their support and their interest during the compilation of this work. We acknowledge useful discussions with Haixao Deng, Yuantao Ding, Zhirong Huang and Dao Xiang, who shared their experience in simulating the pSASE configuration with us.
References
- [1] J. Feldhaus et al., Optics. Comm. 140, 341 (1997).
- [2] E. Saldin, E. Schneidmiller, Yu. Shvyd’ko and M. Yurkov, NIM A 475 357 (2001).
- [3] E. Saldin, E. Schneidmiller and M. Yurkov, NIM A 445 178 (2000).
- [4] R. Treusch, W. Brefeld, J. Feldhaus and U Hahn, Ann. report 2001 ”The seeding project for the FEL in TTF phase II” (2001).
- [5] A. Marinelli et al., Comparison of HGHG and Self Seeded Scheme for the Production of Narrow Bandwidth FEL Radiation, Proceedings of FEL 2008, MOPPH009, Gyeongju (2008).
- [6] G. Geloni, V. Kocharyan and E. Saldin, ”Scheme for generation of highly monochromatic x-rays from a baseline XFEL undulator”, DESY 10-033 (2010).
- [7] Y. Ding, Z. Huang and R. Ruth, Phys.Rev.ST Accel.Beams, vol. 13, p. 060703 (2010).
- [8] G. Geloni, V. Kocharyan and E. Saldin, ”A simple method for controlling the line width of SASE x-ray FELs”, DESY 10-053 (2010).
- [9] G. Geloni, V. Kocharyan and E. Saldin, ”A Cascade self-seeding scheme with wake monochromator for narrow-bandwidth x-ray FELs”, DESY 10-080 (2010).
- [10] Geloni, G., Kocharyan, V., and Saldin, E., ”Cost-effective way to enhance the capabilities of the LCLS baseline”, DESY 10-133 (2010).
- [11] J. Wu et al., ”Staged self-seeding scheme for narrow bandwidth , ultra-short x-ray harmonic generation free electron laser at LCLS”, proceedings of 2010 FEL conference, Malmo, Sweden, (2010).
- [12] Geloni, G., Kocharyan V., and Saldin, E., ”Generation of doublet spectral lines at self-seeded x-ray FELs”, DESY 10-199 (2010), and Optics Communications, 284, 13, 3348 (2011)
- [13] Geloni, G., Kocharyan, V., and Saldin, E., ”Production of transform-limited x-ray pulses through self-seeding at the European x-ray FEL”, DESY 11-165 (2011).
- [14] Geloni, G., Kocharyan V., and Saldin, E., ”A novel Self-seeding scheme for hard x-ray FELs”, Journal of Modern Optics, vol. 58, issue 16, pp. 1391-1403, DOI:10.1080/09500340.2011.586473 (2011)
- [15] J. Wu et al., Simulation of the Hard x-ray Self-seeding FEL at LCLS, MOPB09, FEL 2011 Conference proceedings, Shanghai, China (2011).
- [16] J. Amann et al., Nature Photonics, DOI: 10.1038/NPHOTON.2012.180 (2012).
- [17] R. R. Lindberg and Yu.V. Shvyd ko, Phys. Rev. ST Accel. Beams 15, 100702 (2012).
- [18] Y. Feng et al., ”System design for self-seeding the LCLS at soft x-ray energies”, Proceedings of the 24th International FEL Conference, Nara, Japan (2012).
- [19] S. Serkez, G. Geloni, V. Kocharyan and E. Saldin, ”Grating monochromator for soft x-ray self-seeding the European XFEL”, DESY 13-040, http://arxiv.org/abs/1303.1392 (2013).
- [20] G. Geloni, V. Kocharyan, E. Saldin, S. Serkez and M. Tolkiehn, ”Wake monochromator in asymmetric and symmetric Bragg and Laue geometry for self-seeding the European XFEL”, DESY 13-013 (2013).
- [21] G. Geloni, V. Kocharyan and E. Saldin, ”Conceptual design of an undulator system for a dedicated bio-imaging beamline at the European x-ray FEL”, DESY 12-082, http://arxiv.org/abs/1205.6345 (2012).
- [22] G. Geloni, V. Kocharyan and E. Saldin, ”Optimization of a dedicated bio-imaging beamline at the European x-ray FEL”, DESY 12-159, http://arxiv.org/abs/1209.5972 (2012).
- [23] D. Xiang, Y. Ding, Z. Huang and H. Deng., Phys. Rev. ST AB 16, 010703 (2013).
- [24] R. Bonifacio, L. De Salvo, and P. Pierini, Nucl. Instrum. Methods Phys. Res., Sect. A 293, 627 (1990).
- [25] Z. Huang and K. Kim, Phys. Rev. E 62, 7295 (2000).
- [26] J. B. Murphy, C. Pellegrini, and R. Bonifacio, Opt. Commun. 53, 197 (1985).
- [27] B.W. J. McNeil et al., Phys. Rev. Lett. 96, 084801 (2006).
- [28] E. A. Schneidmiller and M. V. Yurkov, Phys. Rev. ST Accel. Beams 15, 080702 (2012).
- [29] I. Zagorodnov, ”Beam Dynamics Simulations for XFEL”, http://www.desy.de/xfel-beam/s2e (2011), and ”Compression scenarios for the European XFEL”, http://www.desy.de/fel-beam/data/talks/files/ZagorodnovACC2012readynew.pptx, (2012).
- [30] S. Reiche et al., Nucl. Instr. and Meth. A 429, 243 (1999).
- [31] Th. Tschentscher, ”Layout of the x-Ray Systems at the European XFEL”, Technical Report 10.3204/XFEL.EU/TR-2011-001 (2011).