Local Structural Evidence for Strong Electronic Correlations in LiRh2O4 Spinel - Supplementary Material
.1 I41/amd modeling
As described in the Main Article, fits of the I41/amd structural model to LiRh2O4 PDFs were carried out throughout the temperature range studied. Since this model does not allow for short Rh-dimer distances, the presence of dimers is indirectly evidenced through anomolously high values of the refinement residual, .
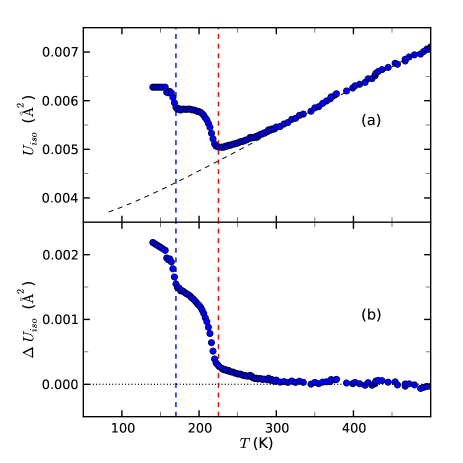
Another sensitive measure of the presence of dimers is the isotropic atomic displacement parameter associated with the Rh crystallographic site. This is shown in Fig. 1(a). The canonical temperature dependence of ADPs in materials on cooling is their gradual decrease with decreasing temperature, reflecting the decrease in thermal-motion. However, this trend is not observed in the Rh-ADP obtained from our structural refinement; instead, the Rh-ADP is seen to increase with decreasing temperature in the ITT and LTO phases, indicating that the I41/amd model is inadequate to describe these phases. Additionally, although the refined Rh-ADP decreases on cooling through the HTC phase, it deviates from canonical Debye behavior (see Eqn. 1) between 300 and 350 K. This behavior reflects the inability of the I41/amd model to properly account for the structural features in the data, and the values of Rh-ADP become anomalously high in the model’s effort to provide the best fit.
The themperature dependence of ADPs is often described by a Debye-type model as:
| (1) |
where
| (2) |
Any deviation from this behavior is typically ascribed either to overall inadequacy of the structural model or to the presence of nanoscale features that deviate from the average structure. Thus, the presence of dimers that are not long range ordered and, hence, unaccounted for by the average structural model, would result in anomolous behavior of the associated ADP. The dashed black line in Fig. 1(a) represents a fit of the Debye-model to the high temperature tail of the Rh curve. As can be seen in the figure, the fit is reasonable at high temperature. However, the data deviate from the canonical behavior described by the model while the sample is still in the HTC phase. In Fig. 1(b) we show the difference between the ADP data and the high temperature Debye fit. Again, the characteristic curve shows up, reminiscent of , , and the dimer fraction temperature dependence shown in the Main Article.
.2 Gaussian modeling
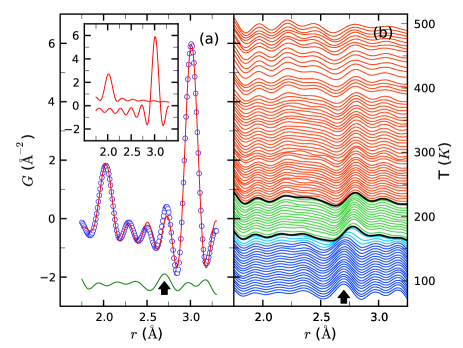
To confirm the temperature evolution of the short Rh-dimer bond, a structural model independent assessment of the experimental PDFs was performed; the low- portion of the LiRh2O4 PDFs were fit with Gaussians convolved with Sinc functions to account for termination effects Egami and Billinge (2013). The Gaussians were used to fit the range from 1.5 Å to 3.5 Å to account for the peaks at 2.0 Å and 3.0 Å(inset to Fig. 2 (a)). The short bond peak associated with dimerization was intentionally left out of this model, and any unaccounted PDF intensity (such as from the Rh-dimer peak) shows up in the difference curve. In this way, the evolution of the dimer peak may be followed directly by plotting the difference curve obtained by subtracting the best fit of the 2-Gaussian model from the data. A representative fit to the 80 K PDF profile is shown in Fig. 2(a), with the unaccounted dimer peak in the difference curve marked with arrow. The temperature evolution of this difference curve is shown in panel (b). As the sample is warmed through the LTO phase, it is clear that the short bond peak is roughly constant in both position and intensity until 160 K at which point it rapidly moves towards higher in advance of the phase transition at 170 K. The peak then persists through the ITT phase and well into the HTC phase with gradually diminishing intensity.
.3 Specific Heat Analysis
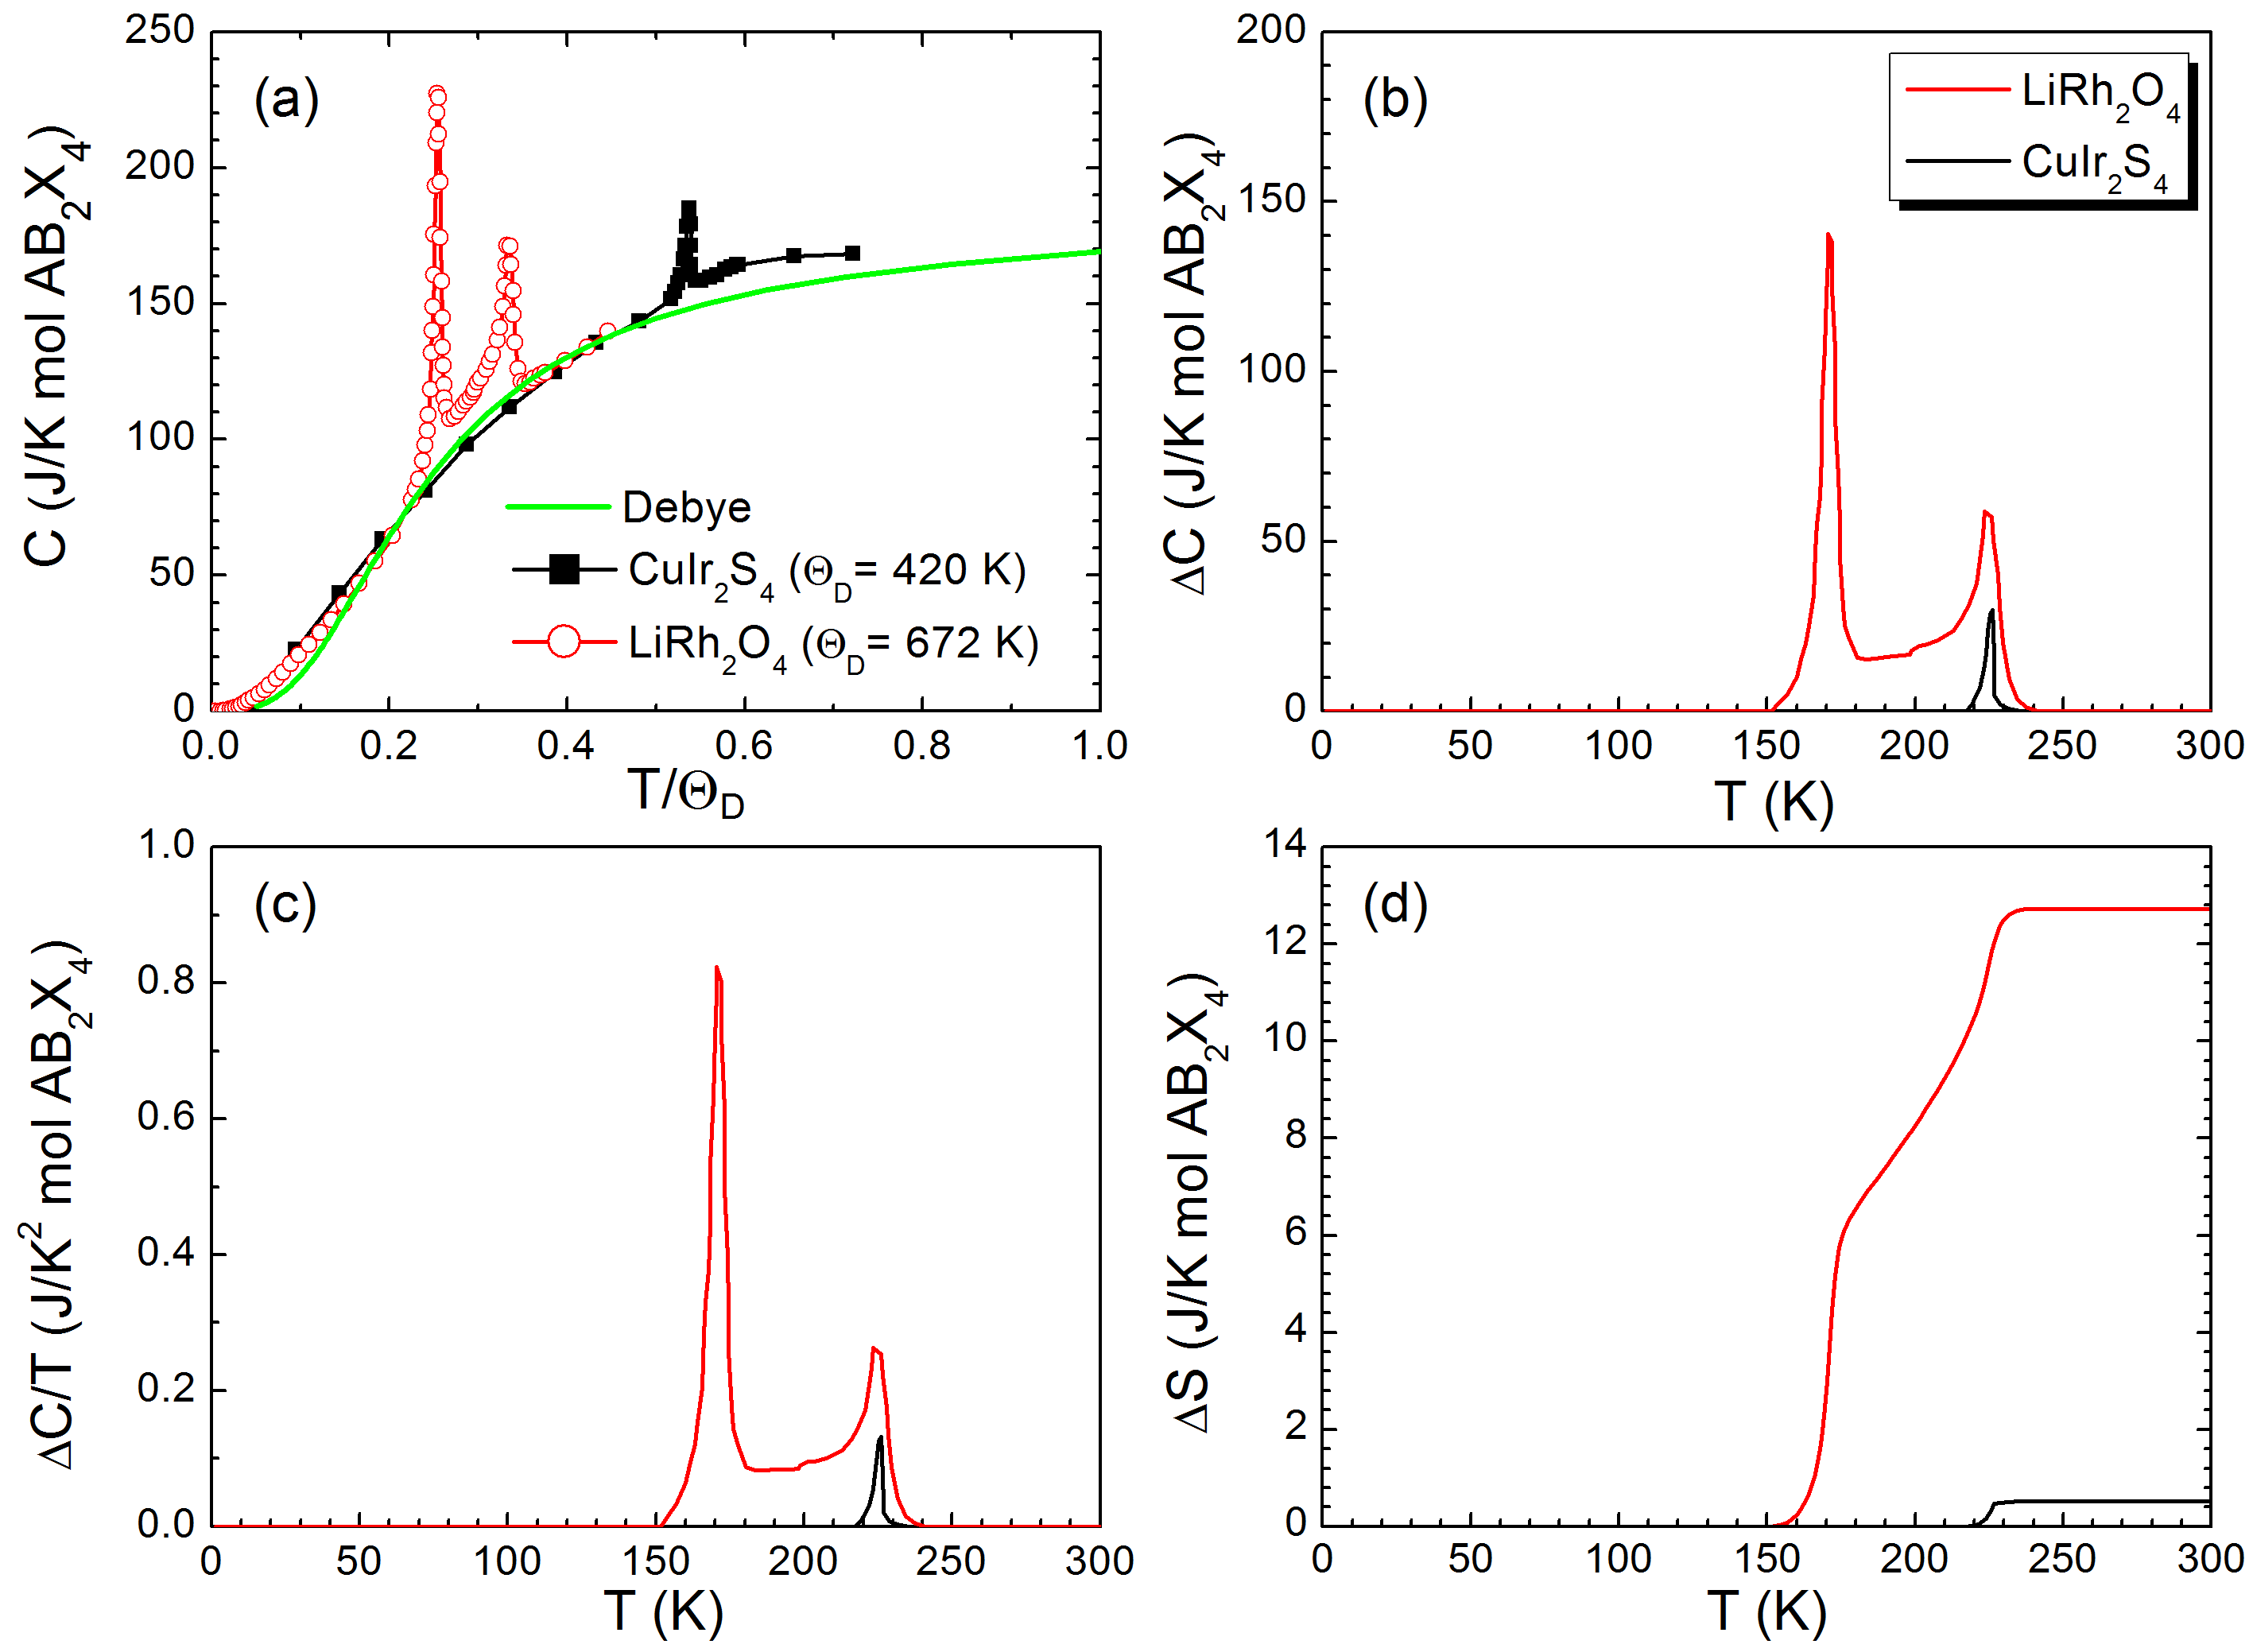
Fig. 3(a) compares the specific heat, , of LiRh2O4 (obtained from Ref. Okamoto et al. (2008)) with that of CuIr2S4 (obtained from Ref. Zhang et al. (2009)). Both are expressed as functions of the renormalized temperature, , where was obtained by fitting the data over the whole temperature range from 0 to 300 K with the Debye specific heat expression
| (3) |
The fitted Debye temperatures are = 420 K for CuIr2S4 and 672 K for LiRh2O4. The larger value of for LiRh2O4 can be ascribed to the smaller atomic masses of Li, Rh, and O as compared to Cu, Ir, and S, respectively.
It is clear that, after scaling, the curves of LiRh2O4 and CuIr2S4 differ only at the peaks around the transition temperatures. This indicates that the phonon contributions to the specific heat of these materials are rather similar. Additionally, their values at 300 K are close to J mol-1 K-1 where (the number of atoms in the chemical formula) and J mol-1 K-1 (the universal gas constant), which indicates that phonon contributions dominate in this temperature regime. Indeed, it is clear that both curves closely follow the Debye model away from the transition temperatures.
Since only deviates substantially from the Debye curve near the transition temperaures, it is straightforward to extract the electronic contributions. This was done by subtracting a linear background from the peaks near the transition temperatures as shown in Fig. 3(b). Figs. 3(c) and (d) compare and the electronic contribution to the entropy, , respectively. Integrating C/T for these peaks shows a significantly larger entropy increase for LiRh2O4 than for CuIr2S4. Since the phonon contributions have already been accounted for, this difference can only arise from contributions to the entropy from the electronic system, including the charge, spin, and orbital degrees of freedom.
It is useful to express the entropy change in the familiar units of ln2, which would be appropriate for a system of localized objects with spin (note that we do not wish to imply by this that LiRh2O4 contains localized spins) and is also the value of the entropy change of the Verwey transition in Fe3O4. The entropy associated with the transition in CuIr2S4 is 0.03 ln2, confirming its weakly correlated nature. However, the corresponding entropy change in LiRh2O4 is about ln2 for the low-T transition and an additional ln2 for the high-T transition. This large electronic entropy indicates the existence of many degenerate states above the transition, a hallmark of strong electron correlation. Although the origin of this large entropy is unclear at this moment (and calls for further theoretical and experimental investigation), it is reasonable to conclude that LiRh2O4 and CuIr2S4 belong to two different regimes in terms of electron correlation.
References
- Egami and Billinge (2013) T. Egami and S. J. L. Billinge, Underneath the Bragg peaks: structural analysis of complex materials (Elsevier, Amsterdam, 2013), 2nd ed.
- Okamoto et al. (2008) Y. Okamoto, S. Niitaka, M. Uchida, T. Waki, M. Takigawa, Y. Nakatsu, A. Sekiyama, S. Suga, R. Arita, and H. Takagi, Phys. Rev. Lett. 101, 086404 (2008).
- Zhang et al. (2009) L. Zhang, Z. Qu, L. Pi, S. Huang, S. Tan, and Y. Zhang, J. Magn. Magn. Mater. 321, 4092 (2009).