A first-principles study of structural and elastic properties of bulk SrRuO3
Abstract
We present a first-principles investigation of structural and elastic properties of experimentally observed phases of bulk SrRuO3 - namely orthorhombic, tetragonal, and cubic - by applying density functional theory (DFT) approximations. At first, we focus our attention on the accuracy of calculated lattice constants in order to find out DFT approaches that best represent the crystalline structure of SrRuO3, since many important physical quantities crucially depend on change in volume. Next, we evaluate single-crystal elastic constants, mechanical stability, and macroscopic elastic parameters trying to at least partially compensate for the existing lack of information about these fundamental features of SrRuO3. Finally, we analyze the anomalous behavior of low-temperature orthorhombic phase under related shear deformation. It turns out that at critical strain values the system exhibits a distinct deviation from the initial behavior which results in an isosymmetric phase transition. Moreover, under related shear deformation tetragonal SrRuO3 becomes mechanically unstable raising an open question of what makes it experimentally observable at high temperatures.
I Introduction
Strontium ruthenate SrRuO3 is a perovskite-type metallic oxide exhibiting ferromagnetic properties below Curie temperature of 160 K (Refs. Mazin and Singh, 1997; Kim et al., 2005; Siemons et al., 2007). The combination of high resistance to corrosion Herranz et al. (2005), excellent electrical conductivity, strong chemical stability, and easy epitaxial growth on various functional transition metal oxides Eom et al. (1992, 1993); Wu et al. (1993); He et al. (2004) has attracted noticeable attention of scientific community. SrRuO3 is a promising material for electrodes and junctions of perovskite-based devices, including ferroelectric heterostructures and non-volatile ferroelectric random access memories Shin et al. (2005), since its good thermal conductivity and surface stability help to improve retention, fatigue resistance, and imprint Palai et al. (2009).
At room temperature bulk SrRuO3 crystallizes in an orthorhombic (space group ) GdFeO3-type perovskite structure, in which the RuO6 octahedra are tilted Jones et al. (1989). As the temperature increases up to 950 K, this compound undergoes a series of phase transformations, in detail described in Refs. Kennedy and Hunter, 1998; Chakoumakos et al., 1998; Yamanaka et al., 2004. An orthorhombic structure of SrRuO3 consecutively transforms to tetragonal (stable in the temperature range of 820 to 950 K) and then to cubic symmetry. Although by using high-resolution synchrotron diffraction and fine temperature intervals Kennedy . Kennedy et al. (2002) have revealed the presence of intermediate phase between 685 and 825 K, due to the lack of the more thorough experimental analysis of the corresponding SrRuO3 structure we did not include it in the present work. Concerning the recent low-temperature studies, Bushmeleva . Bushmeleva et al. (2006) have reported the neutron diffraction results of an orthorhombic phase at 1.5 K. It is worthwhile to mention that below 160 K SrRuO3 crystalline structure undergoes only tiny changes due to the Invar effect initially discovered by Kiyama . Kiyama et al. (1996)
The main goal of our study is to systematically investigate the geometric structure and elastic properties of experimentally observed phases of SrRuO3 by applying the most recent generalized-gradient approximations (GGAs) for exchange-correlation energy of Kohn-Sham density functional theory (DFT), namely PBEsol (Ref. Perdew et al., 2008), SOGGA (Ref. Zhao and Truhlar, 2008), and WC (Ref. Wu and Cohen, 2006). Since many inherent material properties including phonon frequencies, elastic constants, and ferromagnetism are critically dependent on change in volume Csonka et al. (2009); Haas et al. (2010), primarily we focus our attention on the accuracy of the calculated lattice constants. It has been previously noticed that for various perovskite crystals local density approximation (LDA) systematically underestimates the experimental lattice constants on average by 2%, whereas standard GGA overestimates them by the same magnitude Nishimatsu et al. (2010). Although in general these discrepancies seem to be acceptable, absolute relative errors of the “good” theoretical values should not exceed 0.5% (Ref. Haas et al., 2009a). But despite the aforementioned trend, we have incorporated LDA (Refs. Dirac, 1930; Perdew and Zunger, 1981) and PBE (Ref. Perdew et al., 1996) calculations in the present work to make our analysis more complete. However, we did not take into consideration hybrid functionals due to the metallic character of SrRuO3 and arguments for its weakly correlated nature Etz et al. (2012); Grebinskij et al. (2013). It is well known that hybrids are very fruitful for systems possessing band gaps and in some cases the inclusion of the exact Hartree-Fock (HF) exchange energy may serve as a reasonable alternative for the description of strongly correlated electrons Š. Masys et al. (2010); Gou et al. (2011). These issues, though, are unlikely to be relevant for bulk SrRuO3.
The crystalline structure calculations of SrRuO3 available so far were done at its orthorhombic and cubic phases using the LDA framework (see, e.g., Refs. Zayak et al., 2006; Albina et al., 2007; Rondinelli et al., 2008; Hadipour and Akhavan, 2011). A very recent work of García-Fernández . García-Fernández et al. (2012) also includes PBE, PBEsol, and WC functionals together with several combinations of their hybrid schemes. It is somehow surprising that in the literature scarcely any first-principles calculations of tetragonal SrRuO3 have been reported to date. Even more intriguingly, one can hardly find any theoretical as well as experimental investigation on the elastic properties of SrRuO3, except for several polycrystalline measurements for the orthorhombic phase Yamanaka et al. (2004); Dabrowski et al. (2005); Hamlin et al. (2007). In order to at least partially remedy this gap, we have performed an extensive theoretical analysis of experimentally determined phases of SrRuO3 starting from the accuracy of the evaluated lattice constants, then concentrating on elastic properties and mechanical stability, and finally providing some insights into anomalous behavior caused by shear deformation. The obtained results are accordingly presented and discussed in Sec. IV A, B, and C.
II Theoretical background
II.1 DFT approaches
In the LDA framework, the exchange energy has the form
| (1) |
where denotes the electron density and is the exchange energy density per particle for a uniform electron gas. The GGA form for the exchange energy is simply
| (2) |
in which (with Fermi wave vector ) is the dimensionless reduced gradient and is the exchange enhancement factor. Any GGA that reproduces the uniform gas limit can be expressed as Perdew et al. (2008)
| (3) |
and accordingly
| (4) |
where the gradient expansion (GE) that is precise for slowly-varying electron gases has Antoniewicz and Kleinman (1985)
| (5) |
The PBE GGA is nowadays considered as a standard functional for solid-state calculations Haas et al. (2009b). Although this GGA belongs to the class of parameter-free functionals, it still contains some arbitrary choices, e.g., the analytical form of the enhancement factor or the constraints that have to be satisfied. It has been shown Perdew et al. (2008, 2006) that in order to obtain the accurate exchange energy for free neutral atoms, any GGA must have . For the PBE functional, is set to 0.2195 from slightly different requirement which is based on the reproduction of the LDA jellium response. Here, has the form
| (6) |
The parameter , which controls the behavior at , is set to 0.804 according to the relation to ensure the Lieb-Oxford (LO) bound Lieb and Oxford (1981), which is an upper limit on the ratio of the exact exchange-correlation energy to the value of the LDA approximation of the exchange energy with . At the limit of a slowly-varying high density, the GE of the correlation energy of a GGA can be written as
| (7) |
where is the correlation energy per particle of the uniform electron gas, is a coefficient set to 0.0667 (Ref. Ma and Brueckner, 1968), and (with Thomas-Fermi screening wave vector ) denotes an appropriate reduced density gradient for correlation. In the PBE correlation functional, the value of is retained, whereas in PBEsol, it is chosen to be 0.046 in order to reproduce the accurate exchange-correlation energies for a jellium surface obtained at the meta-GGA TPSS (Ref. Tao et al., 2003) level. In the PBEsol exchange functional, the value of , which determines the behavior for , is restored back to , since it has been argued Perdew et al. (2008) that is harmful for many condensed matter applications. This choice allows to recover the second-order GE, but on the other hand, it means that PBEsol no longer satisfies the LDA jellium response, because . Thus, as , there is no complete cancellation between beyond-LDA exchange and correlation contributions. While constructing the PBE functional, this sort of cancellation was believed to be more accurate than the lower-order gradient expansion for small . Although PBE works equally well for finite ant infinite systems Haas et al. (2009b), PBEsol outperforms it in many crystal structure calculations. Nevertheless, this benefit is accompanied by a worsening of the thermochemical properties Zhao and Truhlar (2008). It is evident that due to pretty simple mathematical form of GGA one has to choose between improved atomization energies of molecules or improved lattice parameters of solids Haas et al. (2010).
The SOGGA exchange functional, used in combination with the PBE correlation functional, completely restores the GE to the second order for both exchange and correlation Zhao and Truhlar (2008). The analytical form of the SOGGA exchange enhancement factor is expressed as an average of the PBE and RPBE (Ref. Hammer et al., 1999) exchange functionals
| (8) |
in which . The parameter is set to 0.552 in order to satisfy a tighter LO bound with .
The WC exchange enhancement factor is given by Wu and Cohen (2006)
| (9) |
where
| (10) |
Parameters and have the same values as in PBE and is set to recover the fourth order parameters of the fourth order GE of the exchange functional for small (unfortunately, incorrectly Haas et al. (2009b)). On the whole, the analysis of a large set of solids Haas et al. (2009a) shows that concerning the lattice constants PBEsol, SOGGA, and WC perform quite similarly, and in most cases demonstrate an explicit improvement over LDA and PBE.
We would like to remark that in this paper PBE, SOGGA, and WC exchange functionals are used with the correlation part of PBE, whereas the PBEsol exchange functional is employed with the correlation part of PBEsol and PBE. A separate notation PBEsolPBE is introduced for the latter combination.
II.2 Elastic constants
Under a linear elastic deformation, solid bodies are described by Hooke’s law. In the tensorial form, it can be expressed as
| (11) |
where , , , and are the indices running from 1 to 3, is the stress, is the strain, and is a fourth-rank stiffness or elastic constants tensor having 81 components. In general, elastic constants describe the material’s resistance against an externally applied strain. The symmetry relation reduces the number of independent components to 21, which in turn can be further reduced if the material under consideration possesses its own symmetry. According to Voigt notation (, , , , , ), the components can be arranged in a symmetric matrix. Then, (11) can be written as Grimvall (1999)
| (12) |
where
| (13) |
| (14) |
| (15) |
The relation (12) for the stresses expressed in the strains can be inverted to give strains in terms of the stresses
| (16) |
in which the compliance matrix is inverse to the stiffness matrix .
The total energy of the distorted crystal’s unit cell can be expressed through a Taylor series in terms of the strains
| (17) |
where refers to the equilibrium configuration. Having in mind the relations Wallace (1998)
| (18) |
and
| (19) |
(17) equation may be written in the form of
| (20) |
where denotes the volume of the unstrained unit cell. If the crystalline structure is fully relaxed, the linear term in (20) is equal to zero and the second-order elastic constants can be obtained by evaluating total energy as a function of the applied strains. However, in order to remain in the linear regime, the deformation of the crystal should be sufficiently small. In this work, the magnitude of the applied strains was varied between and 0.03 with a step of 0.005 (with several exceptions for tetragonal and orthorhombic phases, see Sec. IV B) for 9 different deformations (see Table 1) that correspond to the appropriate elastic constants or their combinations. The energy-strain curve of the deformed structures (20) was fitted with polynomials in order to extract the coefficient of a quadratic term which possesses the required data for the evaluation of elastic constants. For a better stability, the polynomials up to order 5 were used during the fitting procedure. While computing the total energy under deformations, the internal atomic positions were allowed to relax with the deformed cell shape and volume remaining fixed.
|
Initial symmetry | Symmetry under deformation |
|
|
|||||||||
|---|---|---|---|---|---|---|---|---|---|---|---|---|---|
|
|
|
|||||||||||
| Orth., No. 62 () | Orth., No. 62 () | 125 | |||||||||||
|
|
|
|||||||||||
|
|
|
|||||||||||
|
|
|
|||||||||||
| Orth., No. 62 () | Orth., No. 62 () | 125 | |||||||||||
|
|
|
|||||||||||
| Orth., No. 62 () | Mon., No. 14 () | 170 | |||||||||||
|
|
|
II.3 Mechanical stability and macroscopic elastic parameters
A solid in equilibrium is mechanically stable if under arbitrary but small deformations the quadratic term in (20) is positive definite for all real values of strains unless the strains are zero. This determines restrictions, expressed in the form of inequalities, for the elastic constants Grimvall (1999). For the cubic, tetragonal, and orthorhombic crystalline structures the necessary conditions for the mechanical stability are given by Beckstein et al. (2001):
| (21) |
| (22) |
| (23) |
respectively.
Since elastic properties of materials can be described in different ways, different relations between single-crystal and polycrystalline parameters exist. As was suggested by Voigt Voigt (1928), the polycrystalline bulk () and shear () moduli can be expressed in the appropriate combinations of single-crystal elastic constants :
| (24) |
| (25) |
Analogously, Reuss Reuss (1929) has derived the bulk and shear moduli expressions in terms of compliance constants :
| (26) |
| (27) |
Voigt has based his formulation on the assumption that the strain is uniform throughout the sample, whereas the stress can be discontinuous. Reuss, on the contrary, has assumed that the stress is uniform allowing the strain to be discontinuous. Since in the first model the forces between the grains will not be in equilibrium, and in the second the distorted grains will not fit together, Hill Hill (1952) has shown that, for any crystalline structure, the assumptions of Voigt and Reuss lead to an upper and lower bounds of and , respectively. In solid-state physics, it is common to use the arithmetic average of Voigt and Reuss bounds for the evaluation of and . It is called the Voigt-Reuss-Hill (VRH) approximation:
| (28) |
Regarding the general relations between Poisson’s ratio (), bulk, shear, and Young’s () moduli Grimvall (1999), the VRH approximation for and can be written in the form of
| (29) |
| (30) |
Alternatively, the bulk modulus can be evaluated by fitting the total energy as a function of volume to the third order Birch-Murnaghan (BM) equation of state:
| (31) |
in which and denote the total energy and volume of equilibrium configuration, respectively, whereas is the volume of deformed structure and stands for the pressure derivative of bulk modulus. The procedure is based on the constant volume but full geometry optimization under (remaining ) deformations of the unit cell. For each phase of SrRuO3, 11 points were fitted within the range of variation of the initial volume . Since in this study all the aforementioned macroscopic elastic parameters by default are presented using VRH approximation, the bulk modulus and its pressure derivative obtained from the BM equation of state will be correspondingly denoted as and .
For polycrystalline material, the longitudinal () and transverse () sound velocities can be written in terms of bulk and shear moduli obtained within the VRH approximation Grimvall (1999):
| (32) |
| (33) |
where denotes the mass density. The Debye temperature then has the form
| (34) |
where
| (35) |
stands for an average sound velocity, is the number of atoms per unit cell, and is its volume.
III Computational details
The first-principles periodic calculations were carried out using CRYSTAL09 (Ref. Dovesi et al., ) code, in which the crystalline wave functions are expanded as a linear combination of atom-centered Gaussian orbitals (LCAO). Equilibrium atomic positions and lattice constants were obtained using analytical gradients of the total energy with respect to atomic coordinates and unit-cell parameters within the quasi-Newton algorithm. The Hessian matrix containing numerical second derivatives of the total energy was updated by means of the Broyden-Fletcher-Goldfarb-Shanno (BFGS) scheme. The initial values of Hessian matrix were generated using a classical model proposed by Schlegel Schlegel (1984); Wittbrodt and Schlegel (1997). Optimization convergence was checked on the root-mean-square (RMS) and the absolute magnitude of the largest components of both the gradients and the estimated nuclear displacements. The optimization was considered complete when these four parameters satisfied the determined thresholds which for the RMS values of gradients and displacements were set to 0.00006 and 0.00012 a.u., respectively. The maximum allowed gradients and displacements were 1.5 times larger. In order to improve the self-consistence field convergence, the Kohn-Sham matrix mixing technique together with modified Broyden’s scheme Johnson (1988) or Anderson’s method Anderson (1965) were applied. The default values of truncation criteria for bielectronic integrals were modified to tighter ones by setting the overlap thresholds for exchange and Coulomb integrals to for orthorhombic and to for tetragonal and cubic phases. Analogously, the tolerance on change in total energy was tightened to a.u. for tetragonal and cubic phases, whereas for the computationally heavier orthorhombic phase the parameter was set to a.u. The number of asymmetric points in the irreducible Brillouin zone used for each of the phase is given in Table 1.
In CRYSTAL09, while numerically evaluating DFT exchange-correlation contribution, grid points are generated using Gauss-Legendre radial quadrature and Lebedev two-dimensional angular point distribution. In this work, an extra large grid was used, which contains 75 radial points and 974 angular points in the most accurate integration region. Concerning the basis sets, small-core Hay-Wadt pseudopotentials Hay and Wadt (1985) (PPs) corresponding to 28 core electrons were applied for both Sr and Ru atoms. The valence part of the basis set for Sr was taken from the strontium titanate study Piskunov et al. (2004). For Ru, the valence functions combined with the Hay-Wadt PP were adopted from the modified LANL2DZ basis set Couty and Hall (1996) available online at EMSL database lan . In order to avoid numerical problems usually caused by too diffuse functions (since they tend to overlap with the core functions of the neighboring atoms), the exponents smaller than 0.08 bohr-2 were removed. The outermost shell exponent bohr-2 was decontracted and, together with the most external shell exponent bohr-2, optimized by attempting to minimize the total energy per unit cell with the lattice constants and atomic positions fixed at experimental values. After optimization, the corresponding and exponents were set to 0.1301 and 0.1329 bohr-2, respectively. For O, the all-electron basis set with a double set of functions was taken from Ref. Valenzano et al., 2006. Basis sets for Sr and O atoms are also available online at CRYSTAL Basis Sets Library cry .
IV Results and discussion
IV.1 Lattice constants
Since the accuracy of the predicted lattice constants is a test of the accuracy of the density functional for the description of the exchange-correlation energy Hao et al. (2012), in the first place we present the equilibrium lattice constants calculated using different DFT approaches. They are shown in Table 2, 3, and 4 for cubic, tetragonal, and orthorhombic phases of SrRuO3, respectively. The available experimental data is also given therein, however no thermal and/or zero-point anharmonic expansion (ZPAE) corrections necessary for the precise comparison between theory and experiment were applied. On one hand, the extrapolation from 973 (cubic phase) or 823 (tetragonal phase) to 0 K using an average linear thermal expansion coefficient would not be accurate and in principle should substantially exceed the effect of ZPAE. Thus, the evaluation of the ZPAE correction alone would neither improve the situation for any of these two phases. On the other hand, the ZPAE correction, most commonly written as Eq. (A6) in Ref. Alchagirov et al., 2001, is applicable only for the cubic systems meaning that the low-temperature experimental data for orthorhombic SrRuO3 can not be simply corrected. Although it is clear that the presented calculations and experimental values should not be compared in a very strict manner, some important trends can still be observed. Having in mind that the combination of thermal effects and ZPAE usually expand lattice constant compared to its value at 0 K, it is evident that PBE tends to overestimate the lattice parameters for all three phases of SrRuO3. The opposite trend is seen for LDA, most obviously for the orthorhombic SrRuO3. In order for the LDA results to perfectly match the experimental data, the ZPAE correction should reach 0.75% of a lattice constant. This scenario is not realistic, since ZPAE can expand the equilibrium lattice constant by 1% for light atoms like Li and much less for heavy atoms Hao et al. (2012). Moreover, the evaluation of ZPAE correction for cubic phase of SrRuO3 reveals that with parameters obtained from different DFT approximations it does not exceed 0.13%. Therefore, it is very likely that LDA and PBE approaches tend to correspondingly underestimate and overestimate lattice constants for all three phases of SrRuO3. This observation is strengthened by the fact that calculated values of the revised functionals fall within the range between LDA and PBE. It is a well known tendency noticed for a large set of solids Haas et al. (2009a). Among the revised functionals, SOGGA gives the lowest, whereas WC gives the highest values for all three phases. However, the difference between the lattice constants is quite small and does not exceed 0.34%, compared to the largest difference of 1.8% between SOGGA and PBE and the one of 1.05% between WC and LDA. The values of PBEsol and PBEsolPBE fall within the inner range between SOGGA and WC. According to the similar performance of the revised functionals, they can be divided into two groups, with SOGGA and PBEsolPBE being in one and PBEsol and WC being in another. On the whole, if one would make an assumption that the ZPAE correction value of 0.13% could be directly applied for the orthorhombic phase of SrRuO3, then all three lattice parameters , , and calculated using all the revised density functionals under study here would have a deviation smaller than 0.5% from the ZPAE-corrected experimental data. That would correspond to the “good” theoretical values. Meanwhile, neither LDA, nor PBE could satisfy this condition despite LDA being noticeably closer to the experiment than PBE. Interestingly, without the application of ZPAE correction the revised functionals would satisfy even a tighter deviation of 0.3%. These observations apparently indicate the effectiveness of the revision made to the construction of the employed density functionals.
| LDA | SOGGA | PBEsolPBE | PBEsol | WC | PBE | Expt. | |
| 3.900 | 3.924 | 3.926 | 3.933 | 3.936 | 3.982 | 3.955111Ref. Kennedy and Hunter, 1998 at 973 K., 3.974222Ref. Chakoumakos et al., 1998 at 1082 K. | |
| 240.2 | 210.3 | 208.7 | 205.4 | 205.6 | 176.9 | ||
| 204.6 | 194.6 | 193.2 | 192.9 | 190.2 | 176.6 | ||
| 76.1 | 73.8 | 73.7 | 73.4 | 73.1 | 70.9 | ||
| 216.5 | 199.8 | 198.4 | 197.1 | 195.3 | 176.8 | ||
| 215.9 | 198.9 | 197.6 | 196.3 | 196.2 | 176.5 | ||
| 4.55 | 4.26 | 4.30 | 4.34 | 4.58 | 4.41 | ||
| 42.9 | 32.1 | 32.0 | 30.2 | 31.8 | 21.1 | ||
| 120.6 | 91.6 | 91.2 | 86.2 | 90.4 | 60.7 | ||
| 0.407 | 0.424 | 0.423 | 0.427 | 0.423 | 0.443 | ||
| 6415 | 6095 | 6082 | 6047 | 6058 | 5724 | ||
| 2539 | 2219 | 2217 | 2157 | 2215 | 1835 | ||
| 2877 | 2520 | 2518 | 2451 | 2515 | 2089 | ||
| 375.5 | 326.9 | 326.3 | 317.2 | 325.4 | 267.1 |
As was mentioned in the Introduction, several theoretical works that include calculated structural parameters of cubic and orthorhombic SrRuO3 can be found in the literature. Naturally, due to the closest resemblance to the low-temperature experimental data the most intriguing is the one that incorporates the revised functionals. The fact that the same computer code was employed in the present paper and Ref. García-Fernández et al., 2012 makes the comparison rather straightforward. Nevertheless, it is surprising to note that all the lattice constants calculated with PBEsol and WC functionals are somewhat larger in Ref. García-Fernández et al., 2012 than in this work despite the tighter convergence criteria applied therein. By taking into account that experimental parameters can only be smaller after the ZPAE correction, one can conclude that our calculations exhibit a better agreement with the low-temperature experiment. The largest mismatch between the same revised functionals reaches up to 0.7% meaning that not all the lattice parameters estimated in Ref. García-Fernández et al., 2012 correspond to the “good” theoretical values. Moreover, the ZPAE correction could make the situation even worse. The possible source of the following discrepancy probably lies in the basis sets utilized in the calculations. Since basis set for Sr is the same in both studies and basis set for O is of the same quality, the factor that remains is the difference in basis sets for Ru. From this observation it is obvious that basis set for a particular element optimized in a system under consideration can become an appreciable advantage. It is interesting to notice that the inclusion of the HF exchange energy partly compensates for the observed mismatch. Although the incorporation of the hybrid scheme also results in overall a better description of tilting and rotation angles, the lattice parameters can be easily overcorrected by increasing the amount of HF exchange. Having in mind that calculations are basis set dependent, the exact amount of hybrid mixing that should be applied becomes unclear. Because of clear-cut physics that stands beyond the revised functionals, we prefer them over the hybrids for the description of SrRuO3.
| LDA | SOGGA | PBEsolPBE | PBEsol | WC | PBE | Expt. | |
| 5.513 | 5.554 | 5.557 | 5.570 | 5.572 | 5.656 | 5.578333Ref. Kennedy and Hunter, 1998 at 823 K., 5.589444Ref. Chakoumakos et al., 1998 at 894 K. | |
| 7.773 | 7.801 | 7.805 | 7.813 | 7.820 | 7.872 | 7.90811footnotemark: 1, 7.91722footnotemark: 2 | |
| 268.9 | 250.5 | 249.1 | 246.7 | 245.8 | 223.8 | ||
| 146.7 | 132.9 | 131.8 | 129.9 | 129.7 | 110.6 | ||
| 185.9 | 172.4 | 171.9 | 170.7 | 170.6 | 151.9 | ||
| 343.8 | 325.1 | 322.6 | 321.7 | 321.1 | 299.9 | ||
| 555calculated within a range of strains from -0.0003 to 0.0003. | 71.6 | 68.8 | 68.7 | 68.8 | 68.6 | 65.7 | |
| 99.4 | 91.1 | 90.3 | 88.1 | 87.7 | 75.6 | ||
| 209.2 | 193.7 | 192.7 | 190.9 | 190.5 | 170.5 | ||
| 205.1 | 189.4 | 187.9 | 186.2 | 185.8 | 165.3 | ||
| 4.83 | 4.89 | 4.81 | 4.82 | 4.85 | 5.19 | ||
| 71.2 | 67.7 | 67.3 | 66.8 | 66.5 | 62.8 | ||
| 191.9 | 181.9 | 180.8 | 179.6 | 178.8 | 167.7 | ||
| 0.347 | 0.344 | 0.344 | 0.343 | 0.344 | 0.336 | ||
| 6746 | 6579 | 6566 | 6556 | 6553 | 6367 | ||
| 3265 | 3212 | 3205 | 3203 | 3199 | 3164 | ||
| 3669 | 3608 | 3600 | 3598 | 3594 | 3551 | ||
| 479.6 | 468.8 | 467.4 | 466.4 | 465.5 | 454.3 |
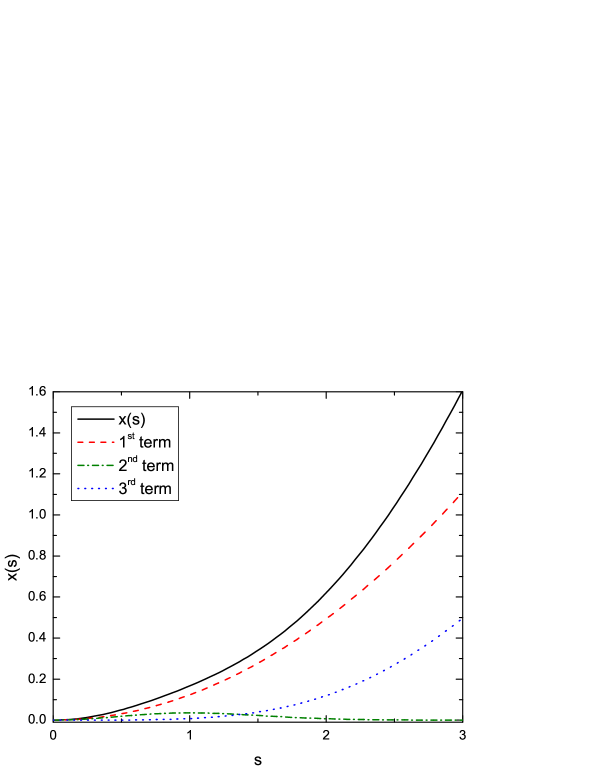
The fact that we used the same correlation functional for SOGGA, PBEsolPBE, WC, and PBE allows us to present a few significant insights into the inner structure of SrRuO3. Firstly, the step that leads from to seems to be the most important for the accurate description of the lattice parameters of SrRuO3. This can be easily noticed by comparing the results of PBEsolPBE and PBE, since the only difference between these two functionals is the value of parameter , which was set from to . Secondly, the modification of parameter (), which appears in the correlation functional, has much less impact (seen from comparison between PBEsolPBE and PBEsol), indicating that the magnitude of the exchange energy is substantially larger compared to the correlation energy. What is more, a close look at Fig. 1 in Ref. Wu and Cohen, 2006 reveals that and are nearly identical for . Having in mind that the lattice constants obtained with PBE and WC functionals are noticeably different, one can make an assumption that the average reduced density gradient should exceed this value in SrRuO3. Although the WC functional has rather complicated form, which ensures the same behavior as PBE for and , examination of the terms in , presented in Fig. 1, shows that at values larger than 0.5 the first term starts dominating over the remaining two terms. Since this term is exactly the same as it is in PBEsol, it becomes clear why these two functionals having distinct values are both able to yield “good” theoretical results. This once again confirms the significance of the exact second-order GE for the description of the lattice parameters of SrRuO3.
| LDA | SOGGA | PBEsolPBE | PBEsol | WC | PBE | Expt. | |
| 5.527 | 5.556 | 5.558 | 5.568 | 5.570 | 5.631 | 5.566666Ref. Bushmeleva et al., 2006 at 1.5 K., 5.566777Ref. Kiyama et al., 1996 at 12 K. | |
| 5.491 | 5.529 | 5.533 | 5.543 | 5.548 | 5.621 | 5.53211footnotemark: 1, 5.52922footnotemark: 2 | |
| 7.779 | 7.824 | 7.828 | 7.841 | 7.846 | 7.937 | 7.84511footnotemark: 1, 7.84422footnotemark: 2 | |
| 306.9 | 286.9 | 285.2 | 284.8 | 284.2 | 260.1 | ||
| 186.7 | 171.1 | 169.5 | 167.9 | 167.8 | 143.4 | ||
| 156.2 | 145.1 | 144.4 | 143.6 | 143.4 | 128.2 | ||
| 274.5 | 256.9 | 255.6 | 253.9 | 252.7 | 230.1 | ||
| 147.7 | 139.8 | 139.1 | 138.3 | 137.9 | 125.9 | ||
| 338.6 | 312.6 | 310.8 | 307.3 | 306.8 | 272.1 | ||
| 888calculated within a range of strains from -0.015 to 0.015. | 72.7 | 71.4 | 71.9 | 72.2 | 72.4 | 71.1 | |
| 67.7 | 66.4 | 66.4 | 66.7 | 66.7 | 65.9 | ||
| 88.1 | 80.9 | 80.1 | 78.7 | 78.4 | 67.3 | ||
| 210.8 | 196.1 | 194.9 | 193.6 | 193.1 | 172.7 | ||
| 210.5 | 195.9 | 194.4 | 192.8 | 192.5 | 172.8 | 192.3999Ref. Hamlin et al., 2007 at room temperature. | |
| 4.75 | 4.64 | 4.67 | 4.65 | 4.66 | 4.69 | 5.0344footnotemark: 4 | |
| 72.8 | 69.3 | 69.1 | 68.9 | 68.7 | 64.6 | 60.1101010Ref. Yamanaka et al., 2004 at room temperature. | |
| 195.8 | 185.9 | 185.4 | 184.7 | 184.3 | 172.3 | 16155footnotemark: 5 | |
| 0.345 | 0.342 | 0.341 | 0.341 | 0.341 | 0.334 | ||
| 6782 | 6625 | 6614 | 6613 | 6612 | 6416 | 631255footnotemark: 5 | |
| 3298 | 3246 | 3246 | 3249 | 3248 | 3206 | 308355footnotemark: 5 | |
| 3706 | 3646 | 3645 | 3648 | 3648 | 3596 | ||
| 484.5 | 472.8 | 473.5 | 473.1 | 472.7 | 460.6 | 44855footnotemark: 5, 457111111Ref. Dabrowski et al., 2005 from fitting in the temperature range of 163-300 K. |
Another close look at Fig. 1 in Ref. Zhao and Truhlar, 2008 indicates that the SOGGA and PBEsol curves are almost identical up to . This observation is perfectly consistent with the results of SOGGA and PBEsolPBE which due to very close performance were assigned to the same group. If the average value of would be higher, we should obtain a more pronounced difference between SOGGA and PBEsolPBE. However, the difference is negligible, meaning that the average value of should fall in the range of . Such range testifies about a moderately-varying density in SrRuO3. It is interesting to note that another group of functionals - PBEsol and WC - also yielding very similar results have different parameters in exchange and correlation parts. As we have already found out that the first term in is mainly responsible for the performance of WC, one can note that the effect of the addition of remaining two terms somewhat corresponds to the effect of the modification of correlation functional in PBEsol. It is also worth mentioning that the , which is taken as a half-and-half mixing of the PBE and RPBE exchange functionals, would produce larger lattice constants if the parameter remains the same as in PBE (). The tighter value of 0.552 somehow compensates for this increase resulting in almost identical behavior to PBEsol up to .
From all above we can conclude that regarding the accuracy of the lattice constants no clear winner has emerged among the revised functionals. It is very likely that all the revised functionals applied in this work should give “good” theoretical values, at least for the orthorhombic phase of SrRuO3. A small deviation between the calculated results shows that the change in the form of the exchange enhancement factor (WC and SOGGA) or variation of parameter (PBEsol) does not have a noticeable influence. Therefore, the PBE-like functionals with the parameter restored back to 10/81 can be considered as simple but reliable tool for the investigation of the crystalline structure of SrRuO3. For this reason, we choose PBEsol as a default functional for the demonstration of SrRuO3 behavior and properties throughout this study.
IV.2 Elastic properties and mechanical stability
Due to the lack of experimental as well as theoretical data, we can only make a comparison between our own elastic constants obtained within different DFT approaches. The tendency that can be observed is exactly opposite to the one found for the lattice constants. In this case, LDA gives the highest, whereas PBE gives the lowest values of for all three phases of SrRuO3. The revised functionals perform quite similarly giving the values that fall between the range determined by LDA and PBE. This result once more confirms that such quantities as elastic constants and polycrystalline moduli crucially depend on reliable evaluation of the lattice parameters.
Concerning the values of for tetragonal and orthorhombic phases of SrRuO3, a few issues must be clarified. Firstly, our calculations for tetragonal structure show that strains taken in steps of 0.005 from -0.03 to 0.03 induce internal forces that drive lattice to the energetically lower states compared to the unstrained crystal (see Fig. 2). Neither different DFT approaches, nor modification of calculation parameters have appreciable influence on this result. This basically means that tetragonal SrRuO3 is mechanically unstable at zero temperature (and zero pressure com (a)) in spite of the fact that remaining satisfy all the stability conditions given by Eq. (22). In other words, under ordinary related deformation a more stable monoclinic structure emerges resulting in a negative value of which in turn characterizes a pure shear instability. The following finding is in agreement with the fact that bulk samples of tetragonal phase have not been experimentally observed at low temperatures. Yet, it is worth to note that room-temperature stabilized tetragonal SrRuO3 has been successfully obtained by tensile biaxial strain when grown as thin film on various substrates Vailionis et al. (2008); Chang et al. (2011). We would like to emphasize that these results are not in contradiction with our data, since the stability of thin film is determined by different factors compared to the bulk specimens Wang et al. (2003). However, a question of what exactly makes the tetragonal phase experimentally observable at high temperatures requires a separate study, therefore this interesting issue lies outside the scope of the present paper.
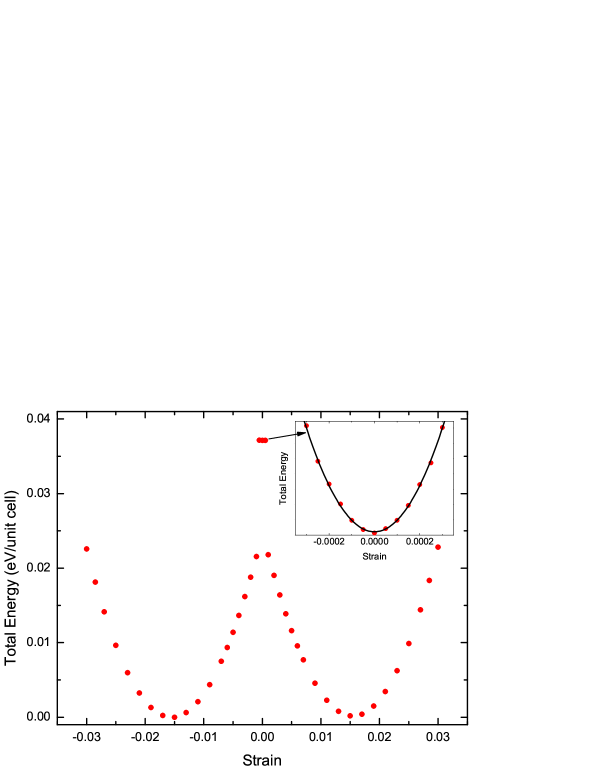
By remembering that the elastic energy, written as quadratic term in (20), must be positive definite under any arbitrary but small deformations, we were curious to find out whether the limit at which the system can be described by the usual parabolic behavior exists. For this purpose, we had to narrow the range of the applied strains and to tighten the convergence criteria. The first attempt to reduce the magnitude of the applied strains from -0.003 to 0.003 was not successful, since the total energy of the strained lattice was still lower than that of the unstrained one. However, the second attempt in which the magnitude of the applied strains was lowered from -0.0003 to 0.0003 appeared to be fruitful (see inset in Fig. 2). Certainly, in the first place we wanted to make sure that such calculations with very small changes in the total energy were not overpowered by numerical fluctuations and thus could be treated seriously. For the comparison, we tried to evaluate without the geometry optimization (i. e. elastic constant of the unrelaxed structure) by varying from -0.03 to 0.03 and from -0.0003 to 0.0003. The obtained results for PBEsol revealed that in both cases the values of were very close to each other: 85.6 against 86.3 GPa, respectively. Despite this correspondence, it is obvious that in reality even at temperatures very close to 0 K zero-point fluctuations have a larger impact on atomic positions than such tiny strains. But since in DFT framework nuclei of the atoms form a perfectly static lattice, even the smallest atomic displacements in the system can be treated as reflecting its unique response to deformation. Thus, a purely theoretical modeling allows to analyze material’s behavior that could be never observed experimentally due to manifestation of quantum effects. Having in mind the thorough analysis Perger et al. (2009) in which the stability of elastic constants is attained using similarly small deformations, the values of presented in Table 3 should provide realistic information on properties of tetragonal SrRuO3. Surely, it would be particularly interesting to find out whether our results show a correspondence with the experiment or at least finite-temperature calculations.
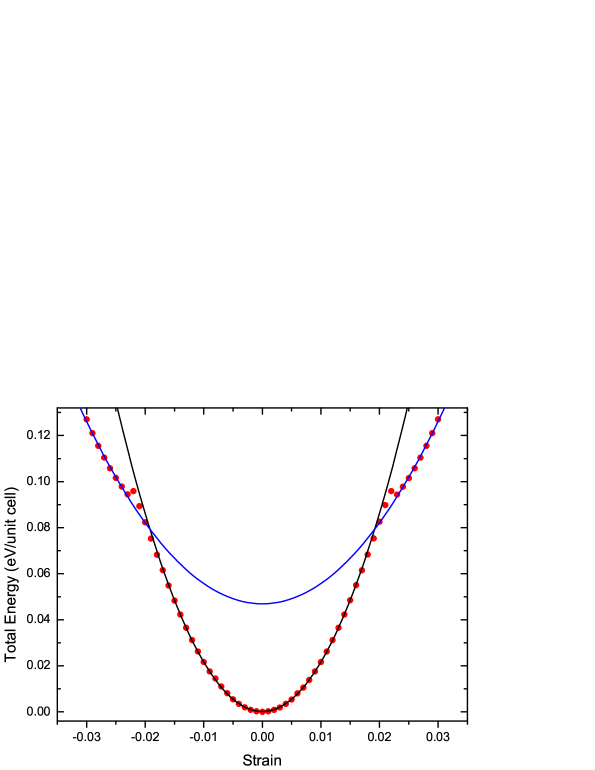
Another issue is related to the calculation of for the orthorhombic phase of SrRuO3. The application of strains taken from the standard range (from -0.03 to 0.03) has revealed a distinct deviation from the initial parabolic behavior apparently seen at strain values of 0.021 - 0.024 (depending on the DFT approach used - in case of PBEsol, see Fig. 3). Interestingly, the subsequent behavior of the deformed material can be approximated by another parabola with quadratic coefficient being roughly two times smaller. It indicates that the strain-induced structural transformation causes quite substantial softening of . The fact that the crystallographic space group of the system remained unchanged throughout the whole range of applied strains makes us firmly believe that we are dealing with isosymmetric phase transition, which is a fairly rare phenomenon for crystalline materials. In order to get a more accurate picture of isosymmetric SrRuO3 behavior, we have increased the number of strains from standard 12 to 60. A close examination of calculations showed that a small deviation from the initial parabola begins to emerge at 0.017. Therefore, for the precise evaluation of , we have confined the range of strains from -0.015 to 0.015. Thus obtained values of are presented in Table 4.
Despite the unusual behavior of orthorhombic SrRuO3, the mechanical stability of this phase is beyond doubt, since all the elastic constants calculated within the standard range of strains obey the stability criteria expressed by Eq. (23). The same statement holds for the cubic phase of SrRuO3 because its mechanical stability conditions [Eq. (21)] are also satisfied. However, the stability restrictions do not tell much about the relative magnitudes of elastic constants which in general reflect the strength of the interatomic forces in the solid. For example, the comparison between tetragonal and orthorhombic phases indicates that and . As , , and are directly associated with the changes in the lattice along the , , and axis, respectively, one can conclude that atomic bonding along the axis is stronger than that along the or axis for both phases of SrRuO3. Smaller values of and compared to mean that lattice is more easily deformed by a pure shear around the or axis in comparison to the axis. Since bulk modulus is essentially a special case of elastic constant and can be treated as a measure of the average bond strength, it is interesting to note that all three phases exhibit a very close value of it. This means that polycrystalline SrRuO3 retains its level of compressibility throughout a variety of geometric configurations. The fact that the largest discrepancy between the bulk moduli obtained using VRH approximation and BM equation of state does not exceed 3% demonstrates the reliability of performed calculations. Unlike the bulk modulus, shear and Young’s moduli which describe the resistance of a material against the shear and uniaxial deformations, respectively, have significantly lower values for cubic SrRuO3 compared to the tetragonal and orthorhombic phases. Due to the interdependence between the polycrystalline parameters, the opposite tendency holds for Poisson’s ratio which in turn defines the lateral structural deformation when material is stretched or compressed. For high-temperature cubic SrRuO3, the average value of is 0.42, whereas low-temperature orthorhombic SrRuO3 exhibits 0.34 which is a common value for most of the metals. Lower shear modulus for cubic SrRuO3 also points to lower hardness and hence the decreased resistance against plastic deformation. Despite that, a high ratio is inherent for all three phases of SrRuO3 revealing that this material behaves in a ductile manner. The most common critical value that separates ductile and brittle nature was established by Pugh Pugh (1954): if , the material behaves in a ductile manner, otherwise, its behavior should be associated with brittleness. Intriguingly, SrRuO3 satisfies even tighter criterion of proposed by Frantsevich . Frantsevich et al. (1982) which in a similar fashion distinguishes ductility from brittleness. It is worth mentioning that the following result is valid for all density functionals applied in this study. The fact that cubic SrRuO3 becomes softer against shear-type distortions is also reflected in the lower sound velocities and Debye temperature. In the meantime, tetragonal phase is able to retain values of polycrystalline parameters that are very close to the orthorhombic ones.
Another property that should be taken into account for the comprehensive description of the polycrystalline material is its elastic anisotropy. Having in mind that there is no unique method to determine the degree of this characteristic, in the first place we employ a concept introduced by Chung and Buessem Chung and Buessem (1967) where the percentage anisotropy in compressibility and shear is defined as and , respectively. A value of zero corresponds to elastic isotropy and a value of 100% identifies the largest possible anisotropy. Within PBEsol approximation, orthorhombic phase possesses % and %, while tetragonal SrRuO3 acquires % and %. This result reveals that orthorhombic and tetragonal SrRuO3 are similarly anisotropic in shear, whereas anisotropy in compressibility is more pronounced for the latter symmetry. On the whole, the values of anisotropic factors show that orthorhombic and tetragonal phases can be considered as weakly elastically anisotropic. However, completely different situation emerges for cubic SrRuO3. Although in this case isotropy in compressibility is assured by , a very large value of % indicates a high degree of anisotropy in shear. It in turn means that cubic phase can be considered as highly elastically anisotropic. The following conclusions are also confirmed by estimation of universal elastic anisotropy index proposed by Ranganathan and Ostoja-Starzewski Ranganathan and Ostoja-Starzewski (2008). In this analysis method, the departure of from zero defines the extent of single crystal anisotropy accounting for both the bulk and the shear contributions. For orthorhombic, tetragonal, and cubic SrRuO3, the values of are 0.16, 0.23, and 11.8, respectively, showing full compatibility with our previous findings.
Although experimental data available for orthorhombic phase of SrRuO3 allow to provide a few thoughts on the suitability of applied approximations, the comparison between experiment and theory is not straightforward. It is because of temperature and zero-point phonon effects which in general tend to reduce the elastic moduli. Therefore, one should expect the calculated parameters to be lower at room temperature. For example, the thermal effects can modify the bulk modulus by about 5-15%, while zero-point phonon contribution can reach 1-5% for various metals Csonka et al. (2009). Besides, one should also remember that uncertainties in experimental bulk moduli are much greater than in lattice constants and can easily be as large as 10% (Ref. Staroverov et al., 2004). By taking into account all these considerations, we can conclude that overall our calculated polycrystalline parameters demonstrate a good agreement with available experimental data. Yet, it is not easy to say which of the particular functionals perform best. The general trend observed for the lattice constants of orthorhombic SrRuO3 suggests that it is very likely that revised functionals may yield the closest values to the possible low-temperature experiment, while LDA and PBE may show a slight overestimation and underestimation, respectively.
IV.3 Shear deformation for orthorhombic SrRuO3
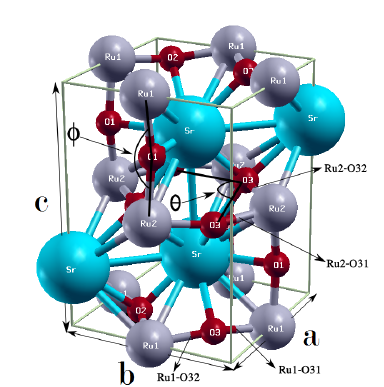
Under related shear deformation the orthorhombic structure of SrRuO3 transforms to monoclinic symmetry. This strain-induced symmetry-reduction is accompanied by the change of the number of non-equivalent Ru and O atoms. As can be seen from Fig. 4, non-equivalent Ru atoms, labelled as Ru1 and Ru2, form repetitive layers perpendicular to the c axis, whilst non-equivalent O atoms, named as O1, O2, and O3, are located within the Ru-formed layers (O2 and O3) or between them (O1). The following structural transformation indicates the emergence of two non-equivalent oxygen octahedra, namely, Ru1O6 and Ru2O6. The first one consists of three pairs of O1, O2, and O3 atoms, whereas the second one possesses a pair of O1 and four O3 atoms. The fact that oxygen octahedra are not regular in strain-free SrRuO3 (Ref. Zayak et al., 2006) is also reflected in the structure of Ru1O6 and Ru2O6 implying that a larger set of parameters is required for the complete description of geometry of deformed SrRuO3. However, one should remember that octahedra form a three-dimensional network, thus a change in bond length or angle in one direction necessarily restricts the allowed change in bond length or angle in other directions.
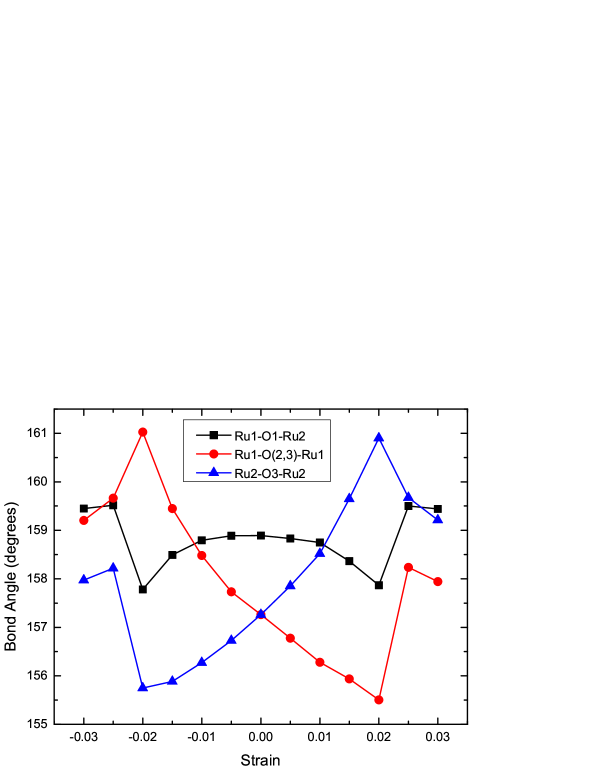
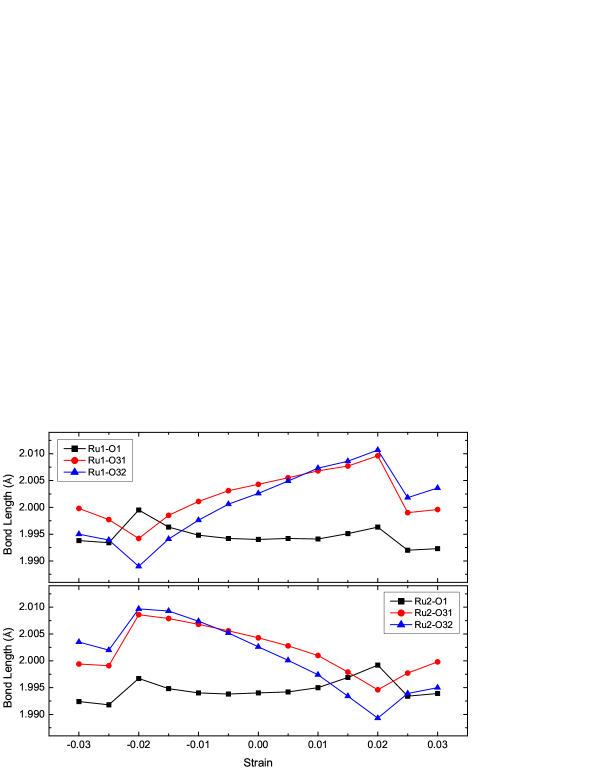
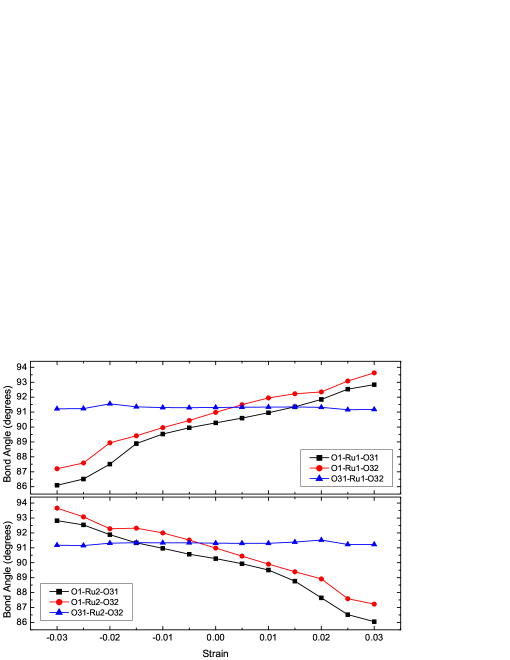
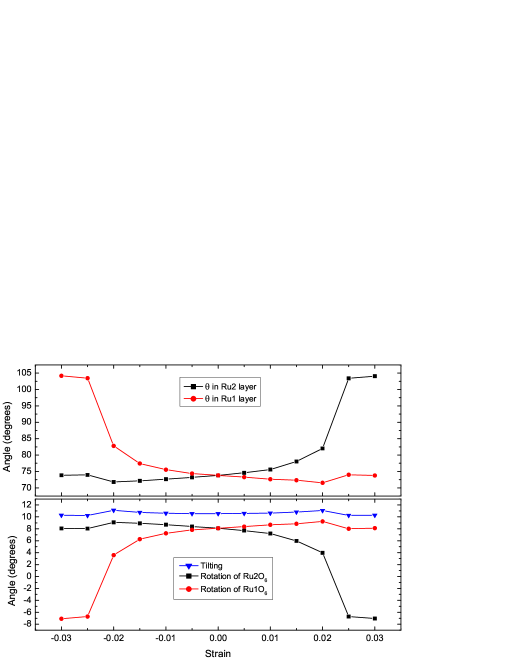
On one hand, structural distortions are highly significant because they have a profound influence on the electronic properties of perovskites. But on the other hand, strain response is in general complex even for ostensibly simple materials meaning that ordinary models in which oxygen octahedra are treated as rigid units or response of octahedral rotations is ignored may not be reliable Rondinelli and Spaldin (2011). For this reason, in Figs. 5, 6, 7, and 8 we present a comprehensive set of parameters associated with strain-induced variations in bond lengths and angles between Ru and O atoms. The notation Ru1-O(2,3)-Ru1, introduced in Fig. 5, indicates that bond angles Ru1-O2-Ru1 and Ru1-O3-Ru1 are equal to each other (see Fig. 4). For the sake of simplicity, we did not include bond lengths labeled as Ru1-O21 and Ru1-O22, since they fully correspond to Ru1-O31 and Ru1-O32. The same goes for notation available in Fig. 7 which in turn describes the unique bond angles existing in Ru1O6 and Ru2O6 octahedra. The bond lengths with double oxygen indices (e. g., Ru1-O31 and Ru1-O32) can be treated as the shortest distances between an oxygen atom and two equivalent ruthenium atoms located in opposite directions. Data presented in Figs. 6 and 7 completely define the evolution in internal geometry of oxygen octahedra. One can notice that RuO6 are not regular in unstrained SrRuO3 and their irregularity becomes even more pronounced when magnitude of strains is increased. We would also like to stress the symmetric correspondence between structural parameters under compressive and respective tensile strains. This indicates the independence from strain character; the most important factor is the direction of shear deformation, since or related deformations (around or axis, respectively) do not exhibit deviations from the usual response. Analysis of Figs. 5 and 6 reveals that strain influence on the Ru-O-Ru bond angles and Ru-O bond lengths cannot be separated because a reduction in bond angle is always compensated for by an increase in appropriate bond lengths, and vice versa. Overall, the complexity of geometric response to strain, seen in Figs. 5-7, makes it hard to identify the mechanism which could be apparently linked to the extraordinary behavior of SrRuO3. Fortunately, in Fig. 7 one can note that unlike the bond angles associated with the apical oxygen O1, O31-Ru-O32 show only negligible variations in magnitude. The following observation is perfectly consistent with data presented in Fig. 8. Here, it is clearly seen that in case of tensile deformation, in Ru2 layer undergoes a huge increase reaching 21 degrees, while a step between two consecutive strains is only 0.005 - from 0.02 to 0.025. By taking into account that bond angle O31-Ru2-O32 remains almost unaltered, it becomes evident that a significant rotation of Ru2O6 octahedra occurs, with a change in rotation angle reaching 11 degrees. In the meantime, variation in rotation of Ru1O6 octahedra as well as tilting stays quite small compared to that of Ru2O6. The opposite trend can be observed as the deformation becomes compressive; in this case, a significant (and approximately equal in magnitude) rotation of Ru1O6 octahedra occurs while rotation of Ru2O6 and tilting show small variations from their initial values. Interestingly, the initial RuO6 octahedral rotation pattern com (b) inherent for space group is no longer maintained under related deformation. It means that adjacent octahedra along axis begin to rotate in opposite directions. This out-of-phase nature of octahedral rotation is easily recognized from Fig. 8. in which the increase in Ru1O6 rotation angle is followed by the decrease in Ru2O6 rotation angle, and vice versa.
Although Fig. 7 indicates that RuO6 octahedra become less rigid with increasing magnitude of applied strains, one should pay attention that O-Ru-O bond angles demonstrate more-or-less continuous evolution. In contrast, Figs. 5, 6, and 8 show an abrupt discontinuity at the critical strain value falling in the range of 0.02 - 0.025. This behavior is clearly reflected in deviation from the initial parabola exhibited in Fig. 3. As we have mentioned earlier, the fact that an abrupt change in SrRuO3 behavior is not accompanied by a change in crystallographic space group speaks for the manifestation of isosymmetric phase transition. Although geometrically complex response to strain handicaps the analysis, our observation that tilting angle demonstrates small changes compared to rotation angles and O31-Ru-O32 show tiny variations in magnitude allows us to point out the essential signature of isosymmetric phase transition - vast rotations of oxygen octahedra around axis. Moreover, the rotation pattern manifests itself in such a way that under tension the Ru2O6 octahedra are much more active in comparison to Ru1O6, whereas under compression the opposite is observed. We would like to notice that this process is simultaneously followed by an increasing deviation in the rigidity of RuO6 thus introducing some uncertainty about the suitability of the deduced scheme. But despite that, strongly pronounced rotations of oxygen octahedra seem to be the most evident mechanism that could be associated with the isosymmetric phase transition in SrRuO3.
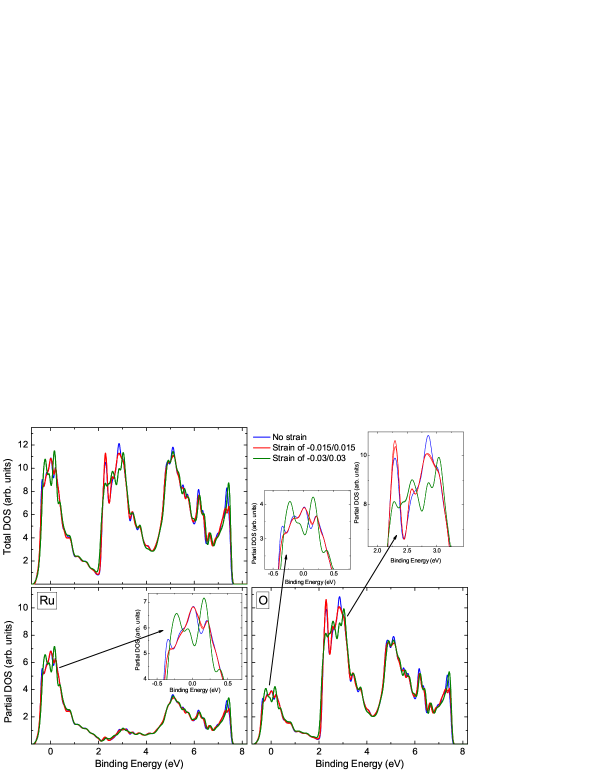
In order to find out the influence the isosymmetric phase transition has on the electronic structure, we also include Fig. 9 in which the total and partial density of states (DOS) at several values of strain is presented. Notation -0.015/0.015 and -0.03/0.03 indicates that SrRuO3 behavior basically does not depend on whether the applied deformation is compressive or tensile. The insets presented herein reveal an apparent change in the evolution of the spectra, especially in the vicinity of the Fermi energy for Ru and at slightly higher binding energies for O. It is clearly seen that the curves representing DOS of unstrained SrRuO3 and SrRuO6 under -0.015/0.015 deformation exhibit a close resemblance, while a curve of -0.03/0.03 strain substantially changes its profile. Having in mind that the intensity of Ru character at the Fermi level is directly associated with the resistivity of this perovskite Toyota et al. (2005), it becomes obvious that isosymmetric phase transition indeed has a great impact on the electronic and most probably other important properties of SrRuO3. It is interesting to note that isosymmetric phase transition has been recently identified in biaxially strained LaGaO3 (Ref. Rondinelli and Coh, 2011), LaNiO3 (Ref. May et al., 2010), and BiFeO3 (Refs. Zeches et al., 2009; Hatt et al., 2010) films. For these perovskite-structured materials, the isosymmetric phase transition is accompanied by a sharp discontinuity in the magnitude of the tilting and rotation angles which in turn is followed by an abrupt reorientation of the octahedral rotation axis direction. However, no similar trend was observed for biaxially strained orthorhombic SrRuO3 (Ref. Zayak et al., 2006), making our results even more intriguing.
V Conclusions
In this paper, we have studied structural and elastic properties of experimentally observed phases of SrRuO3 by means of standard and revised DFT approximations. The accuracy of the calculated lattice parameters demonstrates that the PBE-like functionals with the parameter restored back to 10/81 can be considered as simple but reliable tool for the investigation of the crystalline structure of SrRuO3. A comparison between the performance of revised functionals reveals a moderately-varying electron density in SrRuO3, whereas a comparison with available theoretical calculations indicates the importance of the properly optimized basis set for Ru. Concerning the elastic properties, no experimental data for single-crystal elastic constants exist, meanwhile the polycrystalline measurements are only available for the low-temperature orthorhombic symmetry. However, our calculations show that polycrystalline SrRuO3 is able to retain its level of compressibility throughout a variety of geometric configurations. In addition, all three phases under investigation here behave in a ductile manner despite tetragonal and orthorhombic SrRuO3 being harder against shear-type distortions. The latter two structures can also be considered as weakly elastically anisotropic, while cubic SrRuO3 exhibits a high degree of anisotropy in shear. Regarding related shear deformation, two important issues were clarified. The first one is independent of computational parameters or DFT approaches used and involves mechanical instability of tetragonal SrRuO3 at zero temperature and pressure. In short, related shear deformation forces the system to occupy the energetically lower states compared to the strain-free crystal. The mechanism which is responsible for its experimentally observed stability at high temperatures requires a further study. The second issue only quantitatively depends on DFT approximation and involves isosymmetric phase transition of orthorhombic SrRuO3. Briefly, under related shear deformation the system displays a distinct deviation from the initial parabolic behavior at the critical strain values of 0.021 - 0.024. The mechanism which can be associated with the following discontinuity in behavior is a strongly pronounced out-of-phase rotation of oxygen octahedra around axis. The isosymmetric phase transition is also accompanied by a variation in electronic structure and very likely other important properties of SrRuO3.
Acknowledgements.
The authors are thankful for the computational resources provided by the Faculty of Mathematics and Informatics of Vilnius University. Š.M. also gratefully acknowledges the Research Council of Lithuania for the financial support.References
- Mazin and Singh (1997) I. I. Mazin and D. J. Singh, Phys. Rev. B 56, 2556 (1997).
- Kim et al. (2005) J. Kim, J. Chung, and S.-J. Oh, Phys. Rev. B 71, 121406 (2005).
- Siemons et al. (2007) W. Siemons, G. Koster, A. Vailionis, H. Yamamoto, D. H. A. Blank, and M. R. Beasley, Phys. Rev. B 76, 075126 (2007).
- Herranz et al. (2005) G. Herranz, F. Sánchez, J. Fontcuberta, M. V. García-Cuenca, C. Ferrater, M. Varela, T. Angelova, A. Cros, and A. Cantarero, Phys. Rev. B 71, 174411 (2005).
- Eom et al. (1992) C. B. Eom, R. J. Cava, R. M. Fleming, J. M. Phillips, R. B. van Dover, J. H. Marshall, J. W. P. Hsu, J. J. Krajewski, and W. F. Peck, Jr., Science 258, 1766 (1992).
- Eom et al. (1993) C. B. Eom, R. B. V. Dover, J. M. Phillips, D. J. Werder, J. H. Marshall, C. H. Chen, R. J. Cava, R. M. Fleming, and D. K. Fork, Appl. Phys. Lett. 63, 2570 (1993).
- Wu et al. (1993) X. D. Wu, S. R. Foltyn, R. C. Dye, Y. Coulter, and R. E. Muenchausen, Appl. Phys. Lett. 62, 2434 (1993).
- He et al. (2004) F. He, B. O. Wells, Z.-G. Ban, S. P. Alpay, S. Grenier, S. M. Shapiro, W. Si, A. Clark, and X. X. Xi, Phys. Rev. B 70, 235405 (2004).
- Shin et al. (2005) J. Shin, S. Kalinin, H. Lee, H. Christen, R. Moore, E. Plummer, and A. Baddorf, Surf. Sci. 581, 118 (2005).
- Palai et al. (2009) R. Palai, H. Huhtinen, J. F. Scott, and R. S. Katiyar, Phys. Rev. B 79, 104413 (2009).
- Jones et al. (1989) C. W. Jones, P. D. Battle, P. Lightfoot, and W. T. A. Harrison, Acta Crystallogr., Sect. C: Cryst. Struct. Commun. C45, 365 (1989).
- Kennedy and Hunter (1998) B. J. Kennedy and B. A. Hunter, Phys. Rev. B 58, 653 (1998).
- Chakoumakos et al. (1998) B. C. Chakoumakos, S. E. Nagler, S. T. Misture, and H. M. Christen, Physica B 241-243, 358 (1998).
- Yamanaka et al. (2004) S. Yamanaka, T. Maekawa, H. Muta, T. Matsuda, S. Kobayashi, and K. Kurosaki, J. Solid State Chem. 177, 3484 (2004).
- Kennedy et al. (2002) B. J. Kennedy, B. A. Hunter, and J. R. Hester, Phys. Rev. B 65, 224103 (2002).
- Bushmeleva et al. (2006) S. N. Bushmeleva, V. Y. Pomjakushin, E. V. Pomjakushina, D. V. Sheptyakov, and A. M. Balagurov, J. Magn. Magn. Mat. 305, 491 (2006).
- Kiyama et al. (1996) T. Kiyama, K. Yoshimura, K. Kosuge, Y. Ikeda, and Y. Bando, Phys. Rev. B 54, R756 (1996).
- Perdew et al. (2008) J. P. Perdew, A. Ruzsinszky, G. I. Csonka, O. A. Vydrov, G. E. Scuseria, L. A. Constantin, X. Zhou, and K. Burke, Phys. Rev. Lett. 100, 136406 (2008).
- Zhao and Truhlar (2008) Y. Zhao and D. G. Truhlar, J. Chem. Phys. 128, 184109 (2008).
- Wu and Cohen (2006) Z. Wu and R. E. Cohen, Phys. Rev. B 73, 235116 (2006).
- Csonka et al. (2009) G. I. Csonka, J. P. Perdew, A. Ruzsinszky, P. H. T. Philipsen, S. Lebègue, J. Paier, O. A. Vydrov, and J. G. Ángyán, Phys. Rev. B 79, 155107 (2009).
- Haas et al. (2010) P. Haas, F. Tran, P. Blaha, L. S. Pedroza, A. J. R. da Silva, M. M. Odashima, and K. Capelle, Phys. Rev. B 81, 125136 (2010).
- Nishimatsu et al. (2010) T. Nishimatsu, M. Iwamoto, Y. Kawazoe, and U. V. Waghmare, Phys. Rev. B 82, 134106 (2010).
- Haas et al. (2009a) P. Haas, F. Tran, and P. Blaha, Phys. Rev. B 79, 085104 (2009a).
- Dirac (1930) P. A. M. Dirac, Proc. Camb. Philos. Soc. 26, 376 (1930).
- Perdew and Zunger (1981) J. P. Perdew and A. Zunger, Phys. Rev. B 23, 5048 (1981).
- Perdew et al. (1996) J. P. Perdew, K. Burke, and M. Ernzerhof, Phys. Rev. Lett. 77, 3865 (1996).
- Etz et al. (2012) C. Etz, I. V. Maznichenko, D. Böttcher, J. Henk, A. N. Yaresko, W. Hergert, I. I. Mazin, I. Mertig, and A. Ernst, Phys. Rev. B 86, 064441 (2012).
- Grebinskij et al. (2013) S. Grebinskij, Š. Masys, S. Mickevičius, V. Lisauskas, and V. Jonauskas, Phys. Rev. B 87, 035106 (2013).
- Š. Masys et al. (2010) Š. Masys, S. Mickevičius, S. Grebinskij, and V. Jonauskas, Phys. Rev. B 82, 165120 (2010).
- Gou et al. (2011) G. Gou, I. Grinberg, A. M. Rappe, and J. M. Rondinelli, Phys. Rev. B 84, 144101 (2011).
- Zayak et al. (2006) A. T. Zayak, X. Huang, J. B. Neaton, and K. M. Rabe, Phys. Rev. B 74, 094104 (2006).
- Albina et al. (2007) J.-M. Albina, M. Mrovec, B. Meyer, and C. Elsässer, Phys. Rev. B 76, 165103 (2007).
- Rondinelli et al. (2008) J. M. Rondinelli, N. M. Caffrey, S. Sanvito, and N. A. Spaldin, Phys. Rev. B 78, 155107 (2008).
- Hadipour and Akhavan (2011) H. Hadipour and M. Akhavan, Eur. Phys. J. B 84, 203 (2011).
- García-Fernández et al. (2012) P. García-Fernández, S. Ghosh, N. J. English, and J. A. Aramburu, Phys. Rev. B 86, 144107 (2012).
- Dabrowski et al. (2005) B. Dabrowski, M. Avdeev, O. Chmaissem, S. Kolesnik, P. W. Klamut, M. Maxwell, and J. D. Jorgensen, Phys. Rev. B 71, 104411 (2005).
- Hamlin et al. (2007) J. J. Hamlin, S. Deemyad, J. S. Schilling, M. K. Jacobsen, R. S. Kumar, A. L. Cornelius, G. Cao, and J. J. Neumeier, Phys. Rev. B 76, 014432 (2007).
- Antoniewicz and Kleinman (1985) P. R. Antoniewicz and L. Kleinman, Phys. Rev. B 31, 6779 (1985).
- Haas et al. (2009b) P. Haas, F. Tran, P. Blaha, K. Schwarz, and R. Laskowski, Phys. Rev. B 80, 195109 (2009b).
- Perdew et al. (2006) J. P. Perdew, L. A. Constantin, E. Sagvolden, and K. Burke, Phys. Rev. Lett. 97, 223002 (2006).
- Lieb and Oxford (1981) E. H. Lieb and S. Oxford, Int. J. Quantum Chem. 19, 427 (1981).
- Ma and Brueckner (1968) S.-K. Ma and K. A. Brueckner, Phys. Rev. 165, 18 (1968).
- Tao et al. (2003) J. Tao, J. P. Perdew, V. N. Staroverov, and G. E. Scuseria, Phys. Rev. Lett. 91, 146401 (2003).
- Hammer et al. (1999) B. Hammer, L. B. Hansen, and J. K. Nørskov, Phys. Rev. B 59, 7413 (1999).
- Grimvall (1999) G. Grimvall, Thermophysical properties of materials (North-Holland, Amsterdam, 1999).
- Wallace (1998) D. C. Wallace, Thermodynamics of Crystals (Dover Publications, New York, 1998).
- Beckstein et al. (2001) O. Beckstein, J. E. Klepeis, G. L. W. Hart, and O. Pankratov, Phys. Rev. B 63, 134112 (2001).
- Voigt (1928) W. Voigt, Lehrbuch der Kristallphysik (Teubner, Leipzig, 1928).
- Reuss (1929) A. Reuss, Z. Angew. Math. Mech. 9, 49 (1929).
- Hill (1952) R. Hill, Proc. Phys. Soc., London, Sect. A 65, 349 (1952).
- (52) R. Dovesi, V. R. Saunders, C. Roetti, R. Orlando, C. M. Zicovich-Wilson, F. Pascale, B. Civalleri, K. Doll, N. M. Harrison, I. J. Bush, P. D’Arco, and M. Llunell, CRYSTAL09 User’s Manual (University of Torino, Torino, 2009).
- Schlegel (1984) H. B. Schlegel, Theoret. Chim. Acta 66, 333 (1984).
- Wittbrodt and Schlegel (1997) J. M. Wittbrodt and H. B. Schlegel, J. Mol. Struc.: THEOCHEM 398-399, 55 (1997).
- Johnson (1988) D. D. Johnson, Phys. Rev. B 38, 12807 (1988).
- Anderson (1965) D. G. Anderson, J. Assoc. Comput. Mach. 12, 547 (1965).
- Hay and Wadt (1985) P. J. Hay and W. R. Wadt, J. Chem. Phys. 82, 299 (1985).
- Piskunov et al. (2004) S. Piskunov, E. Heifets, R. Eglitis, and G. Borstel, Comput. Mater. Sci. 29, 165 (2004).
- Couty and Hall (1996) M. Couty and M. B. Hall, J. Comput. Chem. 17, 1359 (1996).
- (60) https://bse.pnl.gov/bse/portal.
- Valenzano et al. (2006) L. Valenzano, F. J. Torres, D. Klaus, F. Pascale, C. M. Zicovich-Wilson, and R. Dovesi, Z. Phys. Chem. 220, 893 (2006).
- (62) http://www.crystal.unito.it/Basis_Sets/Ptable.html.
- Hao et al. (2012) P. Hao, Y. Fang, J. Sun, G. I. Csonka, P. H. T. Philipsen, and J. P. Perdew, Phys. Rev. B 85, 014111 (2012).
- Alchagirov et al. (2001) A. B. Alchagirov, J. P. Perdew, J. C. Boettger, R. C. Albers, and C. Fiolhais, Phys. Rev. B 63, 224115 (2001).
- com (a) Pressure is an important parameter in the Gibbs free energy, since it can compensate for the mechanical instability at zero temperature. The minimization of the Gibbs free energy in turn determines the lattice structure of a crystalline material in thermal equilibrium at ambient conditions.
- Vailionis et al. (2008) A. Vailionis, W. Siemons, and G. Koster, Appl. Phys. Lett. 93, 051909 (2008).
- Chang et al. (2011) S. H. Chang, Y. J. Chang, S. Y. Jang, D. W. Jeong, C. U. Jung, Y.-J. Kim, J.-S. Chung, and T. W. Noh, Phys. Rev. B 84, 104101 (2011).
- Wang et al. (2003) L. G. Wang, M. Šob, and Z. Zhang, J. Phys. Chem. Solids 64, 863 (2003).
- Perger et al. (2009) W. F. Perger, J. Criswell, B. Civalleri, and R. Dovesi, Comput. Phys. Commun. 180, 1753 (2009).
- Pugh (1954) S. F. Pugh, Philos. Mag. 45, 823 (1954).
- Frantsevich et al. (1982) I. N. Frantsevich, F. F. Voronov, and S. A. Bokuta, Elastic Constants and Elastic Moduli of Metals and Insulators (Naukova Dumka, Kiev, 1982).
- Chung and Buessem (1967) D. H. Chung and W. R. Buessem, J. Appl. Phys. 38, 2010 (1967).
- Ranganathan and Ostoja-Starzewski (2008) S. I. Ranganathan and M. Ostoja-Starzewski, Phys. Rev. Lett. 101, 055504 (2008).
- Staroverov et al. (2004) V. N. Staroverov, G. E. Scuseria, J. Tao, and J. P. Perdew, Phys. Rev. B 69, 075102 (2004).
- Rondinelli and Spaldin (2011) J. M. Rondinelli and N. A. Spaldin, Adv. Mater. 23, 3363 (2011).
- com (b) According to Glazer notation in which the rotation system is written as where the Latin letters specify the corresponding rotation angles around , , and axes, while the superscripts indicate whether adjacent octahedra along a given axis rotate in-phase (+), out-of-phase (-), or not at all (0).
- Toyota et al. (2005) D. Toyota, I. Ohkubo, H. Kumigashira, M. Oshima, T. Ohnishi, M. Lippmaa, M. Takizawa, A. Fujimori, K. Ono, M. Kawasaki, and H. Koinuma, Appl. Phys. Lett. 87, 162508 (2005).
- Rondinelli and Coh (2011) J. M. Rondinelli and S. Coh, Phys. Rev. Lett. 106, 235502 (2011).
- May et al. (2010) S. J. May, J.-W. Kim, J. M. Rondinelli, E. Karapetrova, N. A. Spaldin, A. Bhattacharya, and P. J. Ryan, Phys. Rev. B 82, 014110 (2010).
- Zeches et al. (2009) R. J. Zeches, M. D. Rossell, J. X. Zhang, A. J. Hatt, Q. He, C. H. Yang, A. Kumar, C. H. Wang, A. Melville, C. Adamo, G. Sheng, Y. H. Chu, J. F. Ihlefeld, R. Erni, C. Ederer, V. Gopalan, L. Q. Chen, D. G. Schlom, N. A. Spaldin, L. W. Martin, and R. Ramesh, Science 326, 977 (2009).
- Hatt et al. (2010) A. J. Hatt, N. A. Spaldin, and C. Ederer, Phys. Rev. B 81, 054109 (2010).
- Stokes and Hatch (2005) H. T. Stokes and D. M. Hatch, J. Appl. Cryst. 38, 237 (2005).
- Kokalj (2003) A. Kokalj, Comp. Mater. Sci. 28, 155 (2003).