Decoherence in a Pair of Long-Lived Cooper-Pair Boxes
Abstract
We have investigated the decoherence of quantum states in two Cooper-pair boxes coupled to lumped element superconducting LC resonators. At , the first qubit had an energy relaxation time that varied from to between and and displayed an inverse correlation between and the coupling to the microwave drive line. The Ramsey fringe decay times were in the range while the spin echo envelope decay times varied from , consistent with charge noise with a high frequency cutoff of . A second Cooper-pair box qubit with similar parameters showed between , and that the and the coupling were again inversely correlated. Although the lifetime of the second device was shorter than that of the first device, the dependence on coupling in both devices suggests that further reduction in coupling should lead to improved qubit performance.
pacs:
03.67.Lx, 03.65.Yz, 42.50.Pq, 85.25.CpIntroduction
There has been great progress in increasing the relaxation times of superconducting qubits over the last decade. Many devices have been reported with relaxation times in the range and more recently devices have started to appear with relaxation times of or greater.Houck et al. (2008); Bertet et al. (2005); Manucharyan et al. (2012); Paik et al. (2011) Qubit relaxation has been attributed to a variety of different physical mechanisms including dielectric loss,Martinis et al. (2005) coupling to discrete two level fluctuators,Kim et al. (2008); Simmonds et al. (2004) excess non-equilibrium quasiparticles,Martinis, Ansmann, and Aumentado (2009); Lenander et al. (2011); Catelani et al. (2011) and coupling to lossy electromagnetic modes.Houck et al. (2008) Recent work that addresses some of these underlying causes of energy loss include the use of absorbers and shielding to block infrared radiation responsible for non-equilibrium quasiparticles,Barends et al. (2011); Córcoles et al. (2011) decoupling the qubit from the environment,Kim et al. (2011) and placing the qubit in a 3D resonator to both decouple it and reduce the contribution of lossy materials.Paik et al. (2011)
We recently reported on a Cooper-pair box (CPB) qubit with an excited state lifetime , about one order of magnitude larger than typically reported.Kim et al. (2011) This device showed a correlation between the relaxation time and the magnitude of the decoupling between the device and the microwave drive line. Here we address some key questions that naturally follow from these results. First, although the excited state lifetime provides a measure of the high frequency noise affecting the qubit,Schoelkopf et al. (2002) what is the character of the low frequency noise that is responsible for dephasing?Ithier et al. (2005); Martinis et al. (2003) Moreover, is there any correspondence between the low frequency and high frequency noise? Second, given the significant improvement in lifetime, how reproducible are these results? We address the first issue by measuring Ramsey fringes, Rabi oscillations, and a spin echo experiment. To understand the reproducibility of these results, we fabricated a second qubit based on the original design and measured its lifetime and coupling.
Theoretical Description
A Cooper-pair boxBouchiat et al. (1998) consists of a small superconducting island connected to a superconducting reservoir (ground) through two ultrasmall Josephson tunnel junctions with total critical current and total junction capacitance [see Fig. 1]. A gate electrode with capacitance to the island allows us to apply a bias voltage and control the system’s electrostatic energy, while an external flux though the superconducting loop can be used to adjust the critical current . The island has a total capacitance to ground of which sets the charging energy . and the Josephson energy form two competing energy scales that determine the optimal quantization basis, the sensitivity to various types of noise and the operating parameters. In the limit , the CPB Hamiltonian yields highly anharmonic energy levels. For our purpose, only the two lowest levels need to be considered and we can write
| (1) |
where is the Pauli spin operator,
| (2) |
is the ground to first excited state transition energy, and is the reduced gate voltage.
To read out the state of the qubit, we coupled our qubit to a quasi-lumped element inductor-capacitor (LC) resonator that was in turn coupled to a transmission line [see Fig. 2(a)]. We probed the LC resonance frequency by applying microwave power and recording the transmitted microwave signal. This is a dispersive readout in which the qubit produces a state-dependent reactance that perturbs the resonance frequency of the resonator. For weak qubit-resonator coupling and large detuning between the qubit transition frequency and the resonator resonance frequency , the system Hamiltonian is approximatelyWallraff et al. (2005); Blais et al. (2004)
| (3) |
where
| (4) |
is the qubit-resonator interaction strength, is the coupling capacitance between the resonator and the island of the CPB and is the capacitance of the resonator [see Fig. 1]. Equation 3 implies that the bare resonator frequency is dispersively shifted by depending on the state of the qubit. If , where is the resonator linewidth and is the resonator quality factor, the average phase of the transmitted signal at is linearly dependent on the excited state occupation probability. On the other hand if , then when on-resonance microwave power is applied, the average in-phase or quadrature transmitted voltage is proportional to the excited state occupation probability.Gambetta et al. (2007)
Qubit decoherence is caused by relaxation and dephasing. The relaxation rate can be found using Fermi’s golden rule and depends on the spectral density of noise at the transition frequency and the transition matrix element.Schoelkopf et al. (2002); Astafiev et al. (2004) Sources of noise may be external, such as thermal or instrumentation noise propagating down imperfectly filtered control lines, or local to the qubit, such as nearby lossy materials. If multiple uncorrelated noise channels are present then the total relaxation rate is given by the sum of the individual decay rates.
For the Cooper-pair box, a key factor that governs the relaxation time is the sensitivity to voltage or charge perturbations. At the CPB sweet spot (), small changes in the gate voltage produce a relaxation rate via a matrix element:
| (5) |
where and are the ground state and excited state of the CPB, respectively.
In contrast, dephasing is caused by adiabatic changes in the transition frequency between and and depends on low frequency noise components, the sensitivity of the transition frequency to external parameters, and the how the qubit state is manipulated.Ithier et al. (2005); Martinis et al. (2003) The first order sensitivity of the CPB to transition frequency to low frequency charge noise is
| (6) |
which vanishes at the sweet spot. The second order sensitivity at the sweet spot is
| (7) |
Voltage and charge fluctuations are the dominant types of noise affecting our qubit and we focus our discussion there. Other noise types of noise, such as flux noise,Wellstood, Urbina, and Clarke (1987) should also be present but their effect should be much smaller than charge noise for our design. Assuming typical values of flux noise, charge noise should dominate even at second order.Ithier et al. (2005); Schuster (2007)
Experimental Details
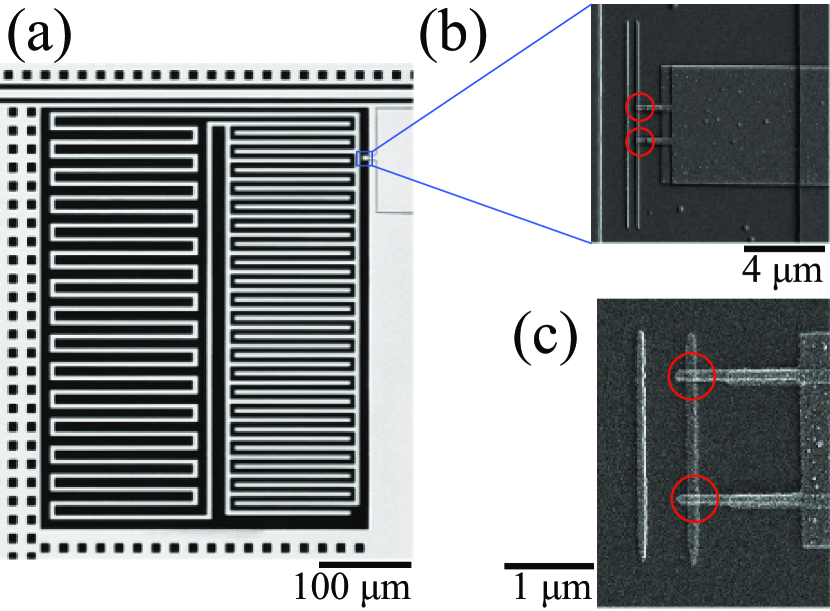
We fabricated high quality factor superconducting resonators using standard photolithography and lift-off techniques. Each resonator was made from thick films of thermally evaporated Al on a c-plane sapphire wafer. The lumped element resonators consisted of a meander inductor and an interdigital capacitor coupled to a coplanar waveguide transmission line [see Fig. 2(a)]. The resonance frequency of the first deviceKim et al. (2011) was with a loaded quality factor , external quality factor and internal quality factor at low power. The second device had a very similar layout and a nearly identical resonance frequency of , but the loaded quality factor was , the external quality factor was and the internal quality factor was . Device 2 was designed with a lower external quality factor than that of device 1 to increase the bandwidth available during readout. The discrepancy in the internal quality factors between the two devices was likely due to variation in the fabrication, for example in the quality and thickness of the native Al oxide, the roughness of the surface of the Al, or the quality of the interface between the evaporated Al and the sapphire wafer.
| Device 1 | Device 2 | |||
| — | ||||
The CPB was subsequently defined by e-beam lithography. We used a bilayer stack of MMA(8.5)MAA copolymer and ZEP520A e-beam resist to facilitate lift-off and reduce proximity exposure during writing. Al films were deposited using double-angle evaporation with an intermediate thermal oxidation step to create the Josephson tunnel junctions;Dolan (1977) thick Al island and thick Al leads were deposited in an e-beam evaporator [see Fig. 2(b, c)]. We set the charging energy and Josephson energy by choosing the lithographically defined junction size and the oxygen exposure. Device 1 had and and was tuned with an external magnetic field to the range. Device 2 was designed with a smaller to reduce sensitivity to charge noise [see Eq. (7)] and a smaller to enable operation at the double sweet spot ( and no external flux bias) if desired. It had , , and could be tuned as low as . Table 1 summarizes the parameters of the two devices and their resonators.
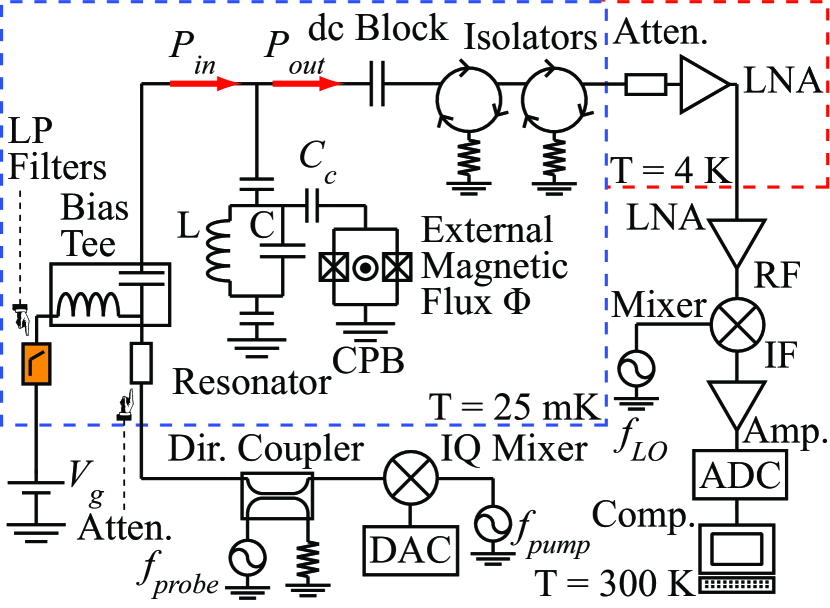
Each sample was mounted in a rf-tight Cu box with Al wire bond connections to the chip. The sample box was anchored to the mixing chamber of an Oxford Instruments 100 dilution refrigerator with a base temperature of . We used cold attenuators on the input line at (), () and () and two isolators on the output line at to filter thermal noise from higher temperatures. A filtered dc bias line for applying the gate voltage was coupled to the input line using a bias tee before the device and a dc block was placed after the sample box [see Fig. 1]. The output microwave signal was amplified with a HEMT amplifierwei sitting in the He bath.
Spectroscopic and lifetime measurements were performed by continuously monitoring the transmitted amplitude and phase at the resonator’s resonance frequency using a weak microwave drive. For qubit spectroscopy, the gate voltage was swept adiabatically while a second continuous microwave tone was stepped in frequency to excite the qubit.
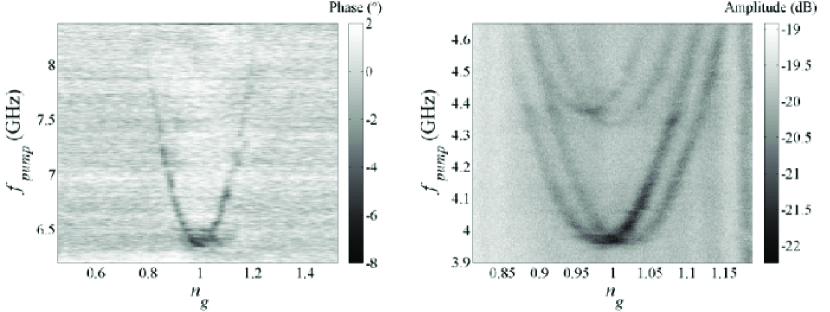
Initial characterization of device 1 has been reported by Kim, et al.Kim et al. (2011) Figure 3(a) shows a grayscale plot of the typical transmitted signal phase as functions of and pump frequency . The data closely resembled a parabola and allowed us to extract and by fitting to Eq. 2.
To avoid dephasing effects due to the back-action of the probe photonsSchuster et al. (2005); Blais et al. (2004); Wallraff et al. (2005) for Rabi oscillation, Ramsey fringes, and spin echo measurements, we probed the resonator at only after the completion of any qubit pulse sequence. Qubit measurements were repeated every , a delay equal to at least several lifetimes to allow the qubit to relax to the ground state, and averaged times. We used a coherent heterodyne setup to record the phase and amplitude of the transmitted signal at time bins. Specifically, the signal from the HEMT was amplified at room temperature, mixed with a local oscillator tone to an intermediate frequency of and then digitally sampled at a typical sampling rate of . A second reference tone was split off from the probe signal source and similarly mixed and digitally sampled. Both signals were then passed through a second stage of software demodulation. Manipulation of the qubit state was performed with a separate pulse shaping system consisting of a two-channel DAC boardmar that supplied control voltages to a IQ mixer [see Fig. 1]. This allowed us to produce microwave pulses at frequency with a Gaussian rise time and arbitrary envelope and phase to perform the necessary qubit manipulations. All components were locked to a Rb atomic clock.srs
Lifetime and Dephasing Studies of Device 1
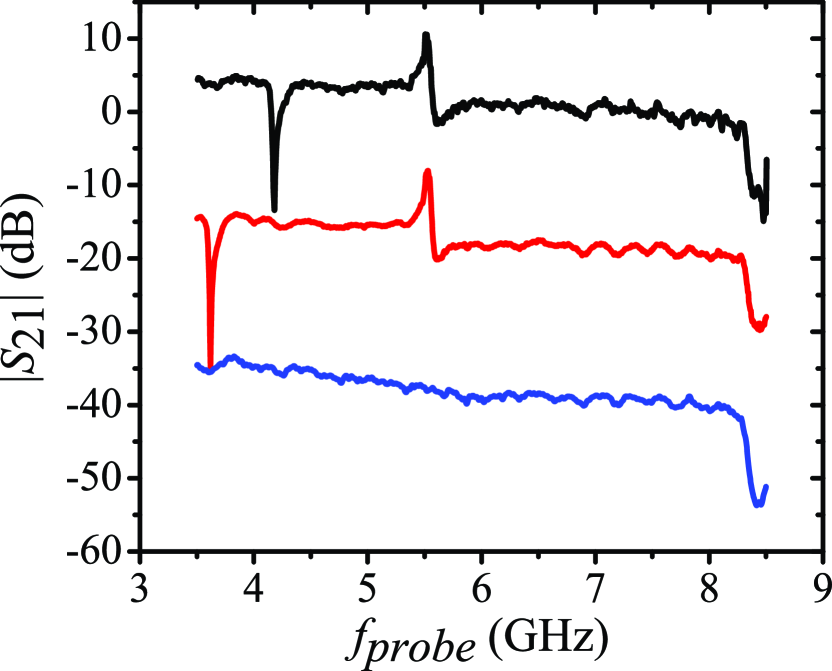
After the spectroscopy shown in Fig. 3(a) was taken, the experimental setup was modified by changing the grounds in the coplanar waveguide launchers that connect the chip to the microwave lines. This change moved a spurious resonance due to device packaging from down to [see Fig. 4]. The lifetime and Rabi coupling at was remeasured after tuning , the frequency where the lifetime was longest and coupling smallest in the previous cooldown.Kim et al. (2011) The coupling between the qubit and the microwave line increased from before the change to after and there was a corresponding decrease in the lifetime from to . Assuming that this relaxation is due to charge noise, the power spectral density of charge noise and the lifetime are related byAstafiev et al. (2004); Schoelkopf et al. (2002)
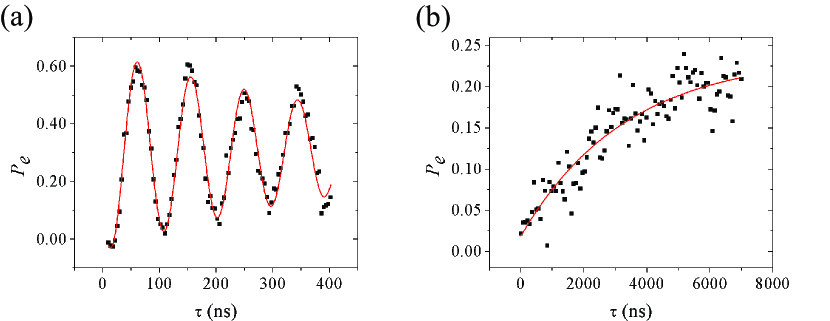
We also measured the dephasing of device 1 during free evolution by performing Ramsey fringe experiments and during driven evolution by performing Rabi oscillations. From driving Rabi oscillations at we obtained a Rabi decay time and calibrated the drive duration to produce a pulse in . For Ramsey oscillations, we then applied two phase coherent pulses separated by a delay and at frequency , i.e. detuned by from the qubit transition. The excited state probability after the second pulse displayed decaying oscillations of frequency and the envelope of the oscillations yields the Ramsey decay time . The decay time is sensitive to both homogeneous and inhomogeneous broadening. Our observed were in the range [see Fig. 5(a)]. Assuming charge noise with a spectrum is the dominant noise source, from Eq. (7) and the dependence of Ramsey fringes decay time on noise,Ithier et al. (2005); Martinis et al. (2003) we extract a bound on the noise amplitude of . This value is similar to that reported for other charge qubitsWallraff et al. (2005); Siddiqi et al. (2006); Vion et al. (2002); Metcalfe et al. (2007) and is about an order of magnitude larger than low frequency charge noise observed in single-electron transistors.Kenyon, Lobb, and Wellstood (2000); Zimmerli et al. (1992) If we extrapolate this noise to the result is . This is three orders of magnitude larger than that extracted from the dataKim et al. (2011) on device 1, suggesting that the charge noise spectrum cannot be scaling as into the GHz range.
We further characterized the noise affecting the qubit with a spin echo experiment. For this measurement, the following pulse sequence was used: apply pulse, wait time , apply an out of phase pulse, wait time , apply a second in-phase pulse, and finally measure the excited state probability. The intervening pulse serves to refocus the phase and greatly reduces the impact of low frequency noise. The excited state probability decayed exponentially with time constant in the range [see Fig. 5(b)]. We note that one expects for wideband noise.Ithier et al. (2005); Martinis et al. (2003) Our observed ratio of is greater than this and consistent with a soft cutoff, such as a transition to falloff, of the noise at . A similar cutoff was reported by Ithier et al.Ithier et al. (2005) at a frequency of .
Lifetime and Decoupling of Device 2
To better understand the reproducibility of our results, we fabricated a second device with nominally the same layout and characterized it using similar methodology. We placed device 2 in a different Cu sample box and installed a new HEMT amplifier, in the process removing both the box resonance and the self-resonance of the amplifier at [see Fig. 4].
Table 1 summarizes the parameters of device 2 while Fig. 3(b) shows a plot of the transition spectrum. A striking difference between the two samples was immediately evident. For device 2 we observed 4 parabolas with varying curvatures and transition frequencies. This overall structure was stable over the course of four months that the sample was cold and persisted as we tuned the transition frequency from . We believe the observed spectrum is a signature of the CPB coherently coupling to two defects that modulate the charge and critical current.Zaretskey et al. (2013) Particularly notable are the combined curvature and transition frequency offsets. Previous work has found that qubit-defect interactions can significantly degrade performanceKim et al. (2008); Sillanpaa, Park, and Simmonds (2007); Simmonds et al. (2004); Oh et al. (2006); Kline et al. (2009) or, in our experience, make the qubit inoperable.Schuster (2007); Kim (2010) However this was not the case for device 2, as we were able to measure reasonable excited state lifetimes and record Rabi oscillations for transitions to any of the parabolas. From fits to the spectra we extracted .Zaretskey et al. (2013)
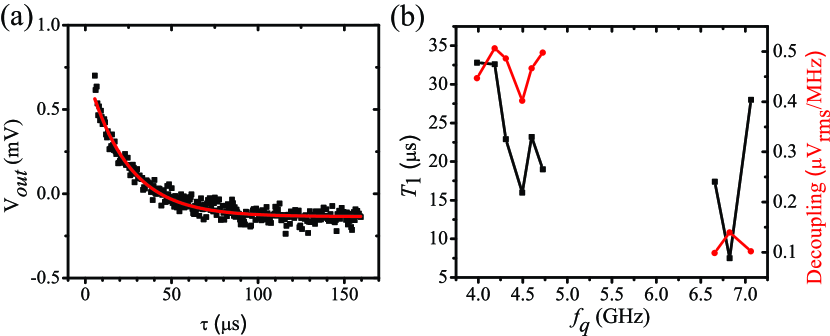
We measured the excited state lifetime by biasing the qubit at nominally (at a minimum of one of the parabolas), applying a microwave tone at to saturate the qubit, turning on the probe tone, and then recording the transmitted signal. Figure 6(a) shows a typical in-phase voltage trace and a fit to an exponential decay. While we were able to operate the sample at any of the spectral parabolas, one of the parabolas had the best measurement contrast. When was turned below this was the lowest lying parabola (see parabola #1 in Fig. 3(b)) while for it was the third highest (see parabola #3 in Fig. 3(b)).
In addition to measuring the lifetime, we also measured Rabi oscillations and found where is the frequency of Rabi oscillations at the microwave drive rms amplitude . This quantity is a measure of the decoupling between the qubit and the microwave drive. Rabi oscillations at various powers were recorded by pulsing a microwave pump tone at for a fixed duration, turning on the probe tone at , and recording the transmitted signal at during a window.Blais et al. (2004); Gambetta et al. (2007) Typically such measurements were averaged at each pulse duration and the process was repeated for a range of pump pulse durations.
Figure 6(b) shows a plot of the lifetime and decoupling versus the CPB transition frequency for both devices. For device 2 there is a gap in the data between where reduced visibility in all the parabolas prohibited data acquisition.Zaretskey et al. (2013) This loss of visibility was possibly due to a charged fluctuator that was activated in this frequency range.
Comparison
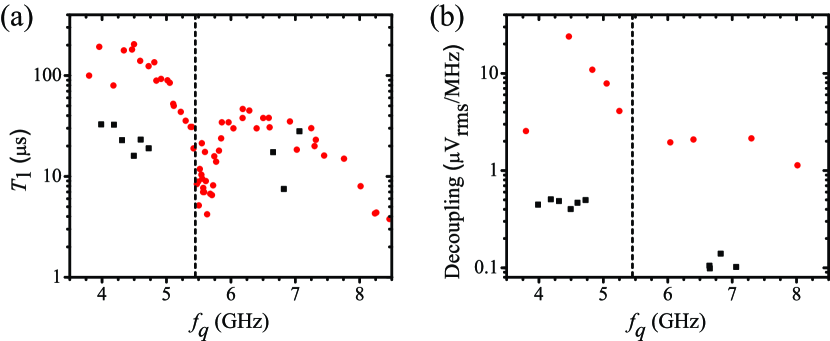
The qualitative behavior of in device 2 was similar to that observed for device 1 [see Fig. 7]. With the qubit transition frequency biased below the resonator , the lifetime of device 2 was in the range while in device 1 was . In both devices there is a drop in for . For device 2, the decoupling was generally correlated with and, in particular, both and drop for . Above , the lifetimes for device 1 and device 2 are nearly identical while below the device 2 lifetimes are about a factor of 5 shorter than those of device 1 [see Fig. 7(a)]. The decoupling follows a similar qualitative trend [see Fig. 7(b)]. We note that while the of device 2 is not as long as that of device 1, it is still relatively long-lived for a superconducting qubit and comparable to some 3D qubits.Paik et al. (2011)
Some of the performance differences between the two samples can be understood from small differences in the design and fabrication. Specifically the larger Rabi coupling in device 2 may be due to the fact that its resonator was more strongly coupled to the transmission line. This is consistent with the smaller in device 2. Additionally, as seen from Eq. 5, the decoupling scales as . Although device 2 had a somewhat smaller [see Table 1], the CPB island was approximately four times longer and hence was correspondingly increased ( versus ). While the decoupling only addresses the decay channel due to the transmission line, relaxation due to an interaction with discrete charged defects may also be playing a role. Device 1 had no prominent splittings in the transition spectrum while device 2 had visible splittings and an anomalous multi-parabola spectrum [see Fig. 3(b)]. The larger area of the tunnel junctions of device 2 should have led on average to about twice as many defects, which highlights the pitfalls of trying to improve a CPB by using larger area junctions.
It is interesting to compare the spectral density of charge noise at both low and high frequencies in the two devices. Assuming relaxation due to charge noise dominates other decay channels, the spectral density of charge noise and the lifetime are related by Eq. 8. Using at for device 2 this places a bound on the noise of . This is an order of magnitude larger than found at for device 1 but is similar to other values reported in the literature.Vion et al. (2002) The spectroscopic coherence time of device 2, as determined from low pump power spectral linewidth measurements, was at most . This places a low frequency charge noise bound of for device 2. This is an order of magnitude larger than the found for device 1 from Ramsey measurements. Measurements of the decay time of Rabi oscillations showed similar behavior: for device 1 and for device 2. These differences in charge noise may simply be due to sample-to-sample statistical variations in the number of TLS’s active at low and high frequencies, and would be expected when few TLS’s are present on average.
Conclusion
In summary we measured the spectrum, lifetime, Rabi oscillations, Ramsey fringes, and spin echoes in two CPB charge qubits. The Ramsey fringe decay times for device 1 were in the range while the spin echo envelope decay times were in the range. The low frequency noise power spectral density was bounded by , a value which is consistent with other reports on charge qubits.Wallraff et al. (2005); Siddiqi et al. (2006); Vion et al. (2002); Metcalfe et al. (2007) We also determined that the noise in device 1 is consistent with a soft cutoff at and this is in turn consistent with the exceptionally low bound on the high frequency noise extracted from data. A second qubit based on the same design also showed correlated to the decoupling in the transition frequency range . The behavior was qualitatively similar to that in device 1. The maximum lifetime of device 2 was not as long as the longest in device 1, but the coupling between the qubit and the transmission line was times stronger in device 2, suggesting some level of reproducibility.
Acknowledgements.
F. C. W. would like to acknowledge many useful discussions with K. D. Osborn and C. J. Lobb and support from the Joint Quantum Institute and the State of Maryland through the Center for Nanophysics and Advanced Materials. V. Z. would like to thank M. Khalil, P. Nagornykh and N. Siwak for many useful discussions.References
- Houck et al. (2008) A. A. Houck, J. A. Schreier, B. R. Johnson, J. M. Chow, J. Koch, J. M. Gambetta, D. I. Schuster, L. Frunzio, M. H. Devoret, S. M. Girvin, and R. J. Schoelkopf, Phys. Rev. Lett. 101, 080502 (2008).
- Bertet et al. (2005) P. Bertet, I. Chiorescu, G. Burkard, K. Semba, C. J. P. M. Harmans, D. P. DiVincenzo, and J. E. Mooij, Phys. Rev. Lett. 95, 257002 (2005).
- Manucharyan et al. (2012) V. E. Manucharyan, N. A. Masluk, A. Kamal, J. Koch, L. I. Glazman, and M. H. Devoret, Phys. Rev. B 85, 024521 (2012).
- Paik et al. (2011) H. Paik, D. I. Schuster, L. S. Bishop, G. Kirchmair, G. Catelani, A. P. Sears, B. R. Johnson, M. J. Reagor, L. Frunzio, L. I. Glazman, S. M. Girvin, M. H. Devoret, and R. J. Schoelkopf, Phys. Rev. Lett. 107, 240501 (2011).
- Martinis et al. (2005) J. M. Martinis, K. B. Cooper, R. McDermott, M. Steffen, M. Ansmann, K. D. Osborn, K. Cicak, S. Oh, D. P. Pappas, R. W. Simmonds, and C. C. Yu, Phys. Rev. Lett. 95, 210503 (2005).
- Kim et al. (2008) Z. Kim, V. Zaretskey, Y. Yoon, J. F. Schneiderman, M. D. Shaw, P. M. Echternach, F. C. Wellstood, and B. S. Palmer, Phys. Rev. B 78, 144506 (2008).
- Simmonds et al. (2004) R. W. Simmonds, K. M. Lang, D. A. Hite, S. Nam, D. P. Pappas, and J. M. Martinis, Phys. Rev. Lett. 93, 077003 (2004).
- Martinis, Ansmann, and Aumentado (2009) J. M. Martinis, M. Ansmann, and J. Aumentado, Phys. Rev. Lett. 103, 097002 (2009).
- Lenander et al. (2011) M. Lenander, H. Wang, R. C. Bialczak, E. Lucero, M. Mariantoni, M. Neeley, A. D. O’Connell, D. Sank, M. Weides, J. Wenner, T. Yamamoto, Y. Yin, J. Zhao, A. N. Cleland, and J. M. Martinis, Phys. Rev. B 84, 024501 (2011).
- Catelani et al. (2011) G. Catelani, J. Koch, L. Frunzio, R. J. Schoelkopf, M. H. Devoret, and L. I. Glazman, Phys. Rev. Lett. 106, 077002 (2011).
- Barends et al. (2011) R. Barends, J. Wenner, M. Lenander, Y. Chen, R. C. Bialczak, J. Kelly, E. Lucero, P. O’Malley, M. Mariantoni, D. Sank, H. Wang, T. C. White, Y. Yin, J. Zhao, A. N. Cleland, J. M. Martinis, and J. J. A. Baselmans, Appl. Phys. Lett. 99, 113507 (2011).
- Córcoles et al. (2011) A. D. Córcoles, J. M. Chow, J. M. Gambetta, C. Rigetti, J. R. Rozen, G. A. Keefe, M. Beth Rothwell, M. B. Ketchen, and M. Steffen, Appl. Phys. Lett. 99, 181906 (2011).
- Kim et al. (2011) Z. Kim, B. Suri, V. Zaretskey, S. Novikov, K. D. Osborn, A. Mizel, F. C. Wellstood, and B. S. Palmer, Phys. Rev. Lett. 106, 120501 (2011).
- Schoelkopf et al. (2002) R. J. Schoelkopf, A. A. Clerk, S. M. Girvin, K. W. Lehnert, and M. H. Devoret, arXiv:cond-mat/0210247 (2002).
- Ithier et al. (2005) G. Ithier, E. Collin, P. Joyez, P. J. Meeson, D. Vion, D. Esteve, F. Chiarello, A. Shnirman, Y. Makhlin, J. Schriefl, and G. Schön, Phys. Rev. B 72, 134519 (2005).
- Martinis et al. (2003) J. M. Martinis, S. Nam, J. Aumentado, K. M. Lang, and C. Urbina, Phys. Rev. B 67, 094510 (2003).
- Bouchiat et al. (1998) V. Bouchiat, D. Vion, P. Joyez, D. Esteve, and M. H. Devoret, Phys. Scr., T 76, 165 (1998).
- Wallraff et al. (2005) A. Wallraff, D. I. Schuster, A. Blais, L. Frunzio, J. Majer, M. H. Devoret, S. M. Girvin, and R. J. Schoelkopf, Phys. Rev. Lett. 95, 060501 (2005).
- Blais et al. (2004) A. Blais, R.-S. Huang, A. Wallraff, S. M. Girvin, and R. J. Schoelkopf, Phys. Rev. A 69, 062320 (2004).
- Gambetta et al. (2007) J. Gambetta, W. A. Braff, A. Wallraff, S. M. Girvin, and R. J. Schoelkopf, Phys. Rev. A 76, 012325 (2007).
- Astafiev et al. (2004) O. Astafiev, Y. A. Pashkin, Y. Nakamura, T. Yamamoto, and J. S. Tsai, Phys. Rev. Lett. 93, 267007 (2004).
- Wellstood, Urbina, and Clarke (1987) F. C. Wellstood, C. Urbina, and J. Clarke, Appl. Phys. Lett. 50, 772 (1987).
- Dolan (1977) G. J. Dolan, Appl. Phys. Lett. 31, 337 (1977).
- (24) Weinreb (Caltech) Radiometer Group Low-Noise Amplifier. http://radiometer.caltech.edu/.
- Schuster et al. (2005) D. I. Schuster, A. Wallraff, A. Blais, L. Frunzio, R.-S. Huang, J. Majer, S. M. Girvin, and R. J. Schoelkopf, Phys. Rev. Lett. 94, 123602 (2005).
- (26) Martinis (UCSB) Quantum Computing Group Electronics. http://web.physics.ucsb.edu/ martinisgroup/electronics.shtml.
- (27) Stanford Research Systems (SRS) model FS725 Rubidium Frequency Standard. http://www.thinksrs.com/.
- Siddiqi et al. (2006) I. Siddiqi, R. Vijay, M. Metcalfe, E. Boaknin, L. Frunzio, R. J. Schoelkopf, and M. H. Devoret, Phys. Rev. B 73, 054510 (2006).
- Vion et al. (2002) D. Vion, A. Aassime, A. Cottet, P. Joyez, H. Pothier, C. Urbina, D. Esteve, and M. H. Devoret, Science 296, 886 (2002).
- Metcalfe et al. (2007) M. Metcalfe, E. Boaknin, V. Manucharyan, R. Vijay, I. Siddiqi, C. Rigetti, L. Frunzio, R. J. Schoelkopf, and M. H. Devoret, Phys. Rev. B 76, 174516 (2007).
- Kenyon, Lobb, and Wellstood (2000) M. Kenyon, C. J. Lobb, and F. C. Wellstood, J. Appl. Phys. 88, 6536 (2000).
- Zimmerli et al. (1992) G. Zimmerli, T. M. Eiles, R. L. Kautz, and J. M. Martinis, Appl. Phys. Lett. 61, 237 (1992).
- Zaretskey et al. (2013) V. Zaretskey, B. Suri, S. Novikov, F. C. Wellstood, and B. S. Palmer, Phys. Rev. B 87, 174522 (2013).
- Sillanpaa, Park, and Simmonds (2007) M. A. Sillanpaa, J. I. Park, and R. W. Simmonds, Nature 449, 438 (2007).
- Oh et al. (2006) S. Oh, K. Cicak, J. S. Kline, M. A. Sillanpää, K. D. Osborn, J. D. Whittaker, R. W. Simmonds, and D. P. Pappas, Phys. Rev. B 74, 100502 (2006).
- Kline et al. (2009) J. S. Kline, H. Wang, S. Oh, J. M. Martinis, and D. P. Pappas, Supercond. Sci. Techn. 22, 015004 (2009).
- Schuster (2007) D. I. Schuster, Circuit Quantum Electrodynamics, Doctoral dissertation, Yale University (2007).
- Kim (2010) Z. Kim, Dissipative and Dispersive Measurements of a Cooper Pair Box, Doctoral dissertation, University of Maryland, College Park (2010).