Cooperation in changing environments:
Irreversibility in the transition to cooperation in complex networks
Abstract
In the framework of the evolutionary dynamics of the Prisoner’s Dilemma game on complex networks, we investigate the possibility that the average level of cooperation shows hysteresis under quasi-static variations of a model parameter (the “temptation to defect”). Under the “discrete replicator” strategy updating rule, for both Erdös-Rényi and Barabási-Albert graphs we observe cooperation hysteresis cycles provided one reaches tipping point values of the parameter; otherwise, perfect reversibility is obtained. The selective fixation of cooperation at certain nodes and its organization in cooperator clusters, that are surrounded by fluctuating strategists, allows the rationalization of the “lagging behind” behavior observed.
I Introduction
Evolutionary game theory nowakbook provides with an elegant mathematical description of how Darwinian natural selection among strategies (representing phenotypes) takes place when the reproductive success of individuals (and thus the future abundance of phenotypes) depends on the current strategic composition of the population (frequency-dependent fitness) hofbauer ; gintis ; hofbauerbull . One of the most studied challenges to the explanatory power of evolutionary game dynamics is the understanding of the evolutionary survival of cooperative behavior among unrelated individuals that is observed even when selfish actions provide higher short-term benefits.
Perhaps the best suited mathematical model to describe the puzzle of how cooperation survives is the Prisoner’s Dilemma (PD) game. This game, originally introduced by M.M. Flood and G.J. Savage rand , is a two-players-two-strategies game, in which each player chooses one of the two available strategies: cooperation (C) or defection (D). A cooperator earns (reward) when playing with a cooperator, and a payoff (sucker’s payoff) when playing with a defector, while a defector earns (punishment) when playing with a defector, and (temptation to defect) against a cooperator. When the ordering of the payoffs is , the game is strictly speaking a PD. When the situation is called Snowdrift Game (SG), also known as Hawks-and-Doves or Chicken maynard . In this work we focus on a variant of the PD game called weak Prisoner’s Dilemma, placed in its boundary with respect to SG, that is . In a PD (including weak variant), whatever the opponent’s strategy is, the payoff is never higher for cooperation, and a rational agent should choose defection. Still, two cooperator agents receive higher payoff () than two defector ones (), which leads to social dilemma.
On the other hand, recent discoveries on the interaction architecture of biological, technological and social systems have shown that this structure has important consequences for their dynamical behavior and their associated critical phenomena rev:albert ; rev:newman . In particular, the dynamical features observed for heterogeneous, scale-free (SF) networks are often different from those for homogeneous networks rev:bocc ; rev:doro . This difference is rooted in the presence of highly connected nodes. Motivated by the aforementioned results, studies of evolutionary game theory models on heterogeneous networks have attracted a great attention in the last few years rev:szabo ; rev:roca ; rev:jrsi . In particular, issues concerning the role that social structure plays in the success of cooperative behavior have been extensively studied in the context of the PD game pacheco1 ; pacheco2 ; pacheco3 ; pacheco4 ; campillo ; poncela ; jtb ; SzolnokiPhA2008 ; floria . The results obtained indicate that the heterogeneous connectivity patterns characteristic of SF networks might support cooperation, although it has been recently reported that when humans play a PD game, networks do not play a role pnas . The promotion of cooperation when the payoff differences determine the evolution of strategies is understood by the presence of highly connected nodes (the hubs) whose large number of connections provides them with high benefits and then a high imitation power. Thus, when playing as cooperators neighboring agents easily imitate their cooperative strategy. This imitation reinforces the benefits accumulated by the cooperator hubs thus creating a positive feedback mechanism that enhances the cooperation across the whole system.
The asymptotic levels of average cooperation on random networks (as function of game’s parameters) were determined to be reasonably robust versus variation of random initial conditions with different initial proportion of cooperators poncela . Though this might seem to suggest that, under slow (compared to evolutionary scales) parameter variation, the cooperation levels reached on a network are independent of the particular history of parameters’ change, it is unclear that it should be so, because of the likelihood of multiplicity of microscopic asymptotic states, given the disordered nature of the social contacts structure, that could produce hysteresis-like behaviors. We address here the question about the possibility of hysteresis of the cooperation on complex network under quasi-static variation of game’s parameters.
II The model
Provided the relative selective advantage among two individuals depends on their payoff’s difference (see below), we can normalize without loss of generality the pay-off matrix taking and fix the punishment . We will also consider here that the sucker’s payoff is , namely, the weak prisoner’s dilemma, so that both strategies perform equally against a defector. Then only one parameter, the “temptation to defect”, is a system variable.
In this study we implement the following replication mechanism: At each time step, each agent plays once with each one of its neighbors (i.e. agents connected to ) and accumulates the obtained payoffs, . After that, the individuals, , update synchronously their strategies choosing a neighbor at random, and comparing their respective payoffs and . If , nothing happens and preserves its strategy. Otherwise, if , adopts the strategy of its neighbor with probability . Next, all payoffs are reset to zero. Here, is a positive real number, related to the characteristic inverse time scale: the larger it is, the faster evolution takes place. We consider that players and connections between them are given by a fixed graph where agents are represented by nodes, and a link between nodes indicates that they interact. We choose here the maximum value of that preserves the probabilistic character of , that is, , where is the number of neighbors of agent (connectivity or degree). This choice, introduced in pacheco2 , slows down the invasion processes from or to highly connected nodes (hubs), with respect to the rate of invasion processes between poorly connected nodes.
Our aim is the study of the reversible (or irreversible) character of cooperation level under the variation of the temptation to defect parameter , where is defined as the number of cooperator nodes divided by the total population . In order to study the system’s behavior, we choose an initial value of such that the asymptotic cooperation value is close to a half: . Once the system has reached a stationary state, we decrease in a quasi-static way, that is, in steps small enough to ensure that the system remains very close to equilibrium. Along this process, we compute the stationary value of cooperation for each value of . To avoid getting stuck in the absorbing states we deal with large enough network sizes (), considering that fluctuations decrease according to the square root of the system size. Once the system has almost reached the absorbing state , we reverse the sign of the increase in , i.e. , to almost reach the other absorbing state , and then again decrease to complete the cycle. To study the influence of network topology in the reversibility of the process, we consider three different network models: Random Regular Graphs (RRG), Erdös- Rényi and Scale-free networks, though we will only show here the results for the last two types of graphs. RRG (i.e., random networks with fixed degree , which means that every node has the same number of neighbors) always show complete reversibility. This seems to imply that, although randomness is present in RRG, a non-zero variance in the degree distribution is a necessary condition for the observation of irreversible behavior.
III Erdös-Rényi networks
Erdös-Rényi (ER) networks are random graphs characterized by a binomial degree distribution (or a Poisson distribution for large networks). To study reversibility, we have performed numerical simulations in independent networks of size generated through Erdös-Rényi algorithm. For reduced cycles, that is, when the return points are far from absorbing states (, ) the processes are reversible and the level of cooperation is independent of the sign of the increase in . Nevertheless, when return points are close enough to the absorbing states (), ER networks exhibit irreversibility to a large extent. In fact, once the level of cooperation reaches a tipping point, all processes are irreversible. In particular, there is a strong resilience of cooperation (defection) when increasing (decreasing) the value of . However, the backward and forward transition curves are identical for intermediate values of cooperation. The proximity of the tipping points to the absorbent states in both ends of the cycle turns out to be similar: and, for the networks size used, it takes on the value .
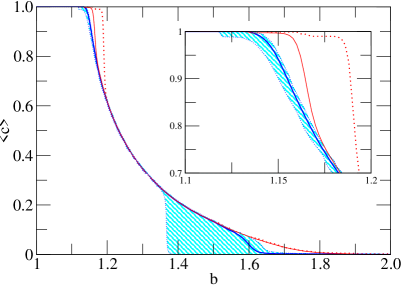
As a result, once the population has reached a cooperation level above (below) a tipping point, the system shows a reticence to retrieve the past level of cooperation when the parameter increases (decreases). This phenomenon is independent of the particular ER network, being observed in all network realizations. Figure 1 shows the level of cooperation versus the temptation to defect , averaged over realizations in distinct ER networks. Different realizations show different -increasing and -decreasing curves, whose envelopes are depicted as dotted lines in Figure 1. Remarkably, the dispersion of the different curves is much larger for the -decreasing direction.
IV Scale-free networks
Scale-free (SF) networks are graphs whose degree distribution follows a power law, that is, . We ran simulations in independent networks of size generated through the Barabási-Albert algorithm. Although most of the SF networks show nearly reversible behavior, around of networks show a strong hysteresis. Nevertheless, irreversibility in SF networks should not be considered as a rare event: Increasing the network size increases the proportion of networks that show irreversible behavior. The explanation for this fact is that the use of larger networks allows to approach closer the absorbing states without getting stuck in them. Based on this argument, we have separated realizations showing a reversible behavior from irreversible ones. In these latter cases, hysteresis shows up only for low values of ; in other words, when cooperation is very small, backward and forward curves are almost identical. Moreover, the behavior of the system in -increasing semi-cycles is always similar, the cooperation level taking approximately the same value in all realizations, regardless of whether they are reversible or irreversible. On the contrary, curves are different for different (irreversible) realizations in -decreasing semi-cycles, and show a substantially larger dispersion than those of ER networks.
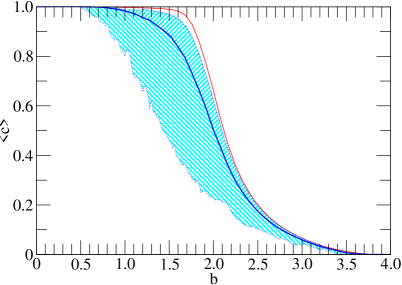
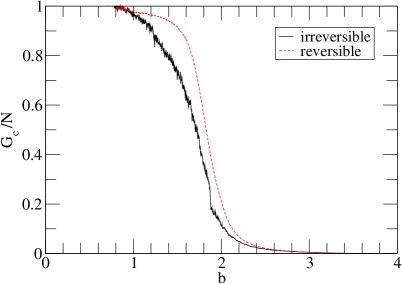
The results of the average cooperation level as a function of the temptation to defect , for SF networks showing irreversible behavior, are presented in figure 2. The return points were chosen such that , for a value of . Note that, despite the small value of , the network size is large enough so as to ensure that we are not dealing with pathological cases, since a value involves a number of cooperators . In the same way, implies 120 defector nodes. As shown in envelopes (dotted lines), the degree of irreversibility varies greatly from one realization to another. Specifically, irreversibility depends on the particular network, since for a given network repeated cycles share approximately the same curves for a given (forward or backward) direction. A most remarkable feature of the irreversibility in SF networks is that, for irreversible network realizations, the value of the temptation to defect needed to reach a cooperation level of is , that is to say, outside the PD game range.
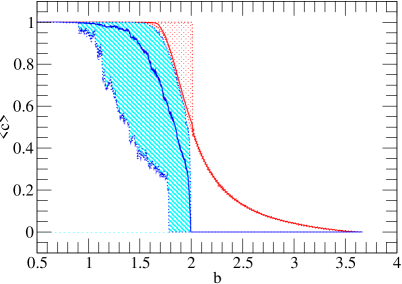
In order to validate (or refute) the hypothesis that most of the studied SF networks do not show irreversibility because the return points are not close enough to the tipping points, we have addressed the problem through a modification of the model: to avoid getting stuck in absorbing states (), now we add a constraint which keeps the minimum number of cooperators and defectors above a given threshold . In particular, we add the condition that a node can switch its strategy to defection (resp., cooperation) only if (resp., ). Figure 3 shows the cooperation level as a function of the temptation to defect , averaged over 100 different SF networks. The values of return points have been chosen such that , for a value of . In this case, all studied networks show a strong hysteresis indicating that, once the return points have been chosen close enough to the absorbing states, the process is always irreversible.
V Microscopic roots
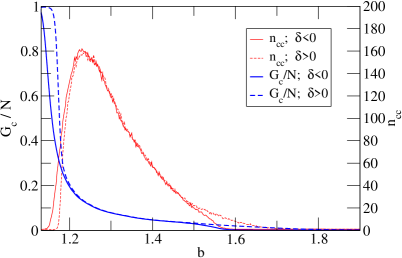
Previous studies campillo ; poncela ; jtb ; floria have shown that, in the asymptotic states of the evolutionary dynamics of the PD game, under the updating rule explained above (discrete replicator rule), the network is generically partitioned into three sets of nodes: Pure cooperators (nodes where cooperation has reached fixation), pure defectors, and fluctuating strategists (nodes where fixation is impossible so that defection and cooperation alternate forever). Pure cooperators resist invasion by grouping together in cooperator clusters, each of these connected subgraphs keeping around it a cloud of fluctuating strategists. The basis for an understanding of the irreversible behavior in ER networks is found by looking along both (-increasing and -decreasing) branches at the details of this microscopic organization of cooperation. In particular, in what follows we pay attention to the number and size of pure cooperator clusters as a function of . Figure 4 shows the averaged relative size of the largest cooperator cluster, and the average of the number of cooperator clusters versus the temptation to defect , in both semi-cycles for ER networks.
Let us first analyze the -increasing semi-cycle. In typical configurations near the absorbing state , pure cooperators percolate the network forming a giant cooperator cluster whose averaged relative size . As the temptation to defect increases, starting from such configurations, the existence of a single very large cluster of pure cooperators allows initially for a very efficient resilience to invasion by defectors until a value of is reached. From there on, invasion processes are greatly enhanced, thus inducing the fragmentation of the largest cluster: decreases quickly, the largest cluster give rise to an increasing number of small clusters of pure cooperators. At , this quantity reaches its maximum value and the largest cluster size has been reduced to . Further increase of reduces both the number of pure cooperator clusters and the size of the largest one: At basically only the largest cluster remains with a very small size which keeps decreasing further beyond the tipping point (typically found at ).
Now we analyze the -decreasing semicycle. Back from the typical configuration reached past the tipping point near the absorbing state , when decreasing the temptation value the very small size of the remaining pure cooperator cluster cannot benefit (i.e., enlarge its size) enough from the cooperative fluctuations nearby; correspondingly the level of cooperation remains well below the values observed for the -increasing branch. It is not until a value of is reached, that starts a significant increase. Simultaneously, some cooperative fluctuations in the cloud of fluctuating agents form independent (separated) small cooperator clusters, so that also starts to significantly deviate from zero. At around both and (as well as the average level of cooperation ) show already values that are very close to those exhibited by the -increasing branch. However, once reached the value , where has its maximum value (and, as explained previously, the fragmentation of the largest cluster of pure cooperators reached an end in the -increasing branch), a further decrease in leads to an increase of , and a concomitant decrease of due to the connection of small cooperator clusters to the largest one. These processes take place at a slower pace than the corresponding fragmentation occurring for the -increasing branch. The consequence is that the values of the cooperation level in this range of for the -decreasing branch, are significantly lower than those for the -increasing semi-cycle. Note that though the values of , , and in the range of intermediate values are very similar in both branches, the system keeps memory of the path followed, demonstrating the importance of the particular topological details of the organization of cooperator clusters.
A significant difference, regarding the microscopic organization of cooperation, between ER and SF networks, is the observation first reported in campillo that for SF networks pure cooperators group together in a single cluster, while in ER networks they are disaggregated into several cooperator clusters for generic values of . In our simulations here we are using network sizes that are larger than those used in campillo by a factor of , and for SF networks we have observed nodes that, though being isolated from the main cooperator cluster, remain cooperators during observational time scales. Strictly speaking they are not pure cooperators, for the probability of invasion by the defective strategy is not strictly zero (in all the cases analyzed), though it turns out to be exceedingly small, due to the large connectivity (degree) of these nodes. These quasi-pure cooperators appear in both branches; also, they are present in reversible paths, i.e., those where return points are chosen before reaching tipping points. For a network size of its number is never larger than for -increasing branches, and not larger than for -decreasing branches. Their contribution both direct and indirect (through the cloud of fluctuating strategists each one keeps nearby) to the level of cooperation can be considered as negligible. Still one cannot discard a priori an eventual role they might play in the reshaping of the main cooperator cluster during the hysteresis cycle of particular irreversible realizations.
In figure 5 we plot the relative size of the cooperator cluster averaged over irreversible realizations for both forward and backward branches of the cycle. Contrary to what happens for ER networks at high values of the temptation to defect, when starting to decrease it from , the size of the cooperator cluster in SF networks initially follows very closely the values of the forward branch until . However, significant differences in the average cooperation value (see figure 2) are already noticeable from , indicating that the contribution from the cloud of fluctuating strategies is lower for the backward branch. When further decreasing down from , the averaged size of the cooperator cluster takes on values progressively lower than in the -increasing branch. This agrees nicely with the observation just made in previously regarding the cloud of fluctuating strategies, for the growth of the cooperator cluster originates from the cooperative fluctuations in its frontier, and thus the strength of these fluctuations determines the pace of the cluster size growth. The difference between forward and backward branches persists down to the tipping point, which somewhat surprisingly occurs for values of outside the PD game range.
VI Conclusions
In this paper, we have studied the evolutionary dynamics of a classical PD game on top of complex homogeneous and heterogeneous networks. Although there are many results available in the literature, here we have addressed a problem that can be of interest in real settings. Admittedly, to the best of our knowledge, all known results have dealt with situations in which the average levels of cooperation reported are obtained by averaging over different initial conditions for fixed values of the model parameters. However, real system are continuously evolving from a given micro-state characterized by a distribution of strategists to another one driven by both the internal dynamics (the evolutionary rules) and the external conditions. The latter can be ultimately modeled as if the entries of the payoff matrix were changed. For instance, in some conditions, the pressure towards cooperation could be greater than in other situations or the other way around. This means that parameters such as the temptation to defect could change continuously and that such a change takes place without reseting the system, i.e., the initial condition is the previous steady state of the system.
Our results show that the generic existence of different stationary strategic configurations for the evolutionary dynamics of the PD game on networks (under the discrete replicator strategy updating rule) allows for a hysteresis-like behavior of the average cooperation level when the model parameter is quasi-statically varied. However, our results on random complex networks indicate that the observation of hysteresis is greatly conditioned by the range of variation of the parameter. Unless the temptation to defect is brought to a large (resp. small) enough value, so as the cooperation level reaches an almost zero (resp. unity) value, the behavior is perfectly reversible.
VII Acknowledgement
We thank José Cuesta for many helpful comments and discussions. This work has been partially supported by MINECO through Grant FIS2011-25167; Comunidad de Aragón (Spain) through a grant to the group FENOL and by the EC FET-Proactive Project MULTIPLEX (grant 317532).
References
- (1) M.A. Nowak, Evolutionary Dynamics: Exploring the Equations of Life, Harvard University Press, Cambridge, 2006.
- (2) J. Hofbauer, K. Sigmund, Evolutionary Games and Population Dynamics, Cambrige University Press, Cambridge, 1998.
- (3) H. Gintis, Game Theory Evolving, Princeton University Press, Princeton, 2000.
- (4) J. Hofbauer, K. Sigmund, Evolutionary game dynamics, Bull. Am. Math. Soc. 40 (2003) 479–519.
- (5) M. M. Flood, L.J. Savage, A Game Theoretic Study of the Tactics of Area Defense, RAND Research Memorandum 51 (1948).
- (6) J. Maynard Smith, G.R. Price, The Logic of animal Conflict, Nature 246 (1973) 15-18.
- (7) R. Albert, and A.-L. Barabási, Statistical mechanics of complex networks, Rev. Mod. Phys. 74 (2002) 47-97.
- (8) M.E.J. Newman, The structure and function of complex networks SIAM Rev. 45 (2003) 167-256.
- (9) S. Boccaletti, V. Latora, Y. Moreno, M. Chavez and, D.-U. Hwang, Complex networks: Structure and dynamics, Phys. Rep. 424 (2006) 175-308.
- (10) S.N. Dorogovtsev, A.V. Goltsev, and J.F.F. Mendes, Critical phenomena in complex network, Rev Mod. Phys. 80 (2008) 1275-1335.
- (11) G. Szabó, G. Fath, Evolutionary games on graphs, Phys. Rep. 446 (2007) 97-216.
- (12) C.P. Roca, J.A. Cuesta, A. Sánchez, Evolutionary game theory: Temporal and spatial effects beyond replicator dynamics, Phys. Life Rev. 6 (2009) 208-249.
- (13) M. Perc, J. Gómez-Gardeñes, A. Szolnoki, L.M. Floría, Y. Moreno, Evolutionary dynamics of group interactions on structured populations – A review, J. Roy. Soc. Interface 10 (2013) 20120997.
- (14) F.C. Santos, J. M. Pacheco, Scale-free networks provide a unifying framework for the emergence of cooperation, Phys. Rev. Lett 95 (2005) 098104.
- (15) F. C. Santos, J. M. Pacheco, A new route to the evolution of cooperation, J. Evol. Biol. 19 (2006) 726-733.
- (16) F.C. Santos, J. F. Rodrigues, J.M. Pacheco, Graph topology plays a determinant role in the evolution of cooperation, Proc. Biol. Sci. 273 (2006) 51-55.
- (17) F. C. Santos J. M. Pacheco, T. Lenaerts, Evolutionary dynamics of social dilemmas in structured heterogeneous populations, Proc. Natl. Acad. Sci. USA 103 (2006) 3490-3494.
- (18) J. Gómez-Gardenes et al., Dynamical Organization of Cooperation in Complex Topologies, Phys. Rev. Lett. 98 (2007) 108103.
- (19) J. Poncela, J. Gómez-Gardenes, L.M. Floría, Y Moreno, Robustness of cooperation in the evolutionary prisoner’s dilemma on complex networks, New J. Phys. 9 (2007) 184-189.
- (20) J. Gómez-Gardenes et al. Natural selection of cooperation and degree hierarchy in heterogeneous populations, J. Theor. Biol. 253 (2008) 296-301.
- (21) A. Szolnoki, M. Perc, Z. Danku, Towards effective payoffs in the prisoner’s dilemma game on scale-free networks, Physica A 387 (2008) 2075-2082.
- (22) L. M. Floría et al. Social network reciprocity as a phase transition in evolutionary cooperation, Phys. Rev. E 79 (2009) 026106.
- (23) C. Gracia-Lázaro et al. Heterogeneous networks do not promote cooperation when humans play a Prisoner’s Dilemma, Proc. Natl. Acad. Sci. USA 109 (2012) 12922.
- (24) C. Castellano, S. Fortunato, and V. Loreto, Statistical physics of social dynamics, Rev. Mod. Phys. 81, (2009) 591-646.