Tuning exciton and biexciton transition energies and fine structure splitting through hydrostatic pressure in single InGaAs quantum dots
Abstract
We demonstrate that the exciton and biexciton emission energies as well as exciton fine structure splitting (FSS) in single (In,Ga)As/GaAs quantum dots (QDs) can be efficiently tuned using hydrostatic pressure in situ in an optical cryostat at up to 4.4 GPa. The maximum exciton emission energy shift was up to 380 meV, and the FSS was up to 180 eV. We successfully produced a biexciton antibinding-binding transition in QDs, which is the key experimental condition that generates color- and polarization-indistinguishable photon pairs from the cascade of biexciton emissions and that generates entangled photons via a time-reordering scheme. We perform atomistic pseudopotential calculations on realistic (In,Ga)As/GaAs QDs to understand the physical mechanism underlying the hydrostatic pressure-induced effects.
pacs:
78.67.Hc, 07.35.+k, 78.55.Cr, 42.50.-pSelf-assembled semiconductor quantum dots (QDs) have considerable potential for use as fundamental building blocks in future quantum information applications. However, so far it is impossible to use QD growth techniques for precisely controlling QD properties, which is essential for such applications. Therefore, externally tuning the QD properties post-growth is extremely important. One the most prominent examples is polarization-entangled photon pair emission through a biexciton (XX) cascade process in QDs, which requires that the different polarized photons are energetically indistinguishable. However, the underlying asymmetry for self-assembled (In,Ga)As/GaAs QDs leads to splitting in degenerate bright exciton (X) states (fine structure splitting, FSS), which is typically tens of eV Gammon et al. (1996a); Bayer et al. (2002); Gammon et al. (1996b); Bester et al. (2003), and much larger than the radiative linewidth ( 1.0 eV); therefore, photon entanglement is destroyed Stevenson et al. (2006); Hafenbrak et al. (2007). Tuning techniques, such as electric Bennett et al. (2010); Gerardot et al. (2007); Vogel et al. (2007), magnetic Hudson et al. (2007), and strain fields Trotta et al. (2012); Ding et al. (2010); Jöns et al. (2011); Seidl et al. (2006); Dou et al. (2008); Gong et al. (2011); Wang et al. (2012) used to erase the FSS have been explored. Uniaxial and biaxial stresses have been used to tune the QD structural symmetry, exciton binding energies and FSS. However, the strain that can be generated using such techniques is limited to approximately tens of MPa, which corresponds to a spectral shift by only several meVs for QD peak emissions Ding et al. (2010); Jöns et al. (2011). Herein, we report high-pressure research (up to tens of GPa) for individual QDs using the diamond anvil cell (DAC), which has been widely used to study metal-semiconductor transitions, electronic structures, and optical transitions in bulk crystals and microstructures Jayaraman (1983); Ma et al. (2004); Itskevich et al. (1998); Li et al. (1994). An exciton emission line shift in ensemble InAs/GaAs QDs is approximately 500 meV at 8 GPa Ma et al. (2004), which is much larger than the QD peak shift induced by a piezoelectric actuator PMN-PT Ding et al. (2010). However, tuning the QD structural symmetry, exciton transition states and FSS for an individual QD using the DAC has not been reported.
In this work, we demonstrate that the exciton (X) emission energy, FSS and biexciton (XX) binding energy can be successively tuned for extremely large ranges using hydrostatic pressure at up to 4.4 GPa. The emission energy, FSS and XX binding energy almost increase linearly with increased pressure. The maximum exciton emission energy shift and FSS change can extend to 380 meV and 180 eV, respectively, which is considerably greater than through other techniques. By tuning the applied pressure, color-indistinguishable photons from the biexciton and exciton emission decay through a cascade, and across generation color coincidence for biexciton and exciton transitions are generated. Therefore, entangled photon pairs are generated via the proposed “time reordering” scheme Avron et al. (2008). We also perform atomistic pseudopotential calculations on realistic (In,Ga)As/GaAs QDs under hydrostatic stress to discern the physical mechanisms underlying the effects induced by the hydrostatic pressure.
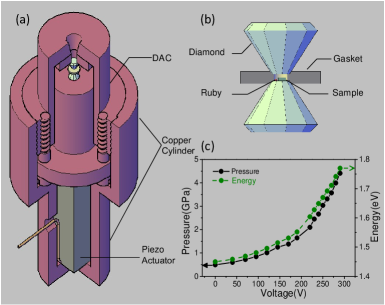
The investigated (In,Ga)As/GaAs QD samples with low QD density were grown using molecular beam epitaxy (MBE) on a semi-insulating GaAs substrate with excitonic emission energies at 1.35-1.43 eV. Figure 1(a) shows the DAC pressure device used for tuning QD photoluminescence (PL) in situ using the optical cryostat. To fit the QD samples into the DAC chamber [indicated in Fig. 1(b)], the samples were mechanically thinned to a total thickness of approximately 20 m and then cut into pieces approximately 100100 m2. Condensed argon was used as the pressure-transmitting medium in the DAC, which can be used to apply hydrostatic pressure up to 9 GPa Jayaraman (1983); Shimizu et al. (2001). The initial pressure can be adjusted at room temperature by driving screws and can be determined in situ using the ruby R1 fluorescence line shift. To successively tune the X and XX transition energies and fine structure splitting (FSS) by pressure at a low temperature, a novel and easily controlled version of the DAC shown in Fig. 1(a) was developed by combining the well-known DAC with a piezo actuator. This device can successively generate pressures up to several GPa for the QD samples studied at a low temperature using PL measurements, and the maximum applied pressure depends on the actuator stroke length. The QD sample in the DAC is cooled to 20 K through a continuous-flow liquid helium cryostat and excited by a He-Ne laser at the wavelength 632.8 nm. The excitation laser was focused to a 2 m spot on the sample using a microscope objective (NA: 0.35). The PL was collected using the same objective, spectrally filtered through a 0.5 m monochromator, and detected using a silicon-charge coupled device (CCD). A /2 wave plate and linear polarizer were used to distinguish horizontal (H) and vertical (V) linear polarization for PL components. By carefully following the changing X and XX PL energies using the polarization angle, we measure FSS with an 10 eV accuracy by fitting the experimental data to a sinusoidal function Ghali et al. (2012). Figure 1(c) displays the measured pressure values and excitonic emission energies at 20 K as a function of actuator voltage (Piezo-ceramics: PSt 150/1010/40). We clearly show that pressure can be successively tuned in situ using an optical cryostat from 0.5 to 4.4 GPa through a piezo actuator, and the corresponding blue shift for the excitonic PL peak energy is 310 meV.
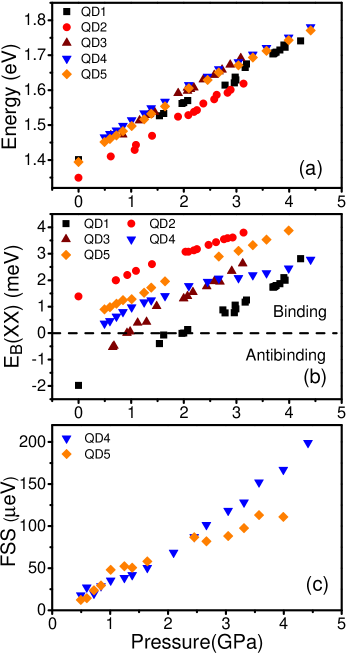
Figure 2(a) depicts the exciton emission energies as a function of the hydrostatic pressure from 0 to 4.4 GPa for QD1-QD5. At 0 GPa, the QD exciton emission energies are 1.401, 1.349, 1.406, 1.432 and 1.394 eV, respectively. The exciton emission energies for the five QDs studied herein increased linearly with the applied pressure. The blue shift for the QD1 peak energy at 4.22 GPa is approximately 330 meV, which is much larger than previously reported shifts ( 10 meV) from uniaxial or biaxial stresses using conventional methods Ding et al. (2010); Dou et al. (2008); Jöns et al. (2011); Seidl et al. (2006); Trotta et al. (2012). The experimental data were linearly fit, which generated pressure coefficients for QD1-QD5 of 82, 87, 93, 81 and 85 meV/GPa, respectively; such values are consistent with the reported pressure coefficients for ensemble quantum dot Ma et al. (2004).
Figure 2(b) shows the biexciton binding energies for QD1-QD5 as a function of hydrostatic pressure at up to 4.4 GPa. The biexciton binding energy is defined as =-, where and are the X and XX emission energies, respectively. When , the biexciton is in the “binding” state, wherein the two excitons are attracted. When , the biexciton is in the “antibinding” state, wherein the two excitons are repulsive. For the QDs studied herein, increases as a function of hydrostatic pressure up to 4.4 GPa. For QD1 and QD3, the biexcitons are in an antibinding state at zero pressure and gradually progress to the binding state at approximately 1 and 2 GPa, respectively (i.e., =0), where the exciton and biexciton are “color-indistinguishable”.
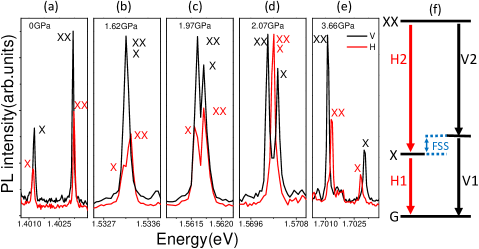
To demonstrate the biexciton antibinding-binding transitions under pressure in greater detail, we plotted the polarization-resolved PL spectra for the QD1 X and XX emission lines under different hydrostatic pressures, as shown in Fig. 3(a)-(e), wherein the red and black lines correspond to the horizontal (H) and vertical (V) polarized photons, respectively. At zero pressure, both XX emission energies, and , are higher than the X emission energy, and [see also the scheme in Fig. 3(f)]. In addition, is slightly larger than at FSS 50 eV. Under pressure, the blue shift for the X emission energy (82 meV/GPa) is more rapid than for XX (81 meV/GPa). Therefore, with increasing pressure, the V-polarized XX and X emission lines first degenerate at 1.62 GPa, as shown in Fig. 3(b), and then the H-polarized emission lines degenerate at 2.07 GPa, as shown in Fig. 3(d). In such instances, color-indistinguishable photon pairs are generated by an XX-X cascade emission at 1.62 GPa for V-polarized photons or at 2.07 GPa for H-polarized photons. Therefore, it is expected that the indistinguishable two-photon streams will be produced by adjusting a time delay between the XX and X emissions, wherein the time delay is approximately 0.4 ns Chang et al. (2009). Remarkably, at 1.97 GPa, across generation color coincidence for XX and X transition energies was generated (i.e., = and =). This is a key condition for entangled photon generation via the proposed time reordering scheme Avron et al. (2008). When pressure was further increased, the separation between the XX and X emission lines again increased, as shown in Fig. 3(e) at 3.66 GPa. Ding and coworkers demonstrated that biaxial strain can also tune the biexciton binding energies Ding et al. (2010). However, because their experiment generated a relatively small strain, biexciton antibinding-binding progression was not observed.
FSS tuning by uniaxial strain has been studied experimentally Seidl et al. (2006); Trotta et al. (2012); Kuklewicz et al. (2012) and theoreticallySingh and Bester (2010); Gong et al. (2011); Wang et al. (2012), which has shown that the maximum tuned FSS value is approximately 20 eV. It is interesting to measure the FSS change under hydrostatic pressure. Figure 2(c) depicts the FSS for QD4 and QD5 as a function of pressure at 20 K in the range 0.5 to 4.4 GPa. The figure clearly demonstrates that increasing pressure produces an approximately linear increase in FSS with the slope 44 and 28 eV/GPa for QD4 and QD5, respectively, which generates a total FSS shift as large as 180 and 100 eV for QD4 and QD5, respectively. Similar results were observed from other investigated (In,Ga)As/GaAs QDs, which indicates that such a large shift is typical for FSS under hydrostatic pressure.
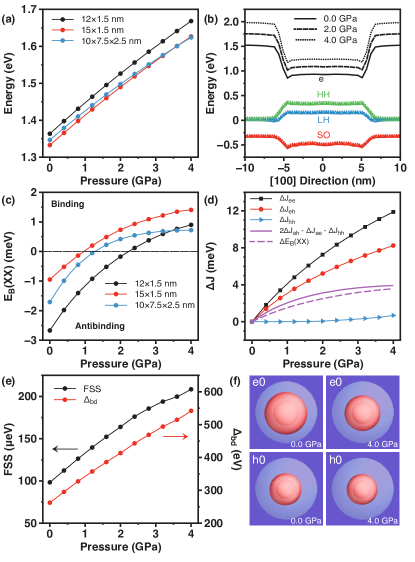
To understand the experimental results, we calculated the electronic and optical properties for the In1-xGaxAs/GaAs QDs under hydrostatic pressure using an atomistic empirical pseudopotential method (EPM) Williamson et al. (2000). The optimized QD structures are obtained by the valence force filed method Keating (1966). We then calculate the electron/hole single-particle energies and wave functions using the linear combination of bulk bands (LCBB) method Wang and Zunger (1999). The exciton and biexciton energies are calculated via the configuration interaction (CI) method Franceschetti et al. (1999). Herein, we present results for three QDs: (i) a lens-shaped InAs/GaAs QDs with the height =1.5 nm and base diameter =12 nm; (ii) a lens-shaped In0.8Ga0.2As/GaAs QDs with =1.5 nm and =12, 15 nm; and (iii) In0.8Ga0.2As/GaAs QDs with =2.5 and the elliptical major (minor) axis =10 nm (=7.5 nm) along the [10] ([110]) crystal direction.
The calculated exciton emission energies under pressure are shown in Fig. 4(a) and produce blue energy shifts at approximately 76 meV/GPa, which is consistent with the experimental values. To understand the emission energy blue shift, we analyzed the band offsets and confinement potentials for the QDs under pressure, which strongly depend on the strain distribution in the dots and matrix. When hydrostatic pressure is applied, the lattice constant for the matrix material GaAs decreases, which effectively increases the lattice mismatch between the dot material InAs and GaAs matrix. As a result, both the (absolute values of) isotropic and biaxial strain inside the dots increase. The averaged isotropic strain =-0.072-0.011 and biaxial strain = 0.12+0.0014 , where is the applied hydrostatic pressure in GPa. Figure 4(b) depicts the strain-modified band offsets for the conduction band (e), heavy hole (HH), light hole (LH) and spin-orbit (SO) bands through the dot center under P =0, 2 and 4 GPa. Whereas the band offset change is small for holes, the band offset changes dramatically for the conduction band. Under pressure, the electron bands move significantly toward the higher energy. The confinement potential also increased dramatically with increasing pressure, which is the major reason for the observed experimental results.
Because the electron-hole Coulomb energy change is relatively small [see Fig. 4(d)], the change in exciton emission energy can be estimated using the electron-hole single-particle gap , which can be written as follows:
| (1) |
where is the strain tensor inside the InAs dots, =6.08 eV is the hydrostatic deformation potential for the band gap, and =1.8 eV is the biaxial deformation potential for the valence band maximum. Therefore, we estimated that the exciton PL blue shift under hydrostatic pressure is 82 meV/GPa for pure InAs/GaAs QDs, which is consistent with the experimental values and EPM calculations. We note that the hydrostatic pressure is much more efficient at tuning the exciton emission energy than uniaxial stress (10 eV/MPa) Jöns et al. (2011); Kuklewicz et al. (2012); Wang et al. (unpublished).
The calculated XX binding energies are presented in Fig. 4(c). We found that the biexciton tends toward antibinding in small QDs under zero pressure. When the pressure increases, the for the dots calculated increased. The binding energy tends to be saturated at very high pressure. The XX binding energy for the In0.8Ga0.2As/GaAs QDs with =12 nm and =1.5 nm is consistent with the experimental QD1.
In the calculation, we found that it is important to include many electron/hole energy levels for the correct XX binding energies using the CI calculations, and the XX binding energy change as a function of pressure can be observed only using the lowest energy conduction and valence bands (i.e., Hartree-Fock approximation). Such observations suggest that the XX binding energies did not change due to the correlated energies; primarily, such changes are due to changes in the direct Coulomb integrals between the lowest electron and hole states, as follows:
| (2) |
where , and are the direct electron-electron, hole-hole and electron-hole Coulomb integrals, respectively. As shown in Fig. 4(d), whereas , and increase rapidly with pressure, is approximately flat. The solid purple line describes the changing exciton binding energy calculated using Eq. (2), which is consistent with the dashed purple line from the EPM calculations. To understand how the Coulomb integrals change under pressure, we compared the lowest electron and hole wave functions in Fig. 4(f) at 0.0 GPa and 4.0 GPa for the 121.5 nm In0.8Ga0.2As/GaAs QDs. We found that, whereas the hole wave function shape primarily does not change, the electron becomes much more localized due to the band offset changes shown in Fig. 4(b), which explains the Coulomb integral changes under pressure.
Finally, we examined FSS under hydrostatic pressure. The FSS calculated as a function of pressure is shown in Fig. 4(e), which increases dramatically with applied pressure and is consistent with the experimental data in Fig. 2(c). It is surprising that FSS changes under hydrostatic pressure, which does not change the QD symmetry. However, because the electron wave functions are more localized under pressure, an electron-hole would have a larger effective overlap under pressure, which increases the exchange energies (e.g., the dark-bright splitting , which is also shown in Fig. 4(e)). It has been shown that FSS can be roughly estimated as Wang et al. (unpublished), where is the HH-LH mixing parameter; therefore, as increases, FSS increases, as clearly demonstrated in Fig. 4(e).
To summarize, we experimentally and theoretically investigated the effects of hydrostatic pressure on the exciton and biexciton transition energies as well as FSS in single InGaAs QDs. The excitonic emission energies and FSS can be tuned in situ by applying hydrostatic pressure in an optical cryostat for changes over a wide energy range. The observed exciton emission energy blue shift and FSS change were as large as 380 meV and 180 eV, respectively, which is greater than the values from other strain-adjusting techniques. Tuning the QD optical properties over such a larger spectral range yields great advantages for future QD applications, such as for generating color-indistinguishable photon pairs from the biexciton and exciton emission decay cascades or generating entangled photon pairs via a time-reordering scheme. Furthermore, it expected that photon antibunching for optical communication band QD emission can be measured using the pressure-induced blue shift into the spectral range detected by sufficiently powerful silicon avalanche photodiodes.
BS and LH acknowledge support from the Chinese National Fundamental Research Program (Grant Nos. 2013CB922304, 2013CB933304, 2011CB921200, 2009CB929301), Chinese National Natural Science Funds (Grant No. 90921015), and National Natural Science Funds for Distinguished Young Scholars.
References
- Gammon et al. (1996a) D. Gammon, E. S. Snow, B. V. Shanabrook, D. S. Katzer, and D. Park, Phys. Rev. Lett. 76, 3005 (1996a).
- Bayer et al. (2002) M. Bayer, G. Ortner, O. Stern, A. Kuther, A. A. Gorbunov, A. Forchel, P. Hawrylak, S. Fafard, K. Hinzer, T. L. Reinecke, et al., Phys. Rev. B 65, 195315 (2002).
- Gammon et al. (1996b) D. Gammon, E. S. Snow, B. V. Shanabrook, D. S. Katzer, and D. Park, Science 5, 87 (1996b).
- Bester et al. (2003) G. Bester, S. Nair, and A. Zunger, Phys. Rev. B 67, 161306 (2003).
- Stevenson et al. (2006) R. M. Stevenson, R. J. Young, P. Atkinson, K. Cooper, D. A. Ritchie, and A. J. Shields, Nature 439, 179 (2006).
- Hafenbrak et al. (2007) R. Hafenbrak, S. M. Ulrich, P. Michler, L. Wang, A. Rastelli, and O. G. Schmidt, New Journal of Physics 9, 315 (2007).
- Bennett et al. (2010) A. J. Bennett, M. A. Pooley, R. M. Stevenson, M. B. Ward, R. B. Patel, A. Boyer de la Giroday, N. Sköld, I. Farrer, C. A. Nicoll, D. A. Ritchie, et al., Nature Phys. 6, 947 (2010).
- Gerardot et al. (2007) B. D. Gerardot, S. Seidl, P. A. Dalgarno, R. J. Warburton, D. Granados, J. M. Garcia, K. Kowalik, O. Krebs, K. Karrai, A. Badolato, et al., Appl. Phys. Lett. 90, 041101 (2007).
- Vogel et al. (2007) M. M. Vogel, S. M. Ulrich, R. Hafenbrak, P. Michler, L. Wang, A. Rastelli, and O. G. Schmidt, Appl. Phys. Lett. 91, 051904 (2007).
- Hudson et al. (2007) A. J. Hudson, R. M. Stevenson, A. J. Bennett, R. J. Young, C. A. Nicoll, P. Atkinson, K. Cooper, D. A. Ritchie, and A. J. Shields, Phys. Rev. Lett. 99, 266802 (2007).
- Trotta et al. (2012) R. Trotta, E. Zallo, C. Ortix, P. Atkinson, J. D. Plumhof, J. van den Brink, A. Rastelli, and O. G. Schmidt, Phys. Rev. Lett. 109, 147401 (2012).
- Ding et al. (2010) F. Ding, R. Singh, J. D. Plumhof, T. Zander, V. Křápek, Y. H. Chen, M. Benyoucef, V. Zwiller, K. Dörr, G. Bester, et al., Phys. Rev. Lett. 104, 067405 (2010).
- Jöns et al. (2011) K. D. Jöns, R. Hafenbrak, R. Singh, F. Ding, J. D. Plumhof, A. Rastelli, O. G. Schmidt, G. Bester, and P. Michler, Phys. Rev. Lett. 107, 217402 (2011).
- Seidl et al. (2006) S. Seidl, M. Kroner, A. Högele, K. Karrai, R. J. Warburton, A. Badolato, and P. M. Petroff, Appl. Phys. Lett. 88, 203113 (2006).
- Dou et al. (2008) X. M. Dou, B. Q. Sun, B. R. Wang, S. S. Ma, R. Zhou, S. S. Huang, H. Q. Ni, and Z. C. Niu, Chin. Phys. Lett. 25, 1120 (2008).
- Gong et al. (2011) M. Gong, W. Zhang, G.-C. Guo, and L. He, Physical Review Letters 106, 227401 (2011).
- Wang et al. (2012) J. Wang, M. Gong, G.-C. Guo, and L. He, Applied Physics Letters 101, 063114 (2012).
- Jayaraman (1983) A. Jayaraman, Rev. Mod. Phys. 55, 65 (1983).
- Ma et al. (2004) B. S. Ma, X. D. Wang, F. H. Su, Z. L. Fang, K. Ding, Z. C. Niu, and G. H. Li, J. Appl. Phys. 95, 933 (2004).
- Itskevich et al. (1998) I. E. Itskevich, S. G. Lyapin, I. A. Troyan, P. C. Klipstein, L. Eaves, P. C. Main, and M. Henini, Phys. Rev. B 58, R4250 (1998).
- Li et al. (1994) G. H. Li, A. R. Goñi, K. Syassen, O. Brandt, and K. Ploog, Phys. Rev. B 50, 18420 (1994).
- Avron et al. (2008) J. E. Avron, G. Bisker, D. Gershoni, N. H. Lindner, E. A. Meirom, and R. J. Warburton, Phys. Rev. Lett. 100, 120501 (2008).
- Shimizu et al. (2001) H. Shimizu, H. Tashiro, T. Kume, and S. Sasaki, Phys. Rev. Lett. 86, 4568 (2001).
- Ghali et al. (2012) M. Ghali, K. Ohtani, Y. Ohno, and H. Ohno, Nat. Commun. 3, 661 (2012).
- Chang et al. (2009) X. Y. Chang, X. M. Dou, B. Q. Sun, Y. H. Xiong, Z. C. Niu, H. Q. Ni, and D. S. Jiang, J. Appl. Phys. 106, 103716 (2009).
- Kuklewicz et al. (2012) C. E. Kuklewicz, R. N. E. Malein, P. M. Petroff, and B. D. Gerardot, Nano Lett. 12, 3761 (2012).
- Singh and Bester (2010) R. Singh and G. Bester, Phys. Rev. Lett. 104, 196803 (2010).
- Williamson et al. (2000) A. J. Williamson, L.-W. Wang, and A. Zunger, Phys. Rev. B 62, 12963 (2000).
- Keating (1966) P. N. Keating, Phys. Rev 145, 637 (1966).
- Wang and Zunger (1999) L.-W. Wang and A. Zunger, Phys. Rev. B 59, 15806 (1999).
- Franceschetti et al. (1999) A. Franceschetti, H. Fu, L.-W. Wang, and A. Zunger, Phys. Rev. B 60, 1819 (1999).
- Wang et al. (unpublished) J. Wang, G.-C. Guo, and L. He (unpublished).