The X-ray/UV absorber in NGC 4593
Abstract
We present the results of a recent (March 2011) 160 ks Chandra-LETGS observation of the Seyfert galaxy NGC 4593, and the analysis of archival X-ray and UV spectra taken with XMM-Newton and HST/STIS in 2002. We find evidence of a multi-component warm absorber (WA) in the X-rays with four distinct ionisation degrees (, , , and ) outflowing at several hundreds of km s-1. In the UV we detect 15 kinematic components in the absorbers, blueshifted with respect to the systemic velocity of the source, ranging from km s-1 to km s-1. Although the predicted C iv and N v column densities from the low-ionisation X-ray outflow are in agreement with those measured for some components in the STIS spectrum, there are kinematic discrepancies that may prevent both the X-ray and UV absorbers from originating in the same intervening gas. We derive upper limits on the location of the absorbers finding that the high-ionisation gas lie within pc from the central ionising source, while the low-ionisation gas is located at several hundreds of pc. This is consistent with our line of sight passing through different parts of a stratified wind. The total kinetic energy of the outflows injected into the surroundings of the host galaxy only accounts for a tiny fraction of the bolometric luminosity of the source and it is therefore unlikely that they may cause a significant impact in the interstellar medium of NGC 4593 in a given single episode of activity.
keywords:
galaxies: individual: NGC 4593 – galaxies: Seyfert – quasars: absorption lines – X-rays: galaxies – ultraviolet: galaxies.1 Introduction
Active galactic nuclei (AGN) are powered by accretion of matter onto the central supermassive black hole (SMBH) that is believed to reside in their centre (see Rees 1984 for a review). The large bolometric output of AGN is powerful enough to drive ionised winds into the medium of the host galaxy in the form of mass outflows. Indeed, more than 50% of nearby Seyfert 1 galaxies present clear evidence of photoionised gas, the so-called warm absorber (WA hereafter), in their soft X-ray spectra (e.g. Reynolds 1997; George et al. 1998; Crenshaw, Kraemer & George 2003), and in their UV spectra (Crenshaw et al. 1999; Kriss 2002; Dunn et al. 2010).
These WA are usually detected as absorption features blushifted with respect to the systemic velocity of the source, typically by hundreds of km s-1 (Kaastra et al. 2000; Kaspi et al. 2001). These mass outflows inject mass and energy into the interstellar medium (ISM) and can deeply affect the evolution of the host galaxy (Silk & Rees 1998; Wyithe & Loeb 2003) and even the surrounding intergalactic medium (IGM, Granato et al. 2004; Scannapieco & Oh 2004). If the kinetic luminosity of the outflows is as high as 0.5% to 5% of the bolometric luminosity (Hopkins & Elvis 2010; Di Matteo, Springel & Hernquist 2005), their impact is enough to significantly regulate galaxy growth and reproduce the observed relation (Ferrarese & Merritt 2000; Gebhardt et al. 2000).
In spite of their importance, the structure, origin, launching mechanism, and relation between the X-ray and UV absorbers are not yet fully understood. The proposed origins for AGN outflows are disc-driven winds (Murray & Chiang 1995; Elvis 2000) and thermal winds produced by evaporation from the torus (Krolik & Kriss 2001). Winds emanating from the accretion disc are expected to lie within several hundred gravitational radii, while thermally-driven winds should originate at pc scales, at or beyond the location of the dusty torus. An accurate determination of the distance is essential to establish the actual mass outflow rate and assess their importance as contributors for cosmic feedback processes.
In this paper we present the results of the analysis of a ks observation with Chandra-LETGS and archival X-ray and UV observations with XMM-Newton and HST-STIS, respectively, of the nearby (, Strauss et al. 1992) Seyfert 1 galaxy NGC 4593. It is a mildly luminous AGN ( erg s-1, this work) and is hosted by a barred spiral galaxy with a relatively modest-size SMBH in its centre ( , Denney et al. 2006). NGC 4593 has been subject to a number of prior observations in the X-ray domain. Steenbrugge et al. (2003) found evidence of an ionised absorber at the redshift of the source using Chandra-LETGS and XMM-Newton observations. McKernan et al. (2003) confirmed the presence of this WA using a Chandra-HETGS observation, and adequately described the observed features using a single-zone photoionised gas, although some features remained unidentified. Brenneman et al. (2007) found evidence of a multi-zone layer of absorbing material intrinsic to the source using a 76 ks XMM-Newton EPIC-pn observation. They could not further constrain its physical parameters as the RGS spectrum in this observation was not used.
This paper is organised as follows. In Sect. 2 we present the X-ray and UV data and the reduction techniques used. In Sect. 3 we describe the spectral analysis and the different models used to characterize the X-ray and UV spectra. In Sect. 4 we discuss our results and our conclusions are summarised in Sect. 5. Throughout this paper we assume a cosmological framework with km s-1 Mpc-1, , and . The quoted errors refer to 68.3% confidence level ( for one parameter of interest) unless otherwise stated.
2 The data
NGC 4593 was observed on two consecutive orbits in March 2011 by the Low Energy Transmission Grating Spectrometer (LETGS, Brinkman et al. 2000) with the HRC-S detector on board of Chandra for a total exposure time of 160 ks. The LETGS data were reduced using the standard pipeline (CIAO 4.2) until the level 1.5 event files were created. The rest of the procedure, until the creation of the final level 2 event file, followed the same steps as the standard pipeline regarding the wavelength accuracy determination and effective area generation, but was carried out using an independent procedure first described in Kaastra et al. (2002).
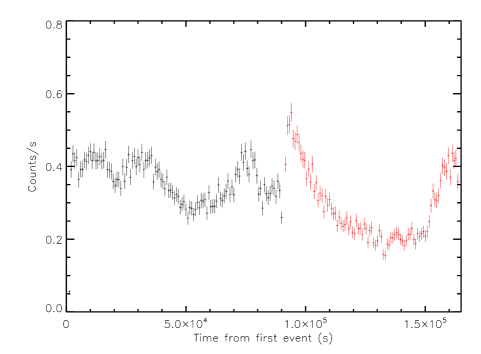
No episodes of short-term variability (e.g. within a few ks) were observed after applying a bin size of 100 s. During the first observation the source flux varies smoothly, while during the second observation the source experiences a drop in flux of the order of 50% followed by a recovery in the last part of the observation (see Fig. 1). Because of the low statistics, no significant spectral variations were observed between the high and low spectral states (i.e. spectral fits for the low and high flux states rendered the same parameter values within the uncertainties). The combined spectra were therefore used in the analysis described throughout this paper.
We also retrieved a XMM-Newton observation of NGC 4593 taken in 2002 from the XMM-Newton Science Archive (XSA). The analysis of this observation was first reported in Brenneman et al. (2007) but they did not include the data from the Reflection Grating Spectrometer (RGS, den Herder et al. 2001). We processed these data with the standard XMM-Newton analysis system SAS version 11. Only data from the second, restarted exposure U002 were used, since the first (default) exposure (S004/S005) was stopped almost immediately due to high radiation and contained virtually no data. We used cross dispersion and CCD pulse-height selections of 95%, and background exclusion of 98% (the SAS default settings). The spectra were binned in beta space and the response matrix used 9 000 bins. The net exposure time of this observation was about 77 ks. The Chandra LETGS and XMM-Newton observation logs are shown in Table 1.
In the UV, NGC 4593 was observed with the Space Telescope Imaging Spectrograph (STIS) in June 2002 for 11 000 s, using the echelle E140M grating and the arcsec aperture. The echelle spectrum was directly retrieved from the MAST archive with all up-to-date calibrations applied, including corrections for scattered light in the echelle mode (Valenti et al. 2002) and for the echelle blaze corrections (Aloisi et al. 2007). The STIS observation log of NGC 4593 is shown in Table 2.
| Observatory | Obs ID | Date | Start Time | Exp. Time |
|---|---|---|---|---|
| (dd-mm-yyyy) | (hh:mm:ss) | (s) | ||
| (1) | (2) | (3) | (4) | (5) |
| Chandra | 12154 | 02-03-2011 | 19:59:04 | 88 730 |
| Chandra | 13240 | 05-03-2011 | 03:58:07 | 72 630 |
| XMM-Newton | 0059830101 | 23-06-2002 | 10:05:05 | 87 238 |
| Data Set | Grating | Date | Start Time | Exp. Time |
|---|---|---|---|---|
| (dd-mm-yyyy) | (hh:mm:ss) | (s) | ||
| (1) | (2) | (3) | (4) | (5) |
| O5L501020 | E140M | 23-06-2002 | 22:30:02 | 2 287 |
| O5L501030 | E140M | 23-06-2002 | 23:55:09 | 2 899 |
| O5L501040 | E140M | 24-06-2002 | 01:31:19 | 2 899 |
| O5L501050 | E140M | 24-06-2002 | 03:07:28 | 2 899 |
| Model | |||
|---|---|---|---|
| (keV) | (erg cm-2 s-1) | ||
| (1) | (2) | (3) | (4) |
| Power law | |||
| Mod. black body | |||
| Line | Wavelength | ||
| (Å) | (Å) | ( erg cm-2 s-1) | |
| (5) | (6) | (7) | (8) |
| Ne ix (f) | 13.698 | ||
| O viii | 18.969 | ||
| O vii (i) | 21.808 | ||
| O vii (f) | 22.101 | ||
| N vi (i) | 29.083 | ||
| N vi (f) | 29.535 | ||
| C vi | 33.736 |
3 Analysis
The combined LETGS spectrum, and the XMM-Newton RGS spectrum as well as the STIS spectrum were analysed using the SPEX111http://www.sron.nl/spex fitting package v2.04 (Kaastra et al. 1996). The adopted fitting method was C-statistics (Cash 1979) so that binning of the data is in principle no longer needed. However, the data were rebinned by a factor of 3 to avoid oversampling. In this section we describe the different models and techniques used to model the continuum and the absoption and emission features present in the spectra of NGC 4593. The adopted cosmological redshift of NGC 4593 is (Strauss et al. 1992).
3.1 X-rays
In this section we report the X-ray analysis of the Chandra and XMM-Newton observations. We first model the continuum and emission lines in the LETGS and RGS spectra, while the absorption features are described using two independent models: a first approach using the slab model in SPEX, and a more physical photoionization model using xabs.
3.1.1 Continuum and emission lines
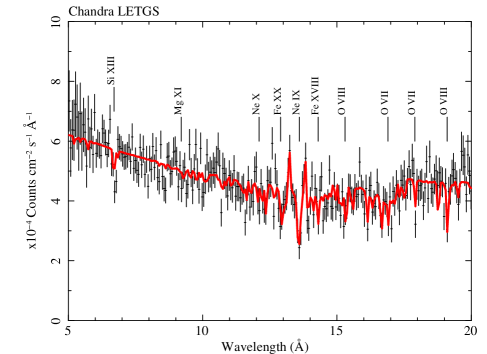
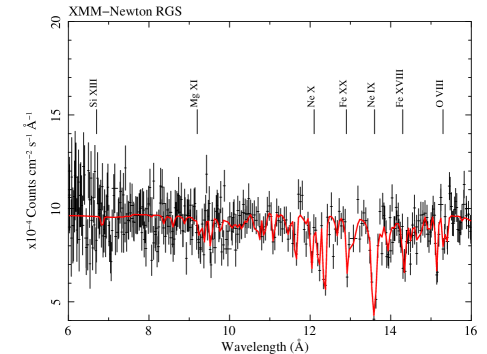
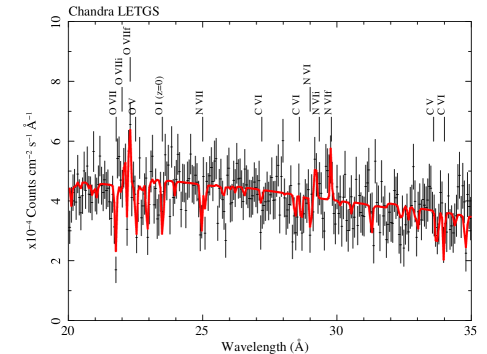
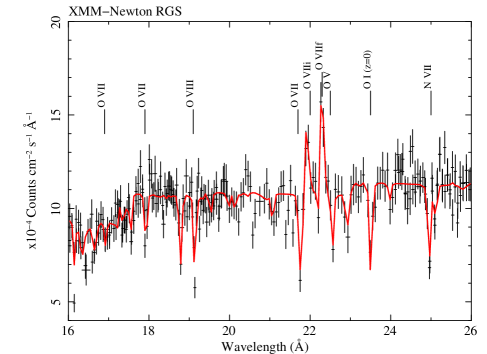
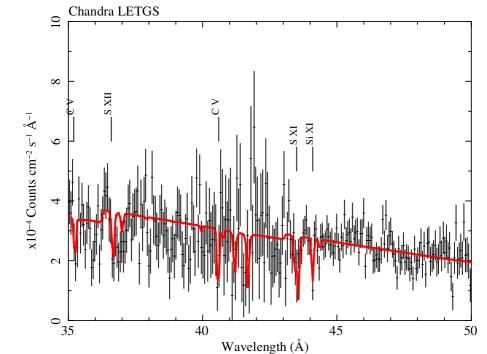
A visual inspection of the combined LETGS spectrum reveals a wealth of absorption lines, including a broad dip in the continuum in the Å range (see Fig. 2). Some significant emission lines are also present (see Fig. 3, left panels). The spectrum at wavelengths longer than 60 Å was dominated by the background so in what follows the spectral fits where carried out in the Å range.
The continuum was modeled with a power law. Local foreground absorption was set to cm-2 (Dickey & Lockman 1990) using the hot model in SPEX, fixing the temperature to eV to mimic a neutral gas. The excess in soft X-rays was accounted for adding a modified black body model (mbb model in SPEX), which considers modifications of a simple black body model by coherent Compton scattering and it is based on the calculations of Kaastra & Barr (1989). The power law provides a photon index , and the modified black body has a temperature keV. The best-fit parameters and fluxes of the LETGS continuum are reported in Table 3.
The emission features were modeled with Gaussian lines. We kept the centroid wavelength frozen to the laboratory values, while the normalization and line widths were left as free parameters. Emission lines of O viii and C vi are marginally detected at the confidence level. Some lines of the He-like triplets of Ne ix, O vii, and N vi are also detected although not all of them, and with variable significance. The forbidden () lines of Ne ix and O vii are significantly detected at the confidence level, while that of N vi is only detected at the level. Likewise, the intercombination () line of O vii is significantly detected above the confidence level, while N vi (i) is marginally detected at the level, and Ne ix (i) is statiscally undetected. The resonance () lines of these species are statistically undetected in this dataset, even though the low continuum flux favours the detection of emission lines, which indicates that the main ionisation process is photoionisation (Porquet & Dubau 2000). The best-fit parameters of the emission lines in the LETGS spectrum are reported in Table 3.
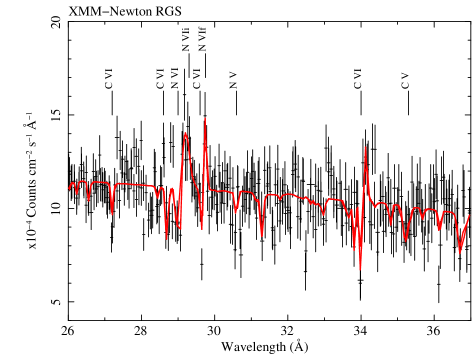
The RGS spectrum of NGC 4593 was analysed in the same manner as the LETGS combined spectrum. The fitting range was set to the Å interval. The local foreground absorption was set to the same parameter values and the continuum was also fitted using a simple power law plus a modified black body model. The overall flux of the source in the keV range at the time of the XMM-Newton observation was higher than that of Chandra by almost a factor of 2, and the power law slope was steeper (). The normalization of the modified black body was also higher by a factor of 2, although the temperature remained the same as in the LETGS spectrum (). The best-fit values are reported in Table 4.
Despite the higher continuum level in the RGS spectrum with respect to that of the LETGS one, we were also able to detect several emission features with significances at the confidence level or better, thanks to the better signal-to-noise ratio of the spectrum. The lines were modeled using again Gaussians with the centroid wavelength fixed, and the normalization and width of the line as free parameters. The species detected were the same as in the LETGS spectrum, and their best-fit parameters are reported in Table 4. We further discuss the emission lines in NGC 4593 in Sect. 4.2.
| Ion | Transition | |||
| (Å) | (LETGS) | (RGS) | ||
| (1) | (2) | (3) | (4) | (5) |
| C v | 40.268 | 3 | ||
| 34.973 | 4 | 6 | ||
| C vi | 33.736 | 3 | 28 | |
| 28.466 | 7 | 15 | ||
| 26.990 | 4 | 16 | ||
| N vi | 28.788 | 4 | 23 | |
| 24.900 | 7 | 14 | ||
| N vii | 24.781 | 4 | 38 | |
| 20.910 | 1 | 7 | ||
| O v | 22.370 | 6 | 16 | |
| O vi | 22.019 | 3 | 23 | |
| O vii | 21.602 | 15 | 25 | |
| 18.628 | 3 | 7 | ||
| 17.768 | 3 | 6 | ||
| 17.396 | 1 | 6 | ||
| 17.200 | 2 | 6 | ||
| O viii | 18.969 | 6 | 11 | |
| 16.006 | 6 | 35 | ||
| 15.176 | 2 | 7 | ||
| 14.821 | 2 | 9 | ||
| Ne vii | 13.814 | 8 | 19 | |
| Ne viii | 13.653 | 2 | 7 | |
| Ne ix | 13.447 | 23 | 45 | |
| 11.547 | 8 | 6 | ||
| 11.000 | 2 | 6 | ||
| Ne x | 12.132 | 2 | 14 | |
| 10.238 | 1 | 6 | ||
| Mg ix | 9.378 | 3 | 6 | |
| Mg x | 9.281 | 3 | 6 | |
| Mg xi | 9.169 | 2 | 10 | |
| 7.851 | 3 | 7 | ||
| Mg xii | 8.419 | 4 | 6 | |
| Si xi | 43.762 | 13 | ||
| Si xii | 40.911 | 3 | ||
| Si xiii | 6.648 | 15 | 8 | |
| S x | 42.495 | 2 | ||
| S xi | 39.240 | 5 | ||
| S xii | 36.398 | 4 | 6 | |
| S xiii | 32.238 | 4 | 18 |
3.1.2 Absorption lines: modeling with slab
The absoption features seen in the X-ray spectra are mostly attributed to the presence of ionised gas at the redshift of the source (McKernan et al. 2003; Steenbrugge et al. 2003). Before performing any global modeling of the spectra, we examined them to identify the different absorption troughs in a one-by-one basis. While this is possible to a considerable extent, some of identifications cannot be resolved in this way because of blending with a neighboring transition, the most clear example being the plethora of transitions in the Fe UTA. In Table 5 we report the majority of the absorption lines seen in the LETGS and RGS spectra, along with their statistical significance expressed in terms of obtained by fitting a Gaussian profile to each of them. The absorption troughs are easier to detect in the RGS spectrum because of the better signal-to-noise with respect to the LETGS spectrum. To globally characterize the WA in NGC 4593, we firstly used a slab component in both Chandra and XMM-Newton spectra. The slab model in SPEX calculates the transmission of a slab of material without any assumption on the underlying ionisation balance. The free parameters of this model are the ionic column densities, the rms velocity broadening, and the outflow velocity.
The addition of a single slab component to the Chandra LETGS spectrum significantly improved the fit from to , although several troughs remained unfitted. Some of the lines seemed to belong to the same ionisation species albeit with slightly different outflow velocities. For this reason we employed a fitting strategy that included all ions for each velocity component in the same manner as Detmers et al. (2011). This model is physically more realistic as it allows a multi-velocity structure for every absorption line, consistent with what is typically found in the UV spectra of AGN. The addition of a second slab component further improves the fit by . Visually, the fit was not good enough yet with several residuals at higher energies, where most of the higher ionisation species are expected to lie. Therefore, we added a third slab component that improved the fit by a further for a final . The addition of more components no longer improved the fit.
The basic WA structure in NGC 4593 depicted by the fit of the LETGS spectrum suggest the presence of a multi-kinematic absorption system with outflow velocities of , , and km s-1, respectively, with velocity widths km s-1. The differences in the outflow velocities of the three components are not dramatic, all of them outflowing at modest velocities of a few hundreds of km s-1, typical of the WA often seen in Seyfert 1 galaxies (Blustin et al. 2005). The ionic column densities obtained in the fit for the most relevant ions are reported in Table 6. From these results it becomes apparent that the faster component accounts for the majority of the higher ionisation species, while the slower component accounts for the less ionised ones.
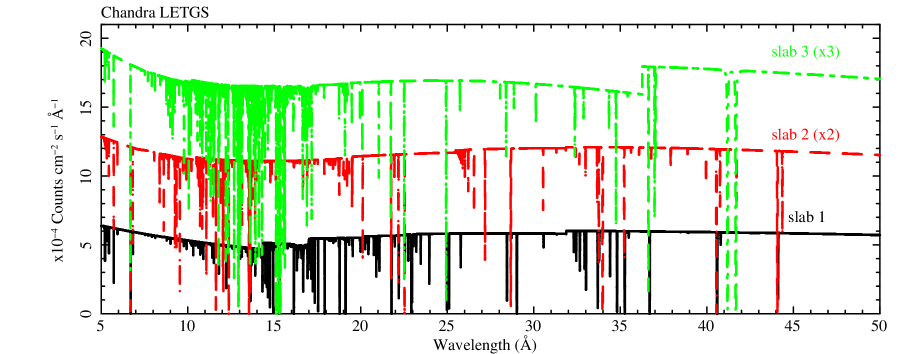
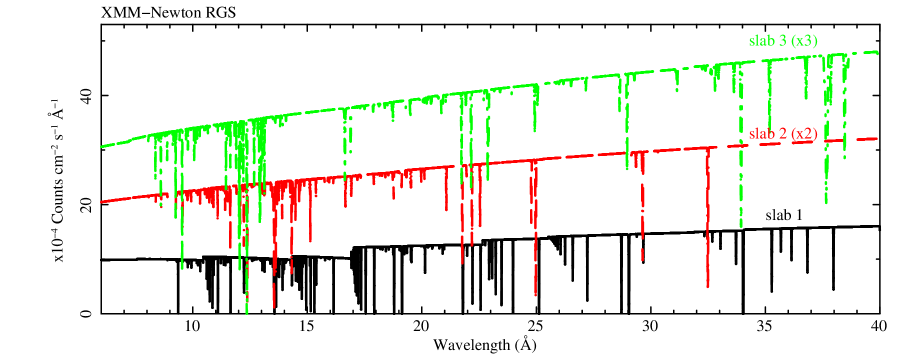
A similar approach was followed to model the absorbers in the XMM-Newton RGS spectrum of NGC 4593. Compared with the LETGS spectrum, the RGS data has a higher flux and better signal-to-noise ratio, which favors the detection of absorbtion features. The addition of a single slab component renders a goodness of fit of , but it is not visually satisfactory. A second slab component significantly improves the fit by . Similarly to the LETGS fitting, we added a third slab component that accounted for the higher velocity ions, obtaining a final fit improvement by , slightly below the level, for a final best-fit with . A model plot of the different slab components in the LETGS and RGS spectra is shown in Fig. 4.
The three kinematic components detected in the RGS spectrum have outflow velocities of , , and km s-1, respectively. While there seems to be an apparent mismatch between the velocities measured by Chandra and XMM-Newton, it is known that there is a systematic uncertainty in the RGS wavelength. Such uncertainty translates into a difference between the LETGS and RGS wavelength scales of mÅ , which corresponds to a velocity offset of 110 km s-1 at a typical wavelength of 20 Å. Therefore, there is no discrepancy between the RGS and LETGS wavelength scales within the systematic uncertainties. Moreover, in spite of the flux variation between the XMM-Newton and Chandra observations (roughly a factor of 2 higher in the former), no dramatic changes in the ionic column densities of the different species are observed. These values are also reported in Table 6. Although the slab modeling makes no a priori assumption on the underlying ionising continuum, as a guide we also report in Table 6 the value of the ionisation parameter (which is not a parameter of the slab model) at which each of the species reachs a peak in its concentration, as provided by the spectral energy distribution for each observation (see Sect. 3.1.3).
| Chandra LETGS | XMM-Newton RGS | |||||||
| Component | 1 | 2 | 3 | 1 | 2 | 3 | ||
| (km s-1) | ||||||||
| (km s-1) | ||||||||
| Ion | ||||||||
| (cm-2) | (cm-2) | (cm-2) | (erg cm s-1) | (cm-2) | (cm-2) | (cm-2) | (erg cm s-1) | |
| (1) | (2) | (3) | (4) | (5) | (6) | (7) | (8) | (9) |
| C v | ||||||||
| C vi | ||||||||
| N v | ||||||||
| N vi | ||||||||
| N vii | ||||||||
| O v | ||||||||
| O vi | ||||||||
| O vii | ||||||||
| O viii | ||||||||
| Ne ix | ||||||||
| Mg x | ||||||||
| S xii | ||||||||
| Fe ix | ||||||||
| Fe xvi | ||||||||
| Fe xvii | ||||||||
| Fe xviii | ||||||||
| Fe xix | ||||||||
| Fe xx | ||||||||
| Fe xxi | ||||||||
| Fe xxii |
Note: aTo compare with the LETGS wavelength scale, km s-1 must be substracted to these values (see text).
3.1.3 Absorption lines: photoionisation modeling
The slab model suggests that the absorption system in NGC 4593 may consist of different components in different kinematic regimes and ionisation states. Since we did not detect significant variability in the properties of the absorbers in Sect. 3.1.2, we modeled the absoption spectrum simultaneously for the RGS and LETGS spectra with the xabs model, which calculates the transmission of a slab of material where all ionic column densities are linked through a photoionisation balance model. This was calculated using CLOUDY (Ferland et al. 1998) version C10. The fitting package SPEX allows us to place the spectra in different sectors so that the xabs free parameters can be coupled, while the continuum and emission line parameters are independently fitted. The photoionsation balances provided to xabs calculated from the SED at the epochs of the XMM-Newton and Chandra observations are also assigned to each sector independently.
The free parameters in the xabs fit are the ionisation parameter , the hydrogen column density , the velocity width , and the outflow velocity . The abundances were set to the proto-Solar values of Lodders & Palme (2009). The ionisation parameter is a measure of the ionisation state of the gas, and it is defined as
| (1) |
where is the ionising luminosity in the Ryd range, is the hydrogen density of the gas, and is the distance from the ionising source.
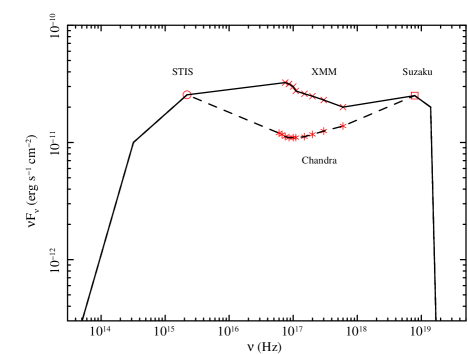
The spectral energy distribution (SED) provided to CLOUDY as an input was built using the X-ray and UV points from the XMM-Newton, Chandra and STIS observations discussed in this paper. At higher frequencies we use an observation of NGC 4593 by Suzaku in 2007 (Markovitz & Reeves 2009). At lower energies, the shape of the SED resembles the one assumed by CLOUDY for a standard ionisation continuum. We note that only the STIS and XMM-Newton observations were taken simultaneously. However, the SED with STIS and Chandra data may still provide reliable results since the bulk of the ionising continuum is in the X-ray domain and that the UV continuum variability is typically less than 60%, although changes of up to a factor of 4 can occasionally be seen, according to IUE monitoring for almost a decade222http://www.chara.gsu.edu/PEGA/IUE/ObjectTbl.cgi (Dunn et al. 2006). The adopted SED is shown in Fig. 5.
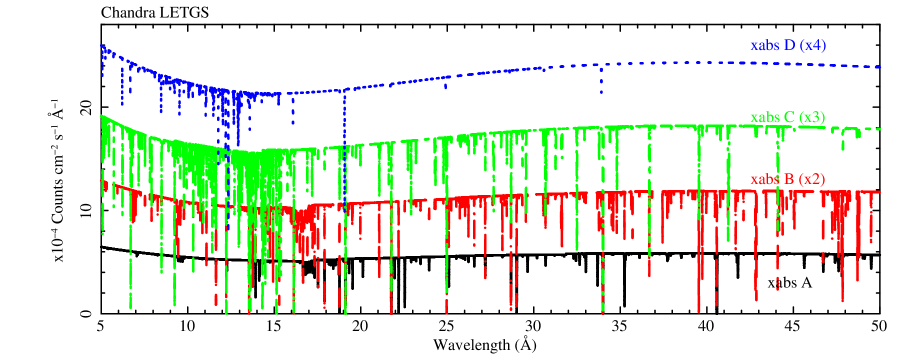
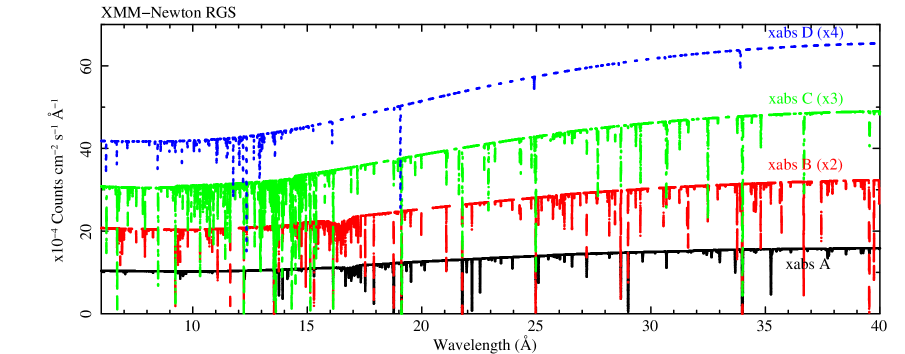
As in the case of slab we initially fitted the spectra using a single xabs component in addition to the continuum and emission line models. This hugely improved the overall fit in , albeit several troughs were not correctly accounted for. We therefore added a second xabs component that further improved the fit by , but it still left some residuals in absorption. Since the slab modeling suggested the presence of three kinematic components we added a third xabs component to the fit, which was improved by , well above the level. The WA structure at this stage was characterized by two low ionisation components with and , respectively, and a higher ionisation component with . The lower ionisation components are almost one order of magnitude shallower than the high- one ( of a few times cm-2 against cm-2). Interestingly, the fit further improves above the level () after adding a fourth xabs component, which resulted in the high- component being split in two components with and , with cm-2 and cm-2, respectively. The kinematic structure shows, as suggested by the slab modeling, increasing outflow velocities as the ionisation parameter increases. The addition of more xabs components no longer improved the fit, so a 4-component WA was adopted as the final best-fit solution with . The best-fit values are reported in Table 7. A model plot of the different xabs components in the LETGS and RGS spectra is shown in Fig. 6.
The results of these fits reveal that the WA in NGC 4593 is made of 4 components in distinct ionisation states, namely , , , and . In what follows these components will be labeled as , , , and , where is the lowest and is the highest ionisation gas. We observe a mild but significant correlation between the ionisation degree of the absorbers and their column density; the more ionised is the gas, the larger is the column density except for component which has a somewhat lower albeit with large uncertainties. Such a behaviour is not uncommon among the WA detected in other Seyfert galaxies. A similar correlation seems to exist between the ionisation parameter and the outflow velocity. The kinematic structure of the outflow suggests the presence of three kinematic components: the absorbers and are outflowing at km s-1, while component is outflowing at km s-1, and the highest ionisation one is much faster with km s-1. This behaviour may provide a hint on the location where these outflows were formed, as it is typically believed that a larger outflow velocity might indicate that the wind was launched closer to the central ionising source. This will be further discussed in Sect. 4.
| Component | ||||
|---|---|---|---|---|
| (erg cm s-1) | (cm-2) | (km s-1) | (km s-1) | |
| (1) | (2) | (3) | (4) | (5) |
3.2 UV: HST/STIS


The UV spectrum of NGC 4593 obtained by HST/STIS shows a wealth of emission and absorption lines in the Å waveband. The most prominent emission features correspond to Ly and C iv, but others belonging to N v, Si ii, Si iv, and N iv] can be clearly seen. A complex absorption spectrum is superimposed to these emission lines, with several troughs produced by intervening gas at the redshift of the source while others belong to the local interstellar medium (ISM) and the intergalactic medium (IGM) between our Galaxy and NGC 4593 (see Fig. 7).
A detailed analysis of the UV continuum and physical properties of the ISM and IGM intervening gas is out of the scope of this paper, so we will focus only on the properties of the absorbing gas intrinsic to NGC 4593. The regions of interest are those around the position of Ly and the N v, Si iv, and C iv doublets. For each of them the continuum was modeled locally with a power law and with Gaussians for the emission lines. For the characterization of the absorption troughs we first used a kinematic approach using slab, which is model-independent, in a similar manner as described in Sect. 3.1.2. We used one slab component per absorption trough and we left the velocity shift (i.e. outflow velocity ), the rms velocity broadening , the ionic column density of the species under consideration, and the covering factor of the absorber as free parameters in the fit.
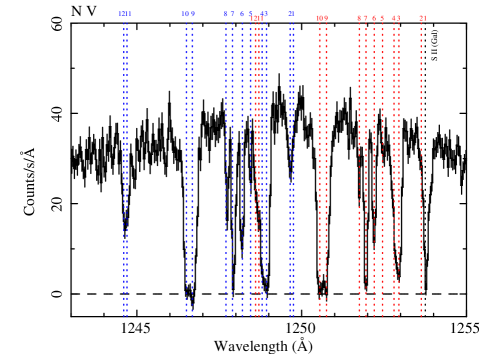
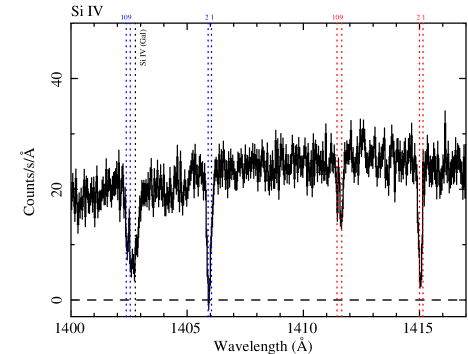
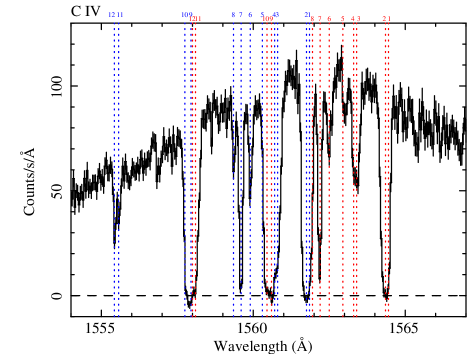
A total of 15 different kinematic components can be identified in the STIS spectrum of NGC 4593. Twelve of these components are found in common in C iv, N v, and Ly , and only four of them are seen in Si iv. In addition to them, three faster components with ranging between and km s-1 are identified only in the Ly region. In what follows kinematic components are numbered by increasing outflow velocity, being component 1 the slowest, and component 15 the fastest. A detailed view of the STIS spectrum in the Ly , N v, Si iv, and C iv regions is shown in Fig. 8, where all the detected kinematic components are labeled together with two foreground absorption features of S ii and Si iv . The different kinematic components are also shown in velocity space in Fig. 9.
From the best-fit results (see Table 8) we can see that the bulk of the ionised gas in the UV is carried by components 1 and 9, as the ionic column densities of C iv reach a maximum in these components, and similarly for N v in components 3 and 7. We note, however, that some of these components are heavily saturated, namely component 1 in C iv and component 9 in both N v and C iv, and hence only lower limits on their ionic column densities can be reliably determined. Likewise, the column density of the Ly absorber is maximal for components 3, 7, and 10, and their values should be considered as lower limits due to the large degree of saturation. The errors on and quoted in Table 8 account for both the statistical and systematic uncertainties333http://www.stsci.edu/hst/stis/performance/spectral_resolution.
After determining the kinematic structure of the UV absorber, we used a more physical model to characterize its ionisation properties. For this purpose we locally fitted the spectrum using xabs components using the best-fit values of , , and obtained with slab as a starting point. We found that the fastest absorption troughs 13 to 15, seen only in the Ly region, are caused by a shallow ( cm-2) neutral absorber ( on average) along our line of sight. The different kinematic components seen in N v, Si iv and C iv are associated to mildly ionised gas ( for components 8 to 12, and for component 1), with the exception of components 3 to 7 which might originate in a somewhat more ionised environment (). The best-fit results are shown in Table 9. In Sect. 4 we discuss these results in more depth, and the possibility that the UV absorber and the low ionisation component seen in X-rays could originate in the same enviroment as they seem to share several physical properties.

| Component | |||||||
|---|---|---|---|---|---|---|---|
| (km s-1) | (km s-1) | (cm-2) | (cm-2) | (cm-2) | (cm-2) | ||
| (1) | (2) | (3) | (4) | (5) | (6) | (7) | (8) |
| 1 | |||||||
| 2 | |||||||
| 3 | |||||||
| 4 | |||||||
| 5 | |||||||
| 6 | |||||||
| 7 | |||||||
| 8 | |||||||
| 9 | |||||||
| 10 | |||||||
| 11 | |||||||
| 12 | |||||||
| 13 | |||||||
| 14 | |||||||
| 15 |
| Component | |||||
|---|---|---|---|---|---|
| (km s-1) | (km s-1) | (erg cm s-1) | (cm-2) | ||
| (1) | (2) | (3) | (4) | (5) | (6) |
| 1 | |||||
| 2 | |||||
| 3 | |||||
| 4 | |||||
| 5 | |||||
| 6 | |||||
| 7 | |||||
| 8 | |||||
| 9 | |||||
| 10 | |||||
| 11 | |||||
| 12 | |||||
| 13 | |||||
| 14 | |||||
| 15 |
4 Discussion
4.1 Comparison with previous X-ray observations
We first compare these results with those of other previous X-ray observations of NGC 4593. The source was observed by XMM-Newton in July 2000 and by Chandra LETGS in February 2001. The analysis of these observations are reported in Steenbrugge et al. (2003). Because of the high radiation background, the XMM-Newton data were severely affected and the RGS spectrum was rather noisy. However, Steenbrugge et al. (2003) were able to derive the ionic column densities of several species present in the spectrum albeit with large uncertainties. Their results are fully in agreement with ours (reported in Table 6) within the error bars. Their analysis of the LETGS data revealed the presence of highly ionised gas () outflowing at km s-1 with a column density of cm-2. Their results are hence consistent with what we found for component in the outflow at the confidence level, although we detect a marginally higher column density for this component. As in our observations, they required an extra component to account for weak absorption lines in the oxygen region resulting in a shallow ( cm-2) lower ionisation gas () outflowing at km s-1. Again, these results are in agreement with those of our lowest ionisation component . The outflow velocities of the components detected by Steenbrugge et al. (2003) are consistent with each other within , similarly to what we find for components to . Their available statistics made them unable to discriminate whether these outflows belonged to a single kinematic component.
The ionised gas in NGC 4593 was also observed with the Chandra High Energy Transmission Gratings (HETGS) in June 2001 (McKernan et al. 2003). Since they cover a higher energy range, a single-zone photoionised absorber suffices to adequately describe the soft X-ray spectrum of NGC 4593. The reported parameters of this gas reported in McKernan et al. (2003) are and cm-2 (for consistency, we have converted their quoted 90% confidence errors to 1). Although the value of the ionisation parameter is in agreement with the one we derive for component in our dataset, they measure a much slower outflow velocity of km s-1 and a column density higher by a factor of 2.
NGC 4593 was observed again by XMM-Newton in June 2002. The results of this observation are reported in Brenneman et al. (2007). They did not use the RGS spectrum (analysed in this paper) and they relied only on the analysis of the EPIC-pn spectrum. Even though the lower spectral resolution of EPIC-pn does not allow to extract information on individual lines, Brenneman et al. (2007) were able to derive the ionisation parameter and column densities of the intervening absorber. Their results depended on the model used to parametrize the soft excess: single temperature bremsstrahlung emission or thermal Comptonization by plasma at a temperature between that of the disc and the hard X-ray corona. In either case they require two ionised absorbers at the redshift of the source to reproduce the observed spectrum. The former yielded two components with and cm-2, and and cm-2, respectively. The latter provides a best fit with and cm-2, and and cm-2, respectively (as above, their quoted 90% errors have been converted into 1 errors for consistency). While these results indicate a somewhat deeper absorber ( higher than ours by a factor of 5 in the first case), their ionisation parameters are generally consistent with those of our components. Therefore, it is clear from this analysis and the previous ones that the WA in NGC 4593 can be successfully described with at least two distinct components, although a more complex structure cannot be ruled out. The kinematic distribution of these components remain, however, somewhat unclear.
4.2 Emission line diagnostics
Some emission features of oxygen, nitrogen, and carbon are seen in the soft X-ray spectra of NGC 4593 in the XMM-Newton and Chandra observations, as reported in Sect. 3.1.1. Lines arising in He-like species like Ne ix, O vii, and N vi are of particular interest. In the case of O vii and N vi only the forbidden () and intercombination () lines of the triplets are significantly detected, while for Ne ix the only significant feature is the line. The lack of a significant detection of resonance () lines together with relatively strong lines may indicate that the dominant ionising process photoionisation (Porquet & Dubau 2000). We note, however, that we are unable to significantly detect any radiative recombination continua (RRC) features in the spectrum, which are typical signatures in photoionised plasmas.
Emission line diagnostics can be used to estimate some of the physical properties of the line emitting gas. The ratio is often used as an estimator of the electron density of the gas. Using the O vii triplet, ratios and are measured in the XMM-Newton and Chandra observations, respectively. This result, taking into account the large uncertainties, points to emission in a gas with density between and cm-3, according to Porquet & Dubau (2000). The N vi emission lines in the LETGS spectrum, detected only at the level, yields , formally an upper limit. The RGS spectrum, however, shows a somewhat contradictory result as the line is much stronger than the line and , thus implying that this emission feature arises in a higher density plasma cm-3. In principle the ratio can also be used to estimate the electron temperature of the gas. However due to the non-detection of the line in neither of the observations and triplets, it is not feasible to derive an accurate ratio for NGC 4593.
The line fluxes of the O vii and N vi and lines decreased between the XMM-Newton and Chandra observations (see Tables 3 and 4). If these changes are caused in response to the variations in the flux of the source, an upper limit to the distance of the emitter can be immediately estimated by means of the light distance traveled. Given the time span between both observations (3147 days at the rest frame of NGC 4593) we derive a distance of pc.
Since the observations were taken more than 8 years apart, this somewhat loose upper limit cannot be further constrained with the available data. The observations taken with Chandra in 2001 and that of XMM-Newton in 2000 (Steenbrugge et al. 2003; McKernan et al. 2003) only report flux line values consistent with those that we find in the RGS spectrum. Alternatively one can also estimate the distance of the emission line clouds to the center if one assumes that the gas dynamics are dominated by the central supermassive black hole (e.g. Koratkar & Gaskell 1991):
| (2) |
where is the mass of the black hole, is the constant of gravity, and is the FWHM is the emission lines. For a mass of (Denney et al. 2006) and measured FWHM of the order of 1 500 3 000 km s-1 for the X-ray emission lines, and 2 500 3 500 km s-1 for the UV emission lines, we obtain pc. This would locate the emission line clouds well within the BLR of NGC 4593, which is estimated to lie between light-days or pc, based on H measurements (Santos-Lleó et al. 1995). Indeed, the estimated high density value cm-3 of the gas points to an origin in the BLR and recalls the cases of Mrk 335 (Longinotti et al. 2008) and Mrk 841 (Longinotti et al. 2010).
4.3 Kinematics of the absorbers
The results obtained in Sect. 3 show a complex multi-component absorption spectrum in NGC 4593. In the X-rays, three kinematic components (see Table 7) are in principle required to obtain a satisfactory fit. In previous X-ray observations (see Sect. 4.1) the only reported outflow velocities for a two-zone photoionised gas revealed values consistent with each other (Steenbrugge et al. 2003). The other papers either report a single velocity scenario or no velocity measurement at all. In all cases, the reported outflow velocity values are consistent with each other and they are of the order of km s-1.
Our slab fits to the X-ray data allowed for a multi-velocity structure for the absorption system, obtaining 3 kinematic components. In Sect. 3.1.2 we showed that there is no difference within the uncertainties between the LETGS and RGS kinematic components. Our photoionisation modeling with xabs also provides a three-velocity structure (, , and km s-1, respectively), which is in agreement within the error bars with those of the slab modeling. The lower ionisation components and share the same outflow velocity at km s-1 which, in turn, differs from that of the intermediate ionisation phase by less than . On the other hand, the higher ionisation phase , for which we obtain a higher velocity with xabs than with slab albeit with much larger error bars, is outflowing significantly faster than the others, a behaviour often observed in the WA of Seyfert galaxies.
In the UV the kinematic structure is much clearer as 15 distinct kinematic components are seen in Ly , N v, Si iv, and C iv with outflow velocities ranging from km s-1 to km s-1. These kinematic components are unambiguously detected in all the ions, except for Si iv which only shows four troughs belonging to components 1, 2, 9, and 10. The fastest components 13 to 15, with outflow velocities ranging from to km s-1 are seen only in Ly . In our UV analysis we also find significant evidence of partial covering in components 3, 5, 6, 10, 11, and 12, a conclusive hallmark of an associated absorber from an outflow, as opposed to a merely intervening cloud.
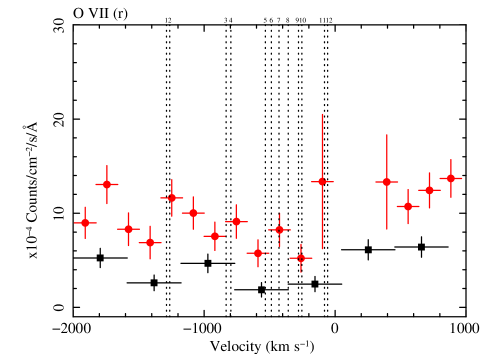
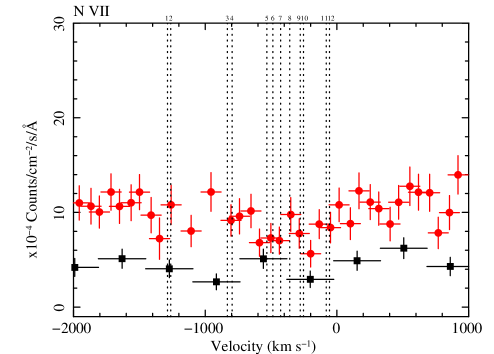
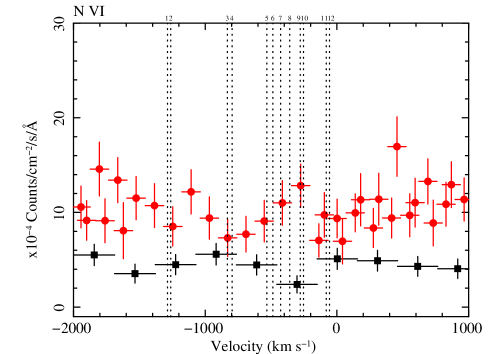
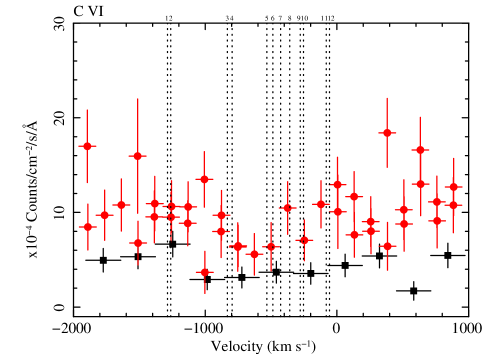
Whether there is a possible kinematic agreement between the X-ray WA and the UV absorber is difficult to determine because the spectral resolution in the X-ray domain is much poorer and therefore a one-to-one identification is not feasible. To illustrate this, we show in Fig. 10 the X-ray spectra with LETGS and RGS in velocity space at the position of different ions, with the measured UV kinematic components overplotted.
However, the velocity range of the UV absorbers is roughly similar to that of the X-ray absorber within the errors (i.e. a few hundreds of km s-1), thus in principle it is reasonable to assume that some of the UV components might have a counterpart detectable in the X-ray domain. For example, components and in the X-rays, which seem to share the same kinematic regime, span a velocity range between and , which would be consistent with UV components 4 and 5. On the other hand, component in X-rays spreads over an uncertinty range of km s-1, which can be kinematically associated to components 6 and/or 7 and, marginally, to component 8 in the UV. Likewise, the fastest X-ray component ranges between and km s-1 and is a good match with UV components 11 and 12, and with component 10 at the 2 confidence level. Nevertheless, the X-ray and UV absorbing gas may arise in very different physical environments, so in order to assess whether there is a physical relation between them other properties need to be further examined.
4.4 Column densities
The total ionic column densities of C iv and N v summed over all the UV kinematic components are of the order of cm-2 and cm-2, respectively. The bulk of the N v ionic column density is carried by component 9 (56%), and the rest is more or less evenly distributed between components 3 (13%), 6 (6%), 7 (10%), and 10 (8%). For C iv, the ionic column densities are distributed between components 1 (70%) and, to a lower extent, component 9 (18%).
A direct comparison between the X-ray and UV observations, or even among the individual UV components seen by STIS is difficult. As noted in Sect. 3.2, some of the UV features show a high level of saturation, namely component 1 in C iv and Ly , component 9 in Ly , N v and C iv, and components 2, 3, 7, 10, and 15 in Ly . In a conservative approach, the column densities reported in Table 8 should therefore be considered as lower limits. Some general considerations can nevertheless be drawn from these results and, in particular, the comparison with the XMM-Newton observation as it was taken quasi-simultaneously with that of STIS. The N v ionic column density measured in the RGS spectrum yields cm-2 which, in spite of the large uncertainties, is broadly consistent with the value measured in the UV. The situation is more complicated for C iv, as this feature arises in a very lowly ionised plasma that produces very little absorption in the X-rays. Therefore, only upper limits on its ionic column density can be derived for this ion cm-2. Since the measured in the UV does not exceed this value, it can be assumed that there is formally no discrepancy between these results.
The similar outflow velocities and ionic column densities may indicate that the X-ray and UV absorbers originate in the same intervening gas. However, this is at odds with the different ionisation structure depicted by the photoionisation analysis. The ionisation parameter measured in the X-ray WA increases with increasing outflow velocity, while the general trend in the UV is the opposite, with decreasing as the velocity increases (see Table 9). Interestingly, this behaviour is also seen in other Seyfert galaxies such as Mrk 509. For this source Detmers et al. (2011) find 5 distinct ionisation phases with increasing and outflow velocity, whereas the photoionisation analysis of Arav et al. (2012), using HST-COS and STIS data, find lower values of the ionisation parameter for the faster troughs.
4.5 Stability curve
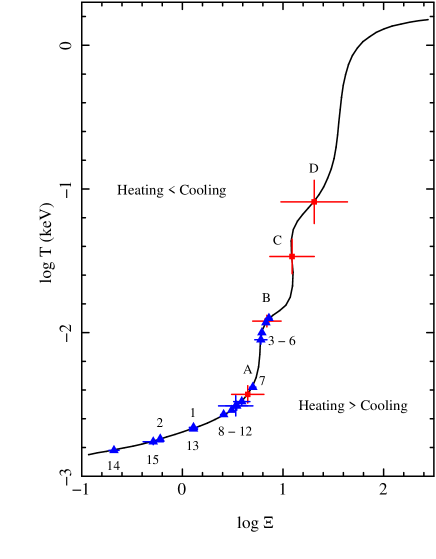
To further investigate the structure of the X-ray and UV absorbers in NGC 4593 we plot the pressure ionisation parameter as a function of the electron temperature . The pressure ionisation parameter is defined as , where is the speed of light, is the constant of Boltzmann, and is the electron temperature. The different values of are computed using CLOUDY, which provided a grid of ionisation parameters and the corresponding electron temperature for a thin layer of gas illuminated by the ionising continuum. The curve thus generated divides the plane in two regions. Below the curve heating dominates cooling, while above the curve cooling dominates heating (e.g. Krolik et al. 1981). The parts of the curve where (i.e. where the curve turns backwards) are unstable against isobaric thermal perturbations (vertical displacements from the curve). The parts of the curve with positive derivative define stable regions. Components sharing the same value on this thermal stability curve are nominally in pressure equilibrium with each other and therefore would likely be part of the same long-lived structure.
In Fig. 11 we show the thermal stability curve of NGC 4593, with the different X-ray WA and UV absorber components overplotted. The thermal stability curve was generated using the SED at the epoch of the quasi-simultaneous observations of XMM-Newton and STIS. Overplotted on the curve are the different phases of the X-ray WA (squares) and UV absorbers (triangles). It can be seen that the X-ray WA components and both fall in stable areas of the curve, as well as the higher ionisation component . Component , on the other hand, seems to fall in an unstable branch of the curve. Although WA phases typically fall in stable areas (e.g. Mrk 279, Ebrero et al. 2010), components lying in unstable branches are not uncommon. For example, one of the high-ionisation phases of the WA in Mrk 509 shows this behaviour (Detmers et al. 2011), and similarly in NGC 5548 (Andrade-Velázquez et al. 2010; Seta et al., in preparation). In general, the majority of WA components are located in thermally stable areas, which would suggest that those components lying in unstable regions would relocate to stable regions on time scales typically short compared to the AGN lifetime.
The UV components are spread over the stable branch of the stability curve. Interestingly, a number of these components tend to cluster around the position of the lower ionistion WA, namely components 7 to 12 around the WA and components 3 to 6 around the WA . Since they approximately share the same within the error bars, they are therefore in pressure equilibrium which may indicate that they form part of the same long-lived structure. From this point of view, it is reasonable to assume that the low ionisation WA likely originates in the same intervening gas as the UV absorbers, in particular for the case of the X-ray absorber . The outflow velocity of this WA phase is consistent with those of the UV components 3 to 6, so they would be co-located assuming Keplerian motion. However, in the case of the X-ray absorber , there are kinematic discrepancies that are difficult to reconcile with this scenario as the UV components are outflowing significantly faster.
4.6 Origin of the absorbers
The location of the X-ray and UV absorbers is difficult to estimate. While in principle one could use the definition of the ionisation parameter in Eq. 1 to deduce the distance of the gas to the ionising source , in practice the product is degenerate. Ideally, variability between observations can be used to determine the density and therefore put constraints on the distance (e.g. Krolik & Kriss 1995).
Unfortunately, the distance of the X-ray WA cannot be constrained in this way. For instance, the X-ray WA measured by Steenbrugge et al. (2003) and in the RGS spectrum in this work has the same best-fit parameters as in our LETGS results within the error bars, even though a change in flux of 40% had occured between these observations. Moreover, the column densities of the most relevant ions remained fully consistent within the uncertainties thus preventing us from estimating the distance on grounds of variability. In this respect, because of the lack of monitoring of the WA in NGC 4593 in the last decade, it is difficult to tell whether such changes in the ionising flux happened shortly before our LETGS observation and therefore the gas did not have time to reach the equilibrium again.
There is the possibility to estimate the location of the absorbing gas by other means. For example, Blustin et al. (2005) used dynamical and momentum conservation arguments to derive an expression that provides an upper limit to the distance. While in principle such an argument can be valid for radiation-driven winds, there is mounting evidence that other mechanisms (e.. shocks, thermal instabilities, magnetic fields) could be involved in the wind launching. In this respect, Fukumura et al. (2010) studied self-similar solutions for magnetohydrodynamic (MHD) winds in accretion discs, finding that they provide a good match with the observed properties of ionised winds in Seyfert galaxies.
We can derive some rough upper limits on the location of the different components of the ionised winds in NGC 4593 following a very conservative approach. The main assumption is that most of the mass in the WA is concentrated in a layer with thickness which is less than or equal to the distance to the central ionising source so that: . The column density along our line of sight can be approximated to . Combining these conditions with the definition of the ionisation parameter given in Eq. 1, we are left with
| (3) |
For an ionising luminosity of erg s-1 at the epoch of the XMM-Newton and STIS observations, we find that the lower ionisation components and are located within kpc and pc, respectively, from the central engine. The location of the WA component is more constrained within pc. For the highest ionisation component , given the uncertainty in the determination of its column density, we obtain an upper limit to the distance ranging between and pc. Following the same reasoning the UV absorbers are located at kpc distances.
Although these limits are rather loose, they clearly indicate that our line of sight is crossing several clouds of gas located at different distances from the central engine, with decreasing ionisation state as the distance increases. This scenario is sketched by Kazanas et al. (2012) in their Fig. 8, where a line of sight at a given inclination angle intersects different parts of a stratified wind, each with different , column density and velocity. While it is still possible that some of the UV features originate in the same gas that causes the low-ionisation X-ray absorption, the model depicted by Kazanas et al. (2012) suggest that the variety of ionisation phases seen in the gas belong to different strata originally launched from different parts of the disc.
4.7 Energetics and feedback implications
We can estimate how much mass is carried out of the central regions of NGC 4593 by the outflows and assess whether it may have any impact on the surrounding ISM of the host galaxy. If the outflow is in the form of a partial thin spherical shell at a distance from the central source moving radially at constant speed , the mass outflow rate is given by
| (4) |
where is the mean atomic mass per proton, is the proton mass, and is the solid angle subtended by the outflow (between 0 and sr). The main source of uncertainty in the determination of the mass outflow rate is introduced by the parameter , which is typically assumed to be sr, inferred from the observed type-1/type2 ratio in nearby Seyfert galaxies (Maiolino & Rieke 1995) and the fact that ionised outflows are seen in approximately half of the observed Seyfert 1 galaxies (Dunn et al. 2007). We note that this value may not hold if the outflows are bent because of gravitational and/or magnetic processes.
In this way we obtain yr-1, yr-1, yr-1, and yr-1 for the WA components to , respectively. We expressed these mass outflow rates as a function of in order to reflect the uncertainty associated to this parameter.
For comparison, the mass accretion rate is obtained from the bolometric luminosity using
| (5) |
The bolometric luminosities of NGC 4593 derived from the SED is erg s-1, and erg s-1 for the LETGS and RGS observations, respectively. Assuming a nominal accretion efficiency of , the mass accretion rate results in yr-1, and yr-1, respectively. One can see that the accretion rate at the epoch of the RGS observation almost doubled that of the LETGS observation, assuming that the accretion efficiency remained the same. The total mass outflow rate of the X-ray WA is therefore higher than the mass accretion rate, as often seen in other sources (e.g. Costantini 2010; Crenshaw & Kraemer 2012). As an example, assuming that the absorbers subtend a solid angle sr, the mass outflow rates of the X-ray components would be yr-1, yr-1, yr-1, and yr-1.
The lowest ionisation component is located at kpc distances from the central source. Therefore, this outflow likely originated in an earlier episode of activity of NGC 4593 (e.g. King et al. 2011) and it is unrelated to the current AGN emission detected in these observations. In a conservative approach, we will not consider this component in the next energetics estimations. Thus, the total mass outflow rate summed over the remaining components is yr-1, between and times the mass accretion rate at the epoch of the RGS and LETGS observations.
The total kinetic energy per unit time carried by the outflow is the sum of the kinetic luminosity injected into the medium by the different components, and is defined as . Excluding component , we find it to be erg s-1, expressed as a function of . The total kinetic energy injected in the medium represents a small fraction of the bolometric luminosity of the source: %, for erg s-1. For a typical value sr, we thus obtain %. These values are in agreement with those estimated for other nearby Seyfert galaxies reported in Crenshaw & Kraemer (2012).
Overall, the outflows in NGC 4593 seem to be too weak to produce a significant impact in the surrounding ISM. Many AGN feedback models require that a significant fraction of the AGN radiative output (5%) has to be fed back in the form of kinetic and internal motion energy in outflows in order to reproduce the observed relation (e.g. Silk & Rees 1998; Wyithe & Loeb 2003), at least one order of magnitude above the values we measure for NGC 4593.
However, if we consider that the measured kinetic luminosity is injected into the ISM at this rate throughout the whole AGN lifetime, which can be up to yr (Gilli et al. 2009; Ebrero et al. 2009), the total kinetic energy fed back to the medium would be erg. This value is roughly consistent with the energy required to disrupt the ISM of a typical galaxy, which is estimated to be erg (Krongold et al. 2010). A more conservative approach may consider that the expansion of the outflowing gas, with a corresponding decrease in density as it dilutes in the ISM, could increase the cross-section of the material thus favouring the momentum coupling from absorption of the ionising flux. In this case the required feedback to alter the ISM and supress star formation in the host galaxy might be reduced by about one order of magnitude to % of the luminosity (Hopkins & Elvis 2010). While our estimated kinetic luminosity is still lower than this value, it is therefore very unlikely that the outflows seen in NGC 4593 can significantly affect the medium of the host galaxy in a single AGN episode. However, if we integrate these contributions over the entire lifetime of the AGN, it results that the outflows (even for a low luminosity AGN hosting a relatively small SMBH like NGC 4593) may have a small (but not negligible) influence on the surroundings of the host galaxy.
5 Conclusions
We have analysed the soft X-ray and UV spectra of the Seyfert 1 galaxy NGC 4593 obtained with Chandra-LETGS, XMM-Newton RGS, and HST/STIS, respectively. In the X-rays there is significant evidence of a multi-phase WA with four distinct degrees of ionisation: , , , and , respectively. These components are outflowing, being the low-ionisation components and slower ( km s-1) than the high-ionisation components ( km s-1), and ( km s-1).
In the UV, we detected a wealth of absorption troughs in the Ly , N v, Si iv, and C iv regions. These UV absorbers are also blueshifted with respect to the systemic velocity of the source and therefore are also outflowing. They can be attributed to 15 distinct kinematic components ranging between km s-1 and km s-1. Attending to the ionisation state of the gas, UV components 7 to 12 might be the counterparts of the low-ionisation phase , whereas components 3 to 6 show similar values as component . Components and are probably too ionised to produce any significant absorption in the UV. Furthermore, the X-ray low-ionisation WA is in pressure equilibrium with the UV absorber thus indicating that they may form part of the same long-lived structure. The predicted N v and C iv (only upper limits in this case) column densities from the X-rays are consistent with those measured in the UV. There are, however, kinematic discrepancies that may prevent both absorbers from originating in the same intervening gas.
We put some constraints on the location of the WA assuming that its mass is concentrated in a layer with thickness lower than or equal to the distance to central source. We derive an upper limit for the distance of high-ionisation phases to the central ionising source of pc, while the low-ionisation phases are located at hundreds of pc. This is consistent with a scenario in which our line of sight intersects several parts of a stratified wind, each with different ionisation state, density, and velocity, as sketched in Kazanas et al. (2012).
The total kinetic luminosity of the outflows injected into the ISM of NGC 4593 represents only a tiny fraction of the bolometric luminosity, %, where is the solid angle subtended by the outflow. This is too low to produce any significant impact in the medium of the host galaxy on a single episode of activity, but it may produce small (but not negligible) effects when integrated over the whole AGN lifetime.
Acknowledgments
SRON is supported financially by NWO, the Netherlands Organisation for Scientific Research. This work is based on observations obtained with XMM-Newton, an ESA science mission with instruments and contributions directly funded by ESA Member States and NASA. The scientific results reported in this article are based on observations made by the Chandra X-ray Observatory. Some of the data presented in this paper were obtained from the Mikulski Archive for Space Telescopes (MAST). STScI is operated by the Association of Universities for Research in Astronomy, Inc., under NASA contract NAS5-26555. We thank the anonymous referee for his/her comments.
References
- Aloisi et al. (2007) Aloisi A., Bohlin R., Quijano J.K., 2007, New On-Orbit Sensitivity Calibration for All STIS Echelle Modes, Tech. Rep. Instrument Science Report STIS 2007-01, STScI, Baltimore
- Andrade-Velázquez et al. (2010) Andrade-Velázquez M., Krongold Y., Elvis M., Nicastro F., Brickhouse N., Binette L., Mathur S., Jiménez-Bailón E., 2010, ApJ, 711, 888
- Arav et al. (2012) Arav N., Edmonds D., Borguet B., Kriss G.A., Kaastra J.S., Behar E., Bianchi S., Cappi M., Costantini E., Detmers R.G., Ebrero J., Mehdipour M., Paltani S., Petrucci P.O., Pinto C., Ponti G., Steenbrugge K.C., de Vries C.P., 2012, A&A, 544, A33
- Blustin et al. (2005) Blustin A.J., Page M.J., Fuerst S.V., Branduardi-Raymont G., Ashton C.E., 2005, A&A, 431, 111
- Brenneman et al. (2007) Brenneman L.W., Reynolds C.S., Wilms J., Kaiser M.E., 2007, ApJ, 666, 817
- Brinkman et al. (2000) Brinkman A.C, Gunsing C.J.T., Kaastra J.S., van der Meer R.J.L., Mewe R., Paerels F.B., Raassen A.J.J., van Rooijen J., Braeuniger H.W., Burwitz V., Hartner G.D., Kettenring G., Predehl P., Drake J.J., Johnson C.O., Kenter A.T., Kraft R.P., Murray S.S., Ratzlaff P.W., Wargelin B.J., 2000, Proc. SPIE Vol. 4012, p. 81-90, X-ray Optics, Instruments and Missions III, Joachim E. Truemper; Bernd Aschenbach; Eds.
- Cash (1979) Cash W., 1979, ApJ, 228, 939
- Costantini (2010) Costantini E., 2010, Space Sci. Rev., 157, 265
- Crenshaw et al. (1999) Crenshaw D.M., Kraemer S.B., Boggess A., Maran S.P., Mushotzky R.F., Wu C.C., 1999, ApJ, 516, 750
- Crenshaw, Kraemer & George (2003) Crenshaw D.M., Kraemer S.B., George I.M., 2003, ARA&A, 41, 117
- Crenshaw & Kraemer (2012) Crenshaw D.M., Kraemer S.B., 2012, ApJ, 753, 75
- Denney et al. (2006) Denney K.D., Bentz M.C., Peterson B.M., Pogge R.W., Cackett E.M., Dietrich M., Fogel J.K.J., Ghosh H., Horne K.D., Kuehn C., Minezaki T., Onken C.A., Pronik V.I., Richstone D.O., Sergeev S.G., Vestergaard M., Walker M.G., Yoshii Y., 2006, ApJ, 653, 152
- den Herder et al. (2001) den Herder J.W., Brinkman A.C., Kahn S.M., Branduardi-Raymont G., Thomsen K., Aarts H., Audard M., Bixler J.V., den Boggende A.J., Cottam J., et al., 2001, A&A, 365, 7
- Detmers et al. (2011) Detmers R.G., Kaastra J.S., Steenbrugge K.C., Ebrero J., Kriss G.A., Arav N., Behar E., Costantini E., Branduardi-Raymont G., Mehdipour M., Bianchi S., Cappi, M., Petrucci P.O., Ponti G., Pinto C., Ratti E.M., Holczer T., 2011, A&A, 534, A38
- Dickey & Lockman (1990) Dickey J.M., Lockman F.J., 1990, ARA&A, 28, 215
- Di Matteo, Springel & Hernquist (2005) Di Matteo T., Springel V., Hernquist L., 2005, Nature, 433, 604
- Dunn et al. (2006) Dunn J.P., Jackson B., Deo R.P., Farrington C., Das V., Crenshaw D.M., 2006, PASP, 118, 572
- Dunn et al. (2007) Dunn J.P., Crenshaw D.M., Kraemer S.B., Gabel J.R., 2007, AJ, 134, 1061
- Dunn et al. (2010) Dunn J.P., Bautista M., Arav N., Moe M., Korista K.T., Costantini E., Benn C., Ellison S., Edmonds D., 2010, ApJ, 709, 611
- Ebrero et al. (2009) Ebrero J., Mateos S., Stewart G.C., Carrera F.J., Watson M.G., 2009, A&A, 500, 749
- Ebrero et al. (2010) Ebrero J., Costantini E., Kaastra J.S., Detmers R.G., Arav N., Kriss G.A., Korista K.T., Steenbrugge K.C., 2010, A&A, 520, A36
- Elvis (2000) Elvis M., 2000, ApJ, 545, 63
- Ferland et al. (1998) Ferland G.J., Korista K.T., Verner D.A., Ferguson J.W., Kingdon J.B., Verner E.M., 1998, PASP, 110, 761
- Ferrarese & Merritt (2000) Ferrarese L., Merritt D., 2000, ApJ, 539, 9
- Fukumura et al. (2010) Fukumura K., Kazanas D., Contopoulos I., Behar E., 2010, ApJ, 715, 636
- Gebhardt et al. (2000) Gebhardt K., Bender R., Bower G., Dressler A., Faber S.M., Filippenko A.V., Green R., Grillmair C., Ho L.C., Kormendy J., Lauer T.R., Magorrian J., Pinkney J., Richstone D., Tremaine S., 2000, ApJ, 539, 13
- George et al. (1998) George I.M., Turner T.J., Netzer H., Nandra K., Mushotzky R.F., Yaqoob T., 1998, ApJS, 114, 73
- Gilli et al. (2009) Gilli R., Zamorani G., Miyaji T., Silverman J.D., Brusa M., Mainieri V., Cappelluti N., Daddi E., Porciani C., Pozzetti L., et al., 2009, A&A, 494, 33
- Granato et al. (2004) Granato G.L., De Zotti G., Silva L., Bressan A., Danese L., 2004, ApJ, 600, 580
- Hopkins & Elvis (2010) Hopkins P.F., Elvis M., 2010, MNRAS, 401, 7
- Kaastra & Barr (1989) Kaastra J.S., Barr P., 1989, A&A, 226, 59
- Kaastra et al. (1996) Kaastra J.S., Mewe R., Nieuwenhuijzen H., 1996, 11th Colloquium on UV and X-ray Spectroscopy of Astrophysical and Laboratory Plasmas, p. 411-414
- Kaastra et al. (2000) Kaastra J.S., Mewe R., Liedahl D.A., Komossa S., Brinkman A.C., 2000, A&A, 354, 83
- Kaastra et al. (2002) Kaastra J.S., Steenbrugge K.C., Raassen A.J.J., van der Meer R.J.L., Brinkman A.C., Liedahl D.A., Behar E., de Rosa A., 2002, A&A, 386, 427
- Kaspi et al. (2001) Kaspi S., Brandt W.N., Netzer H., George I.M., Chartas G., Behar E., Sambruna R.M., Garmire G.P., Nousek J.A., 2001, ApJ, 554, 216
- Kazanas et al. (2012) Kazanas D., Fukumura K., Behar E., Contopoulos I., Shrader C., 2012, Astron. Rev., 7, 92
- King et al. (2011) King A.R., Zubovas K., Power C., 2011, MNRAS, 415, 6
- Koratkar & Gaskell (1991) Koratkar A., Gaskell C.M., 1991, ApJL, 370, L61
- Kriss (2002) Kriss G.A., 2002, Mass Outflows in Active Galactic Nuclei: New Perspectives, ASP Conference Proceedings, 255, 69
- Krolik et al. (1981) Krolik J.H., McKee C.F., Tarter C.B., 1981, ApJ, 249, 422
- Krolik & Kriss (1995) Krolik J.H., Kriss G.A, 1995, ApJ, 447, 512
- Krolik & Kriss (2001) Krolik J.H., Kriss G.A, 2001, ApJ, 561, 684
- Krongold et al. (2010) Krongold Y., Elvis M., Andrade-Velázquez M., Nicastro F., Mathur S., Reeves J.N., Brickhouse N.S., Binette L., Jiménez-Bailón E., Grupe D., Liu Y., McHardy I.M., Minezaki T., Yoshii Y., Wilkes B., 2010, ApJ, 710, 360
- Lodders & Palme (2009) Lodders K., Palme H., 2009, Meteoritics and Planetary Science Supplement, 72, 5154
- Longinotti et al. (2008) Longinotti A.L., Nucita A., Santos-Lleó M., Guainazzi M., 2008, A&A, 484, 311
- Longinotti et al. (2010) Longinotti A.L., Costantini E., Petrucci P.O., Boisson C., Mouchet M., Santos-Lleo M, Matt G., Ponti G., Gonçalves A.C., 2010, A&A, 510, 92
- Maiolino & Rieke (1995) Maiolino R., Rieke G.H., 1995, ApJ, 454, 95
- Markovitz & Reeves (2009) Markovitz A.G., Reeves J.N., 2009, ApJ, 705, 496
- McKernan et al. (2003) McKernan B., Yaqoob T., George I.M., Turner T.J., 2003, ApJ, 593, 142
- Murray & Chiang (1995) Murray N., Chiang J., 1995, ApJ, 454, 105
- Porquet & Dubau (2000) Porquet D., Dubau J., 2000, A&AS, 143, 495
- Rees (1984) Rees M.J., 1984, ARA&A, 22, 471
- Reynolds (1997) Reynolds C.S., 1997, MNRAS, 286, 513
- Santos-Lleó et al. (1995) Santos-Lleó M., Clavel J., Barr P., Glass I.S., Pelat D., Peterson B.M., Reichert G., 1995, MNRAS, 274, 1
- Scannapieco & Oh (2004) Scannapieco E., Oh S.P., 2004, ApJ, 608, 62
- Silk & Rees (1998) Silk J., Rees M., 1998, A&A, 331, L1
- Steenbrugge et al. (2003) Steenbrugge K.C., Kaastra J.S., Blustin A.J., Branduardi-Raymont G., Sako M., Behar E., Kahn S.M., Paerels F.B.S., Walter R., 2003, A&A, 408, 921
- Strauss et al. (1992) Strauss M.A., Huchra J.P., Davis M., Yahil A., Fisher K.B., Tonry J., 1992, ApJS, 83, 29
- Valenti et al. (2002) Valenti J.A., Lindler D., Bowers C., Busko I, Quijano J.K., 2002, 2-D Algorithm for Removing Scattered Light from STIS Echelle Data, Tech. Rep. Instrument Science Report STIS 2002-001, STScI, Baltimore
- Wyithe & Loeb (2003) Wyithe J.S.B., Loeb A., 2003, ApJ, 595, 614