Can the 62 day X-ray period of the Ultraluminous X-ray source M82 X-1
be due to a precessing accretion disk?
Abstract
We have analyzed all archival RXTE/PCA monitoring observations of the ultraluminous X-ray source (ULX) M82 X-1 in order to study the properties of its 62 day X-ray period (Kaaret & Feng 2007). Based on its high coherence it has been argued that the observed period is the orbital period of the binary. Utilizing a much longer data set than in previous studies we find: (1) The phase-resolved X-ray (3-15 keV) spectra – modeled with a thermal accretion disk and a power-law – suggest that the accretion disk’s contribution to the total flux is strongly modulated with phase. (2) Suggestive evidence for a sudden phase shift–of approximately 0.4 in phase (25 days)–between the first and the second halves of the light curve separated by roughly 1000 days. If confirmed, the implied timescale to change the period is 10 yrs, which is exceptionally fast for an orbital phenomenon. These two independent pieces of evidence are consistent with the periodicity being due to a precessing accretion disk, similar to the super-orbital periods observed in systems like Her X-1, LMC X-4, and SS433. However, the timing evidence for a change in the period needs to be confirmed with additional observations. This should be possible with further monitoring of M82 with instruments such as the Swift X-ray telescope (XRT).
Subject headings:
X-rays: individual (M82 X-1) — X-rays: binaries — black hole physics — methods: data analysis1. Introduction
Ultraluminous X-ray sources (ULXs) are bright, point-like X-ray sources in nearby galaxies with apparent luminosities in the range of a few1039-41 ergs s-1 (Fabbiano 1989; Swartz et al. 2011). They are mysterious in the sense that their energy output exceeds the Eddington limit for stellar-mass black holes (mass range of 3-20 M⊙) (see review by Miller & Colbert 2004). They could be stellar-mass black holes undergoing super-Eddington accretion and/or emission (King et al. 2001; Begelman 2002; Körding et al. 2002; Gladstone et al. 2009) or the missing class of intermediate-mass black holes (mass range: few(100-1000) M⊙) accreting at sub-Eddington rates (Colbert & Mushotzky 1999).
With a maximum X-ray luminosity of approximately 1041 ergs s-1 (Kaaret et al. 2009) M82 X-1 is a remarkably bright ULX. Its average X-ray luminosity of roughly 51040 ergs s-1 combined with quasi-periodic oscillations (QPOs) in the frequency range of 0.04-0.2 Hz suggests that it may contain an intermediate-mass black hole of roughly 100-1000 M⊙ (Strohmayer & Mushotzky 2003; Hopman et al. 2004; Portegies Zwart et al. 2005; Dewangan et al. 2006; Mucciarelli et al. 2006; Pasham & Strohmayer 2013). Another intriguing property is that its X-ray intensity varies regularly with a period of 62 days (Kaaret et al. 2006; Kaaret & Feng 2007, KF07 hereafter). Such long, periodic X-ray modulations have been seen from two other ULXs, NGC 5408 X-1 (115 days and 243 days: Strohmayer 2009; Han et al. 2012; Pasham & Strohmayer 2013) and HLX ESO 243-39 (375 days: e.g., Servillat et al. 2011). The 62 day period of M82 X-1 has been claimed to be the orbital period of the black hole binary system (KF07). Here, we study the properties of this period using new data and present evidence that this modulation may instead be due to the precessing accretion disk of the black hole.
2. Data Primer
The data used herein was obtained with the Rossi X-ray Timing Explorer’s (RXTE’s) proportional counter array (PCA) operating in the GoodXenon data acquisition mode. We used data from the monitoring program beginning 2004 September 2 until 2009 December 30 (1945 days), during which M82 was observed roughly once every three days (2-3 ks per observation).
We used data from all active proportional counter units (PCUs). For faint sources (net count rates 20 counts sec-1) like M82, the PCA data analysis guide provided by RXTE’s Guest Observer Facility (GOF, http://heasarc.nasa.gov/docs/xte/recipes/layers.html) suggests using only the top Xenon layer to maximize the signal to noise ratio. Therefore, we screened our data to include only events from the top layer (layer-1) with both anode chains (Left and Right). In addition, we imposed the following standard filter on the data: ELV 10.0 && OFFSET 0.02 && (TIME_SINCE_SAA 0 TIME_SINCE_SAA 30) && ELECTRON2 0.1. Finally, we used the latest SAA history and background model files for our analysis.
The PCA observations were divided amongst six proposals (RXTE proposal IDs: P20303, P90121, P90171, P92098, P93123, P94123). We used the rex script provided by RXTE’s GOF to extract individual light curves and energy spectra of the source as well as the background. In addition to the filters described above we only used data from channels 0-35 which translates to X-ray events in the energy range 3-15 keV.
3. Results
3.1. Timing Analysis
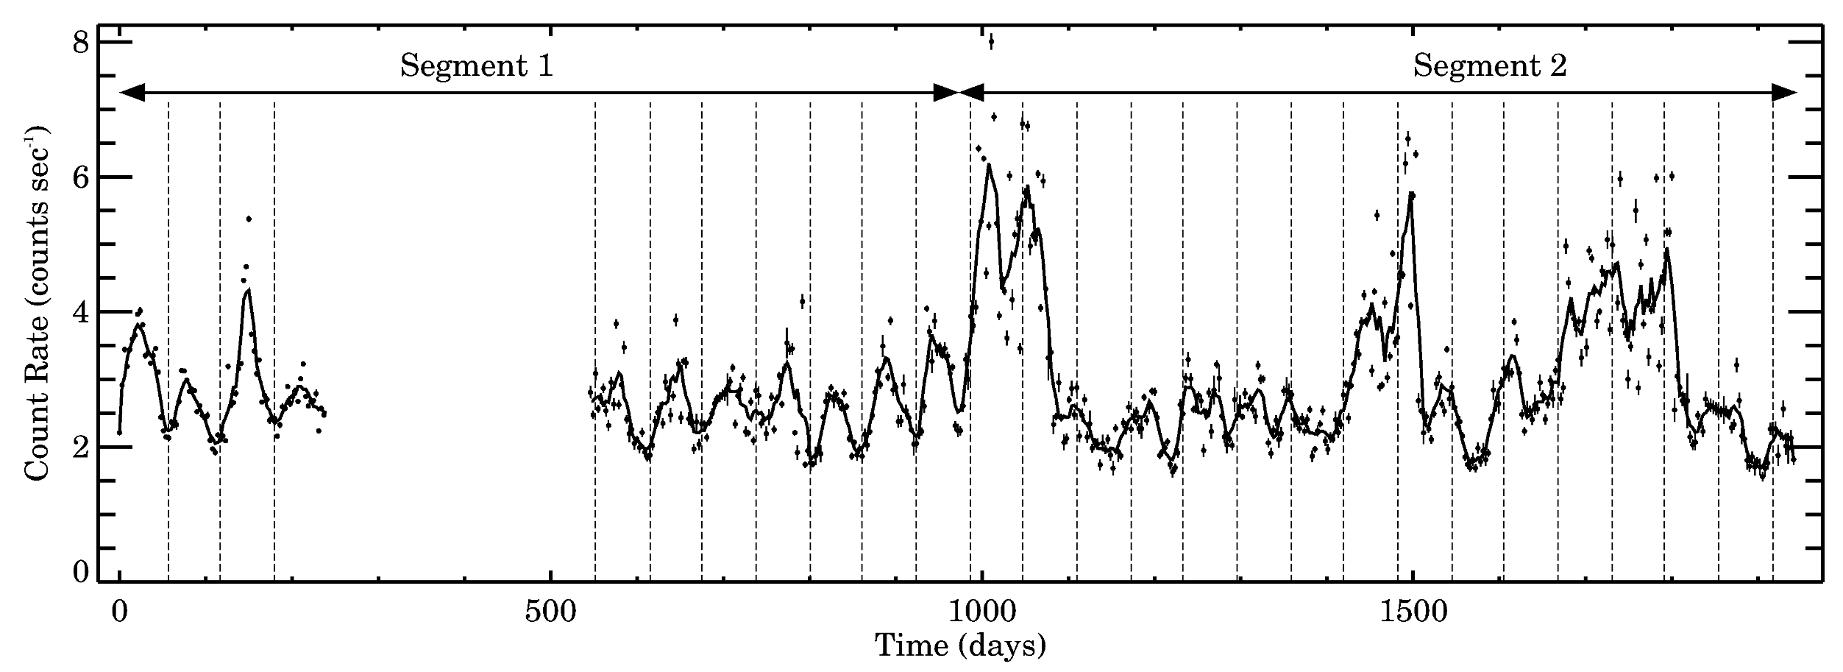
From each individual observation we extracted an average111The mean was taken over all active PCUs using PCU normalizations given by the RXTE data analysis guide: http://heasarc.nasa.gov/docs/xte/recipes/pcu_combine.html., background-subtracted, count rate. This resulted in a total of 810 measurements distributed over 1945 days. The complete RXTE/PCA 3-15 keV light curve of M82 is shown in Figure 1. While the earlier work by KF07 used only the data from day 0 until roughly day 900, i.e., essentially segment 1 of Figure 1, this work includes the entire RXTE/PCA monitoring data of M82.
As an initial test for the stability of the period, we over-plotted vertical lines uniformly separated by 62 days222The best-fit period reported by KF07 was 620.3 days. and coincident with the expected minima of the light curve assuming this period is constant (dashed vertical lines in Figure 1). It is clear even by eye that while the vertical lines are coincident with the light curve’s minima until the large flare occurring around day 1000, they are offset thereafter. The location of the minima were estimated as follows. We folded the first four cycles of the data at a period of 62 days, i.e., data from day 0 - day 240. We then fit this folded light curve with a model that includes two Fourier components (the fundamental and first harmonic), i.e., I = A + Bsin2(-) + Csin4(-). The folded light curve (solid points) along with the best-fit function (solid curve) is shown in the left panel of Figure 2. The best-fit model parameters are A = 2.740.01, B = 0.380.01, =1.140.01, C = 0.120.01, = 1.040.01 while the best-fit value was 1.4 for 1 degree of freedom. If the 62 day modulation were constant throughout the monitoring program then the minima of the best-fit model should track the light curve’s minima.
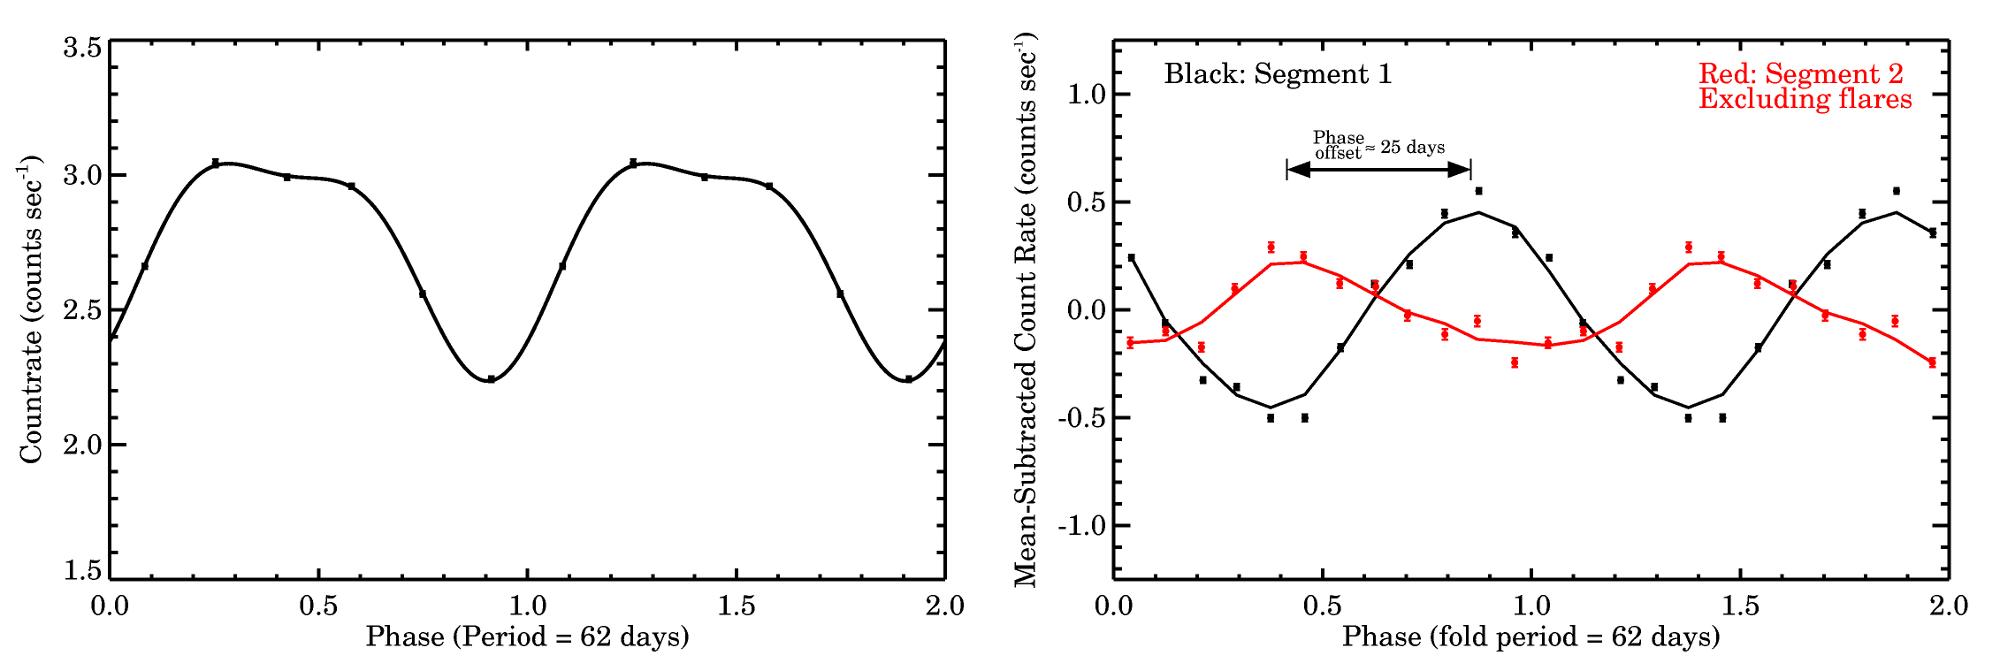
Another way to assess this phase change is to separately fold the segments of the light curve before and after the first large flare (segment 1 and 2 as indicated in Figure 1), at the period of 62 days. Therefore, we divided the complete light curve into two segments: 1) prior to the large flare and 2) after the large flare excluding the data during flares. For the first segment we used data from day 0 to day 976 where day 976 represents roughly the epoch of the onset of the flare (see Figure 1). For the second segment we used all the data from day 976 until the end of the light curve except for the flares. We then transformed the two segments of the light curve to have the same start time. This is essential as a phase difference between the start times of the two segments can manifest as an offset between their folded light curves. We then folded the two segments separately at a period of 62 days333Note that we have constructed a Lomb-Scargle periodogram (Scargle 1982; Horne & Baliunas 1986) of segment 2 and find evidence – although weaker compared to segment 1 – for a power spectral peak that is consistent with a period of 62 days. as found in the earlier work by KF07. The two folded light curves (offset to have zero mean) are shown in the right panel of Figure 2. Clearly there is a significant phase offset of roughly 0.4 cycles – equivalent to 0.462 days 25 days – between the two portions of the light curve.
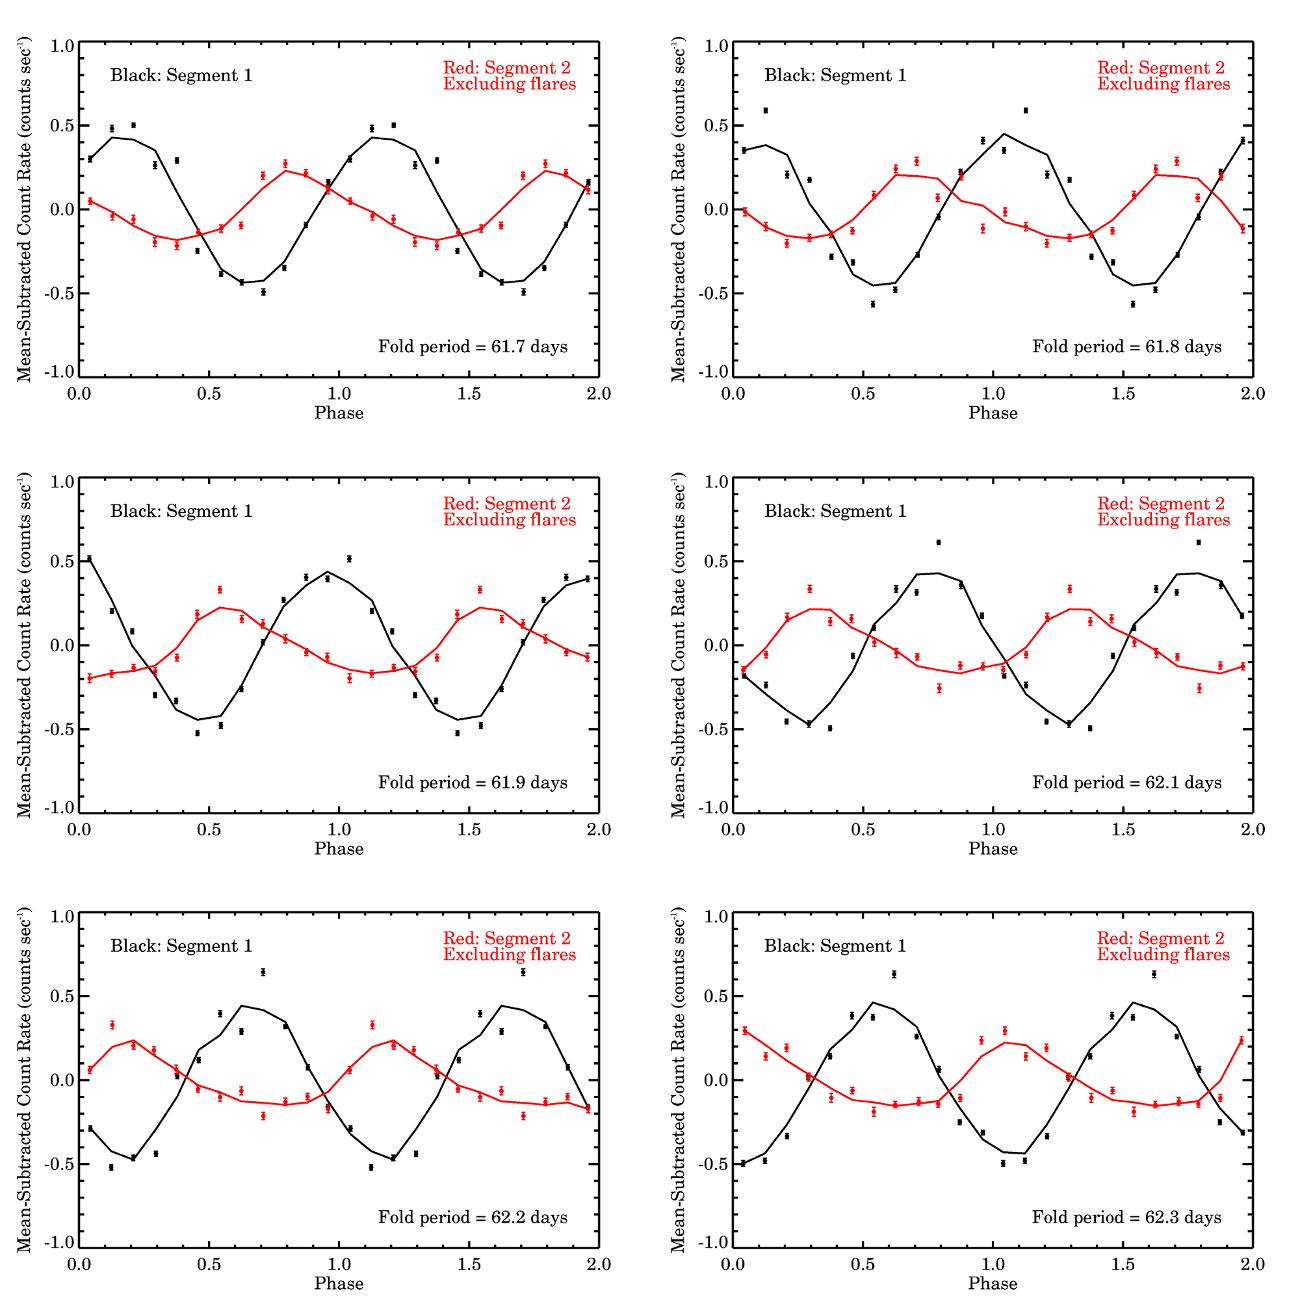
It is possible that this phase difference is due to an incorrect choice of the fold period. Considering the uncertainty in the period reported by KF07, the actual value of the period can be in the range ( confidence) days. Therefore, we repeated the analysis using various fold periods between 61.7 and 62.3 days. We find that the lag is significant in all the cases with the lag varying from roughly 20 to 30 days (see Figure 3). However, if we relax the confidence interval on the best-fit period, we find that one can obtain essentially zero lag between the two segments with a fold period of 60.6 days. We note that this value is 4.7 times the quoted uncertainty, that is, , away from the best-fit period of 62 days. Since a confidence region is (assuming gaussian statistics) from the best value, then one has to go from the best period (62 days) in order to cancel the inferred lag. This supports the presence of a real phase shift, but due to the relatively modest number of overall cycles present in the data, a confirmation of a varying period would still be important.
4. Energy Spectral Analysis
For the purposes of extracting phase-resolved energy spectra we used only data from day zero until prior to the first large flare around day 1000, i.e., segment 1 of Figure 1. We made this choice for the following reasons: (1) the 62 day modulation is highly coherent during this portion of the data and (2) the flaring in the second segment likely introduces additional state-related spectral variations (Feng & Kaaret 2010) which could mask any purely phase-related changes.
We then extracted the energy spectra of the source and background from each observation in segment 1. Using the tool pcarsp we created responses separately for each observation. If multiple PCUs were active in any given observation, we first obtained the source, the background spectra and the responses from individual PCUs and then combined them to have a single source spectrum, a background spectrum and a response (the individual PCU responses were weighted according to the background-subtracted source counts) per observation. We then divided these observations into six equal-sized phase bins of size 1/6 using a period of 62 days. Using the FTOOL sumpha we combined all the source and the background energy spectra in a given phase bin to obtain six average phase-resolved source and background energy spectra. Similarly using the FTOOLs addrmf and addarf, we created six weight-averaged response matrices and the ancillary response functions, respectively. For each of these twelve response files (six RMFs and six ARFs) weights were assigned according to the total number of background-subtracted counts in a given observation. We then binned the energy spectra to ensure a minimum of 30 counts in each spectral bin.
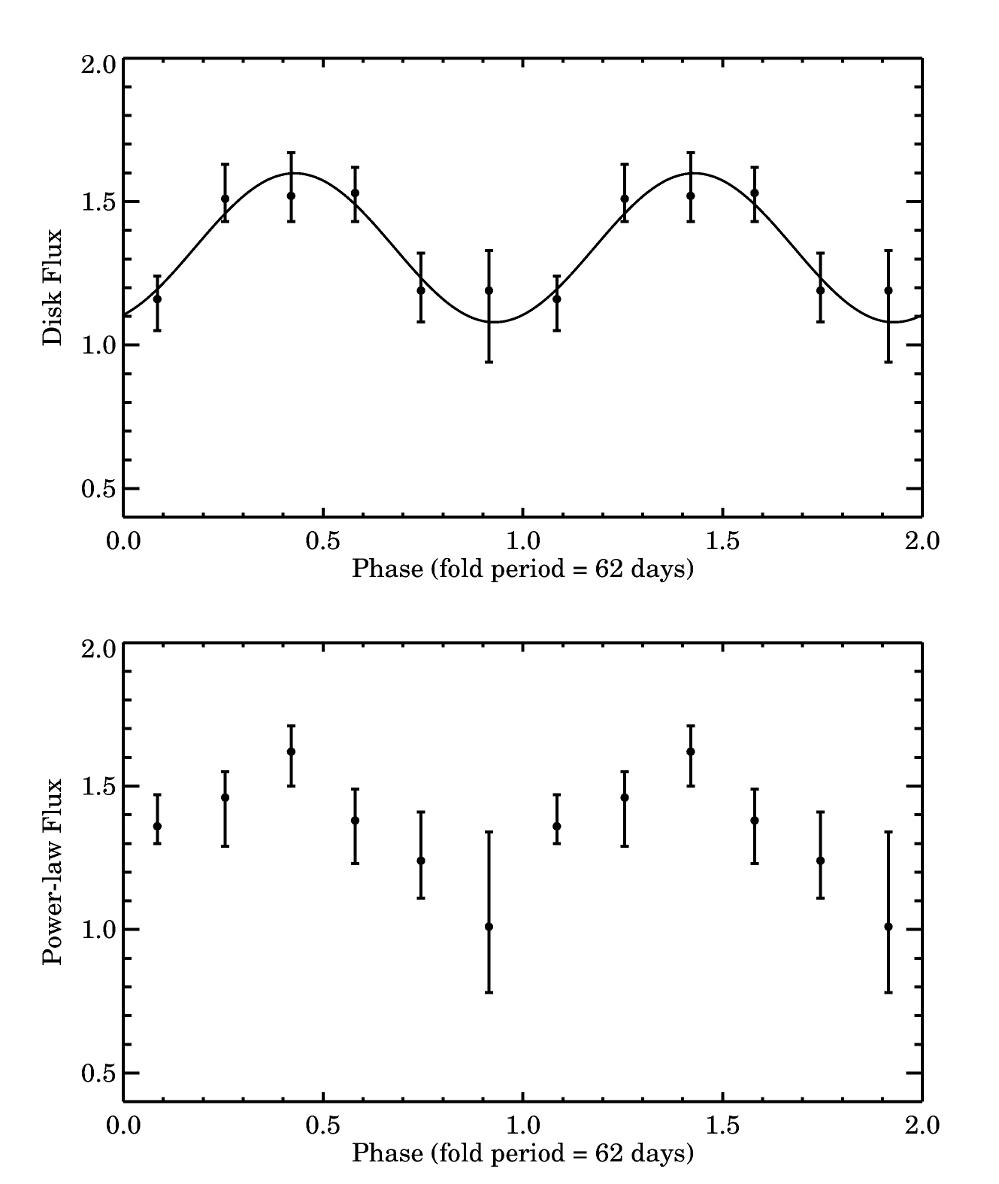
We modeled each energy spectrum with a blackbody disk, a power-law model, and a gaussian component to account for the weakly broadened Fe K line. We used the XSPEC (Arnaud 1996) spectral fitting package to fit the spectra. In terms of XSPEC models, we used phabs*(diskpn + gauss + pow). The spectral resolution of the data does not allow us to constrain the Gaussian parameters but it is required for a good fit. Therefore, we fixed the centroid energy and the width of the iron line at 6.55 keV and 0.33 keV, respectively. We obtained these values from earlier work using high-resolution Suzaku and XMM-Newton observations of M82 X-1 (Strohmayer & Mushotzky 2003; Caballero-García 2011). We find that in the energy range 3-15 keV this model fits the data well, giving reduced values in the range of 0.5-1.1 for 23 degrees of freedom. All the best-fit model parameters are indicated in Table 1. Figure 4 shows the value of the disk and the power-law fluxes as a function of the phase. Clearly, the disk flux varies with phase.
| phabs(diskpn+gauss+pow): | ||||||
|---|---|---|---|---|---|---|
| Phasea | 0.085 | 0.255 | 0.420 | 0.58 | 0.745 | 0.915 |
| T | 2.2 | 2.1 | 2.1 | 2.2 | 2.4 | 2.8 |
| N | 5.7 | 9.1 | 10.0 | 7.5 | 4.1 | 2.0 |
| N | 3.9 | 4.1 | 4.4 | 4.2 | 3.9 | 4.3 |
| e | 2.0 | 1.8 | 1.8 | 1.8 | 2.1 | 2.5 |
| N | 5.4 | 3.8 | 4.6 | 4.1 | 6.3 | 9.6 |
| F | 2.60 | 3.10 | 3.22 | 2.98 | 2.48 | 2.26 |
| F | 1.16 | 1.51 | 1.52 | 1.53 | 1.19 | 1.19 |
| F | 1.36 | 1.46 | 1.62 | 1.38 | 1.24 | 1.01 |
| /dof | 14/23 | 11/23 | 18/23 | 24/23 | 21/23 | 18/23 |
aWe obtained six phase-resolved energy spectra where each spectrum is an average of all data within 1/6th of the phase bin. bAccretion disk temperature in keV. The inner disk radius was fixed at 6GM/c2. cNormalization (10-7) of the diskpn component. dNormalization (10-5) of the gaussian component (Fe K emission line). eIndex () and the normalization (10-3) of the power-law component of the energy spectrum. fTotal X-ray flux (FX), Disk flux (FDisk) and the power-law flux (FPower) of the energy spectrum in the energy range of 3-15 keV (units are 10-11 ergs s-1 cm-2). The column density of hydrogen along the line of sight was fixed at 1.11022cm-2 – the best-fitting value found by Feng & Kaaret (2010) using the high spatial resolution Chandra data.
5. Discussion
The phase offset noted above ( 0.4 cycles or about 25 days) occurs over roughly 1000 days. This corresponds to a characteristic timescale of 1/(0.4/1000) or 10 yrs. This is unusually fast for an orbital phenomenon. The typical values of evolution timescales of orbits of accreting compact binaries (neutron star or black hole binaries) are a few106 yrs (e.g., Verbunt 1993; Levine et al. 2000; Wolff et al. 2009; Jain et al. 2010 and references therein). This suggests that the evolutionary timescale of the phenomenon associated with the 62 day period may be 105 times faster than typical. Periods longer than the orbital period have been detected from numerous compact binaries (e.g., Kotze & Charles 2012, KC12 hereafter; Wen et al. 2006, W06 hereafter). These are known as super-orbital periods and are ascribed to disk precession (e.g., Katz 1973; Pringle 1996; Ogilvie & Dubus 2001) in addition to several other mechanisms (e.g., KC12). A characteristic feature of super-orbital periods is that they are often accompanied by sudden changes in coherence, either in the period or the phase, similar to the suggested behavior reported here from M82 (e.g., Clarkson et al. 2003; KC12).
On the other hand, numerous systems exhibit relatively stable super-orbital periods. These include Her X-1 with a period between 33-37 days (e.g., Leahy & Igna 2010; Figure 16 of KC12), LMC X-4 with 30 days (W06; Figure 5 of KC12), and SS433 with a period of 162 days (W06; Figure 7 of KC12). 2S 0114+650 also shows a stable super-orbital period (Figure 8 of KC12) but this may not be due to a precessing accretion disk (e.g., Farrell et al. 2006). At least in Her X-1 phase shifts are known to occur (see, for example, Figure 9 of Clarkson et al. 2003) just before the onset of the so-called anomalous low state.
Moreover, if this modulation is indeed due to a precessing accretion disk one expects the X-ray flux originating from the disk to vary with a period of 62 days. This is simply due to the fact that as the accretion disk precesses its projected area on the sky varies with the phase of the precession period. The observed dependence of the disk flux with the phase of the 62 day period is consistent with this idea (see Figure 4).
One of the controversies surrounding M82 X-1 is whether it hosts an intermediate-mass or stellar-mass black hole. If the 62 day period is indeed due to relatively stable precession of the accretion disk – perhaps due to radiation induced warping – then probing the warp structure can, in principle, give us some insight into the mass question. Given the accretion efficiency of the black hole () and the ratio of the viscosity in the normal to the planar direction (), Pringle (1996) derived the radius beyond which the disk warps,
| (1) |
where is the Schwarzschild radius (). The value of is 1 (Pringle 1996). As noted earlier, M82 X-1 has an average luminosity of 51040 ergs s-1. Assuming isotropic emission the relation connecting the mass of the black hole (M), the accretion efficiency () and the luminosity (L) is,
| (2) |
where has units of . Now, if M82 X-1 were an intermediate mass black hole of, say, a few 1000 M⊙, the value of is of order 0.1. The radii at which the disk warps is then a few 1000 Rs. On the other hand, if the source were a stellar-mass black hole, say of 20 M⊙, the value of is about 10 which results in warping at radii of a few Rs, i.e., the innermost regions of the disk.
The majority of the disk flux is emitted from its innermost regions ( a few 10 Rs), by the gravitational energy loss of the in-falling material. As noted above there are two possible disk structures: (1) where the inner disk is warped while the outer disk remains flat (stellar-mass black hole scenario) or (2) the outer disk is warped with the inner disk remaining flat (intermediate-mass black hole scenario). In the first case, as the innermost disk precesses the X-ray disk flux originating from this region will also modulate at the precession period thus naturally explaining the observed disk modulation (Figure 4). In the second case the direct disk emission is expected to remain constant with the precession period. However, the disk photons can reflect off the warp in the outer disk and this reflected component will modulate at the precession period. In this case the reflection can also produce emission features, viz., Fe k. The strength of the reflection is proportional to the projected surface area of the warped disk where reflection occurs. Therefore any such emission lines would be expected to vary periodically with the phase of the precession period. The quality of the current data (Table 1) does not allow us to solve this problem, however, this should be possible in the near future using phase-resolved X-ray spectroscopy.
6. Orbital Scenario and caveats
While our results show that the 62 day period of M82 X-1 may be due to a precessing accretion disk they do not yet rule out an orbital nature. In the standard picture of periodic X-ray modulations from X-ray binaries, obscuration by, for example, a hot spot at the edge of the accretion disk (accretion stream interaction site: see Parmar & White 1988; Armitage & Livio 1998) is thought to produce the regular variations at the orbital period. It is interesting to note that the phase offset appears to occur just prior to the large flare occurring around day 1000. If the standard hot spot model is at play here, it is conceivable that a sudden influx in the accreting material may have shifted the hot spot and caused an apparent phase shift. Furthermore, the flux from M82 (Figure 1) is a combination of multiple sources within RXTE’s field-of-view (see Figure 1 of Matsumoto et al. 2001). If the power-law component were dominated by the contaminating sources one expects it to remain constant with phase. But, given the fact that there is some evidence for a varying power-law flux with phase (bottom panel of Figure 4) it is likely that part of the power-law contribution comes from M82 X-1. This can be tested with future NuSTAR observations. While NuSTAR will not be able to spatially resolve M82 X-1, energy-dependent surface brightness modeling similar to that reported by Pasham & Strohmayer (2013) can, in principle, constrain its high-energy X-ray spectrum. On the other hand, the assumption of a thermal accretion disk and a power-law corona for the X-ray energy spectra of ULXs has been questioned (e.g., Gladstone et al. 2009).
In summary, our results suggest that the 62 day X-ray period of M82 X-1 may be due to a precessing accretion disk. This hypothesis would be greatly strengthened if a variation in the observed periodicity can be confirmed. This can be explored with future monitoring observations using instruments such as the X-ray telescope on board Swift.
We thank Craig Markwardt for providing us the latest RXTE/PCA background model and the referee for valuable suggestions that helped us improve the paper.
References
- Armitage & Livio (1998) Armitage, P. J., & Livio, M. 1998, ApJ, 493, 898
- Arnaud (1996) Arnaud, K. A. 1996, Astronomical Data Analysis Software and Systems V, 101, 17
- Begelman (2002) Begelman, M. C. 2002, ApJ, 568, L97
- Caballero-García (2011) Caballero-García, M. D. 2011, MNRAS, 418, 1973
- Clarkson et al. (2003) Clarkson, W. I., Charles, P. A., Coe, M. J., & Laycock, S. 2003, MNRAS, 343, 1213
- Colbert & Mushotzky (1999) Colbert, E. J. M., & Mushotzky, R. F. 1999, ApJ, 519, 89
- Dewangan et al. (2006) Dewangan, G. C., Titarchuk, L., & Griffiths, R. E. 2006, ApJ, 637, L21
- Fabbiano (1989) Fabbiano, G. 1989, ARA&A, 27, 87
- Farrell et al. (2006) Farrell, S. A., Sood, R. K., & O’Neill, P. M. 2006, MNRAS, 367, 1457
- Feng & Kaaret (2010) Feng, H., & Kaaret, P. 2010, ApJ, 712, L169
- Gladstone et al. (2009) Gladstone, J. C., Roberts, T. P., & Done, C. 2009, MNRAS, 397, 1836
- Han et al. (2012) Han, X., An, T., Wang, J.-Y., et al. 2012, Research in Astronomy and Astrophysics, 12, 1597
- Hopman et al. (2004) Hopman, C., Portegies Zwart, S. F., & Alexander, T. 2004, ApJ, 604, L101
- Horne & Baliunas (1986) Horne, J. H., & Baliunas, S. L. 1986, ApJ, 302, 757
- Jain et al. (2010) Jain, C., Paul, B., & Dutta, A. 2010, MNRAS, 409, 755
- Kaaret et al. (2006) Kaaret, P., Simet, M. G., & Lang, C. C. 2006, ApJ, 646, 174
- Kaaret & Feng (2007) Kaaret, P., & Feng, H. 2007, ApJ, 669, 106
- Kaaret et al. (2009) Kaaret, P., Feng, H., & Gorski, M. 2009, ApJ, 692, 653
- Katz (1973) Katz, J. I. 1973, Nature Physical Science, 246, 87
- King et al. (2001) King, A. R., Davies, M. B., Ward, M. J., Fabbiano, G., & Elvis, M. 2001, ApJ, 552, L109
- Körding et al. (2002) Körding, E., Falcke, H., & Markoff, S. 2002, A&A, 382, L13
- Kotze & Charles (2012) Kotze, M. M., & Charles, P. A. 2012, MNRAS, 420, 1575
- Leahy & Igna (2010) Leahy, D. A., & Igna, C. D. 2010, ApJ, 713, 318
- Levine et al. (2000) Levine, A. M., Rappaport, S. A., & Zojcheski, G. 2000, ApJ, 541, 194
- Matsumoto et al. (2001) Matsumoto, H., Tsuru, T. G., Koyama, K., et al. 2001, ApJ, 547, L25
- Miller & Colbert (2004) Miller, M. C., & Colbert, E. J. M. 2004, International Journal of Modern Physics D, 13, 1
- Mucciarelli et al. (2006) Mucciarelli, P., Casella, P., Belloni, T., Zampieri, L., & Ranalli, P. 2006, MNRAS, 365, 1123
- Ogilvie & Dubus (2001) Ogilvie, G. I., & Dubus, G. 2001, MNRAS, 320, 485
- Parmar & White (1988) Parmar, A. N., & White, N. E. 1988, Mem. Soc. Astron. Italiana, 59, 147
- Pasham & Strohmayer (2013) Pasham, D. R., & Strohmayer, T. E. 2013, ApJ, 764, 93
- Pasham & Strohmayer (2013) Pasham, D. R., & Strohmayer, T. E. 2013, ApJ, 771, 101
- Portegies Zwart et al. (2005) Portegies Zwart, S. F., Dewi, J., & Maccarone, T. 2005, Ap&SS, 300, 247
- Pringle (1996) Pringle, J. E. 1996, MNRAS, 281, 357
- Scargle (1982) Scargle, J. D. 1982, ApJ, 263, 835
- Servillat et al. (2011) Servillat, M., Farrell, S. A., Lin, D., et al. 2011, ApJ, 743, 6
- Strohmayer & Mushotzky (2003) Strohmayer, T. E., & Mushotzky, R. F. 2003, ApJ, 586, L61
- Strohmayer (2009) Strohmayer, T. E. 2009, ApJ, 706, L210
- Swartz et al. (2011) Swartz, D. A., Soria, R., Tennant, A. F., & Yukita, M. 2011, ApJ, 741, 49
- Verbunt (1993) Verbunt, F. 1993, ARA&A, 31, 93
- Wen et al. (2006) Wen, L., Levine, A. M., Corbet, R. H. D., & Bradt, H. V. 2006, ApJS, 163, 372
- Wolff et al. (2009) Wolff, M. T., Ray, P. S., Wood, K. S., & Hertz, P. L. 2009, ApJS, 183, 156