FORMULATION OF NON–STEADY–STATE DUST FORMATION PROCESS IN ASTROPHYSICAL ENVIRONMENTS
Abstract
The non-steady–state formation of small clusters and the growth of grains accompanied by chemical reactions are formulated under the consideration that the collision of key gas species (key molecule) controls the kinetics of dust formation process. The formula allows us to evaluate the size distribution and condensation efficiency of dust formed in astrophysical environments. We apply the formulation to the formation of C and MgSiO3 grains in the ejecta of supernovae, as an example, to investigate how the non-steady effect influences the formation process, condensation efficiency , and average radius of newly formed grains in comparison with the results calculated with the steady–state nucleation rate. We show that the steady–state nucleation rate is a good approximation if the collision timescale of key molecule is much smaller than the timescale with which the supersaturation ratio increases; otherwise the effect of the non-steady state becomes remarkable, leading to a lower and a larger . Examining the results of calculations, we reveal that the steady–state nucleation rate is applicable if the cooling gas satisfies during the formation of dust, and find that and are uniquely determined by at the onset time of dust formation. The approximation formulae for and as a function of could be useful in estimating the mass and typical size of newly formed grains from observed or model-predicted physical properties not only in supernova ejecta but also in mass-loss winds from evolved stars.
1 INTRODUCTION
In astrophysical environments, dust grains condense in the metal-rich cooling gas such as the stellar winds from evolved stars and the expanding ejecta of novae and supernovae (SNe). Once newly formed dust grains are injected into the interstellar medium (ISM), they cause interstellar extinction and diffuse infrared emission, and also serve as catalysts for H2 formation and building materials of such planets as we live on. Hence, the investigation of formation and evolution of dust is indispensable in disclosing the nature of objects at high redshifts, the radiative process and energy balance in the ISM, and the formation history of stars and planetary systems.
In particular, the origin of dust has been hotly debated since the discoveries of a huge amount of dust grains at redshifts higher than (Gall et al. 2011 and references therein). In an early epoch of the universe, core-collapse SNe arising from short-lived massive stars are likely to be dominant sources of dust (e.g., Dwek et al. 2007). In fact, recent far-infrared to submillimeter observations of young supernova remnants, SN 1987A (Matsuura et al. 2011; Lakićević et al. 2012), Cas A (Sibthorpe et al. 2010; Barlow et al. 2010), and Crab (Gomez et al. 2012), have reported the presence of subsolar mass of cool dust formed in the ejecta, which seems to be high enough to account for the observed amount of dust at high redshifts. However, these cool grains have not yet undergone the destruction in the hot gas swept up by the reverse and forward shocks, and thus their mass does not necessarily represent the amount of dust finally ejected by SNe. What fraction of newly formed grains can survive on their journeys to and in the ISM heavily depends on their sizes at the time of formation (e.g., Nozawa et al. 2006, 2007). Thus, in order to reveal the roles of SNe as sources of dust in the universe, it is essential to understand not only the total mass but also the size distribution of dust produced in the ejecta of SNe.
The formation process of dust in the SN ejecta has been studied mainly with the classical nucleation theory and its extension (Kozasa et al. 1989, 1991; Todini & Ferrara 2001; Nozawa et al. 2003, 2008, 2010, 2011; Bianchi & Schneider 2007). In the nucleation theory, the condensation of dust is described by the formation of stable seed nuclei (called critical clusters) and their growth, where the formation rate of critical clusters is derived by assuming the nucleation current to be in a steady state. This theory enables us to predict the size distribution and mass of condensing grain species, and the results of the dust formation calculations have nicely explained the mass of dust formed in SN 1987A (Kozasa et al. 1991) and the formation and evolution processes of dust in Cas A (Nozawa et al. 2010).
However, it has been argued that the validity for the application of classical nucleation theory could not be justified in the rarefied gas typical of dust-forming region of astrophysical interest (Donn & Nuth 1985 and references therein); in much less dense systems, the timescale on which the nucleation current achieves a steady state must be longer than the timescales of evolutions of the gas density and temperature, which would render the application of the steady–state nucleation rate questionable. On the other hand, Paquette & Nuth (2011) suggested that the lack of the steady–state condition is unlikely to change the radius and number density of newly formed grains significantly. They showed that the resulting size distribution of dust is little affected even if the steady–state nucleation rate is reduced by a few orders of magnitude, although they did not clarify the effect of a non-steady state on the formation process of dust.
In this paper, we develop a method managing the dust formation process without postulating a steady state, which is expected to be more appropriate in astrophysical application. In Section 2, we formulate the non-steady–state dust formation process, including chemical reactions at the time of formation of clusters and grains. After describing a simple model of the time evolutions of the gas temperature and density in the ejecta of SNe in Section 3, we present, in Section 4, the results of the calculations for the formation of C and MgSiO3 grains and discuss the effect of the non-steady state and its dependence on the physical conditions in the ejecta. In Section 5, we demonstrate that the average radius and condensation efficiency can be uniquely determined by the ratio of the supersaturation timescale to the collision timescale at the time when the condensation efficiency rises to . Our conclusions are presented in Section 6. We also present the detailed derivation of the steady–state nucleation rate for the formation of compound grains such as silicates in Appendix A.
2 FORMULATION OF NON–STEADY–STATE FORMATION PROCESS OF CLUSTERS AND DUST GRAINS
In this section, we formulate the non-steady–state formation of clusters and dust grains accompanied by chemical reactions, by means of a kinetic approach. Most of grain species of astrophysical interest, like silicate, have no monomer molecule with the same chemical composition as the condensate. This implies that the formation of such compound grains proceeds via the chemical reactions involving the relevant gas species, while the reaction pathways and their rate constants are not well known. One of the methods of evading the difficulty in treating the formation of compound grains without the detailed knowledge of the chemical pathways and reaction constants is to employ the concept of a key species (key molecule) that is defined as a gaseous reactant with the least collisional frequency among the gaseous reactants, as proposed by Kozasa & Hasegawa (1987). In this method, two-body reactions between a cluster and the key molecule are considered to control the kinetics of the chemical reaction; the concept of key molecule has been applied also for the growth process of compound grains in circumstellar envelopes as well as molecular clouds (e.g., Ferrarotti & Gail 2001; Zhukovska et al. 2008). In what follows, we refer to the cluster composed of –key molecules as –mer, and assume that clusters are spherical. We also assume the temperature of clusters to be the same as the gas temperature.
First, for simplicity, we shall consider a cooling gas in a closed box with the initial concentration of the key molecule at a time . As the gas cools down, the condensation of dust grains proceeds through formation and growth of –mer clusters via the attachment of the key molecules. In principle, the time evolution of concentration of –mers can be described by a set of differential equations
| (1) |
where is the net current density from –mer to –mer. Here we consider that a cluster containing more key molecules than can be treated as a macroscopic grain (hereafter simply called “grain”). Given the concentration and the mass of the key molecule, the growth rate of grains is given by
| (2) |
where is the grain radius, is the sticking probability of the key molecule onto grains, is the volume of the condensate per key molecule, is the Boltzmann constant, is the temperature of the gas, and is the supersaturation ratio.
The successive formation of clusters and the growth of grains cause the depletion of the key molecules. The time variation of the concentration of the key molecule is determined from the equation of the mass conservation;
| (3) |
where is the hypothetical radius of the condensate per key molecule, and is the radius of a grain that reaches at and is measured at .
In the following subsections, we describe how the current density and the supersaturation ratio can be presented according to the chemical reaction at the time of formation.
2.1 Case for a Single–element Grain
In this subsection, as a reference, we consider the formation of clusters whose chemical composition is the same as that of the key molecule (hereafter we refer to such a grain as a “single-element grain”) in order to clarify how the formation process of clusters is formulated by means of the kinetic approach. In this case, the formation of clusters proceeds through attachment and detachment of a key molecule as follows;
| (4) | |||||
| (5) |
where and represent the key molecule and the –mer cluster, respectively. Then, the current density is given by
| (6) |
where is the attachment rate coefficient of a monomer to an –mer, and is the detachment rate coefficient of a monomer from an –mer. In general, has not been measured for the materials of astrophysical interest. Thus, considering that collisions of monomers control the kinetics of attachment, we evaluate as follows,
| (7) |
where is the sticking probability of a monomer onto an –mer, is the Kronecker’s delta, and is the reduced mass of a monomer and an -mer. The detachment rate coefficient () can be related to through the principle of detailed balance;
| (8) |
where is the concentration of the –mer in the gas in thermodynamic equilibrium at a temperature . Then, the current density is reduced to
| (9) |
From the law of mass action stemming from the condition that the sum of chemical potentials of the reactants is equal to that of the products in chemical equilibrium (see Landau & Lifshitz 1976)
| (10) |
where and are, respectively, the partial pressure and the chemical potential at a standard pressure of the –mer, the factor of the second term in the parenthesis on the right-hand side of Equation (9) is written as
| (11) |
By introducing the supersaturation ratio defined as
| (12) |
where and are, respectively, the chemical potential at a standard pressure and the vapor pressure of the bulk condensate, the exponent in Equation (11) is represented as
| (13) |
Then, the current density is expressed as
| (14) |
for .
Note that, as is seen from Equations (1) and (14), the current density cannot be evaluated without any relation between and . Thus, in order to close Equations (1) to (3), we introduce a closure relation that the current density from –mer to –mer, , is approximated by
| (15) |
supposing that for .
2.2 Case for a Multi–element Grain
In order to derive the formula as generally as possible, we consider that an –mer cluster containing of the key molecule is generated from the following chemical reactions;
| (16) |
where (–) and (–) denote the gaseous reactants and products, respectively, and the stoichiometric coefficients of the gaseous reactants () and products () are normalized to the key molecule. In the following, we designate the physical quantities of the gaseous reactants and products by attaching the superscript and , respectively; for example, the concentrations (partial pressures) of the gas species are denoted as (). Below we first formulate the formation of dimer and then describe the formation of –mer. In the formulation, we assume that clusters with have the same stoichiometric composition as the condensate.
2.2.1 Formation of dimer ()
We consider that the dimer formation proceeds through the reaction
| (17) |
Under the consideration that the collision of key molecule controls the kinetics of the chemical reaction, the current density is written as
| (18) |
where the forward reaction coefficient is the same as that given in Equation (7). The form of the second term on the right-hand side of Equation (18) is based on the principle of detailed balance that the ratio of the forward reaction coefficient to the backward reaction coefficient is expressed as in chemical equilibrium. Then, the current density is represented as
| (19) |
with
| (20) |
where and ( and ) are the concentrations (partial gas pressures) of the –th gaseous reactants and products, respectively, in the gas in thermodynamic equilibrium at a temperature . As is the case for a single-element grain, by applying the law of mass action and introducing ()111 Note that the formulation is applicable except for the case of such as the endothermic dissociative reaction C2H2 C2H2 (C 2H2 for the formation of the dimer (C. defined as
| (21) |
the factor of the second term in the parenthesis on the right-hand side of Equation (19) can be rewritten as follows; since
| (22) | |||||
we have
| (23) |
where
| (24) | |||||
| (25) |
Then, by applying the law of mass action
| (26) |
with
| (27) |
where and are the chemical potentials of –th gaseous reactants and products at a standard pressure , respectively, the factor in the second term in the parenthesis on the right-hand side of Equation (19) is reduced to
| (28) |
The exponent in Equation (28) is written as
| (29) |
where the supersaturation ratio is defined as
| (30) |
and Equation (19) is finally reduced to
| (31) |
2.2.2 Formation of –mer ()
For the chemical reaction (16) for the formation of –mers (), the current density is given by
| (32) |
with defined by Equation (7), and the principle of detailed balance leads to the equation
| (33) |
From the law of mass action
| (34) |
the factor in Equation (33) can be reduced to
| (35) |
With defined by Equation (30), the exponent in Equation (35) is rewritten as
| (36) |
and consequently, the current density for is given by
| (37) |
It should be mentioned here that the chemical reaction at the time of formation is included in the current density only through the factor given by Equation (24), in Equation (21), and the supersaturation ratio defined by Equation (30). The formation process of multi-element grains formulated by introducing the key molecule can be treated as the natural extension of the formation process of single-element grains; in fact, Equations (31) and (37) can be reduced to Equation (14) by substituting calculated for .
Note that in principle the current density can be evaluated once the chemical potentials of –mers are given. However, the chemical potential has been available only for tiny clusters () of very few materials of astrophysical interest (e.g., Goumans & Bromley 2012). Therefore, the so-called capillary approximation, which is the practice for estimating the chemical potential of an –mer in terms of the chemical potential of a monomer in the bulk condensate and the surface energy (Abraham 1974; Blander & Katz 1972), is generally adopted for evaluating the current density as well as the steady–state nucleation rate. For example, is expressed as
| (38) |
for a single-element grain (e.g., Yasuda & Kozasa 2012), where is the surface tension of bulk condensate. By substituting into Equation (13), for a single-element grain is written as
| (39) |
where . Inspecting the change of the chemical potential for the formation of a dimer from the reactants given by Equation (29) for a multi-element grain and (Equation (A5)) for the formulation of the steady–state nucleation rate in comparison with the corresponding one given by Equation (13) for a single-element grain, we can see that the factor in Equation (29) represents the contribution of the key molecule to the change of chemical potential. Thus, the chemical potential of an –mer with for a multi-element grain can be defined as
| (40) |
so as to be consistent with the formula for a single-element grain. Then, is evaluated by
| (41) |
and
| (42) |
2.3 Formulation of Cluster and Dust Formation in a Cooling Gas Flow
Equations (1) and (3) describe, respectively, the time evolution of concentrations of –mer clusters and the conservation of the key molecule in a fixed volume. However, the formation of dust takes place generally in a cooling gas flow such as the stellar winds from evolved stars and the expanding ejecta of SNe and novae. Therefore, it is more useful to formulate the formation process of dust in a frame comoving with the gas.
Let us consider a specific volume comoving with the gas. The nominal concentration of the key molecule is defined as the concentration without the depletion due to the formation of clusters and dust grains. Thus, at a time holds the relation . The current from the –mer to the –mer in is given as , and the time variation of the number of –mers in , , is expressed as
| (43) |
Then, Equation (43), being divided by , is reduced to
| (44) |
where represents the normalized concentration of –mers, and the normalized current density from the –mer to the –mer is given by
| (45) |
with .
The equation of the mass conservation for the key molecule given by
| (46) |
being divided by , is also rewritten as
| (47) |
By introducing
| (48) |
and , is calculated by solving the following simultaneous differential equations
| (49) | |||||
and is calculated from Equation (47). The concentrations of gaseous reactants and products except for the key molecule taking into account the depletion due to the formation of clusters and the growth of grains are evaluated, respectively, by
| (50) |
and
| (51) |
where and are the nominal concentrations of –th gaseous reactant and product, respectively. These equations can be solved, given the initial abundances of gaseous reactants and products as well as clusters () at together with the time evolutions of gas temperature and density.
Note that represents the number fraction of the key molecules left in the gas phase (so-called depletion efficiency), the number density of dust grains (), and the number fraction of the key molecules locked in dust grains. Hence, the condensation efficiency and volume-equivalent average radius are calculated by
| (52) |
respectively. In addition, since the grains nucleated in a time interval between and have the radii between and , the size distribution function of newly formed grains is calculated by
| (53) |
3 APPLICATION TO DUST FORMATION IN THE EJECTA OF SNe
We apply the derived formula to the formation of dust grains in the ejecta of SNe. The aim is to reveal how the non-steady–state effect and the physical conditions of the dust-forming regions affect the condensation efficiency, average grain radius, and size distribution. Also, in the following sections, we discuss the applicability of the steady–state nucleation rate.
3.1 Grain Species and Elemental Composition of the Gas
In the ejecta of SNe, the macroscopic mixing of elements is likely to be caused by the Rayleigh–Taylor instability. Although Cherchneff & Dwek (2009) have claimed that hydrogen atoms mixed with heavy elements play a critical role in the formation of precursor molecules of dust grains, the microscopic mixing of hydrogen penetrating into the inner layer is absolutely impossible within the timescale of a few years, because molecular diffusion length is much smaller than the typical sizes of the gas shell and clumps in the ejecta (Deneault et al. 2003; Clayton 2013). Thus, we suppose the onion-like composition as an elemental composition in the inner ejecta of SNe, and consider the formation of C and MgSiO3 grains individually, which are expected to form in the carbon-rich layer and the oxygen-rich layer of SNe, respectively. The chemical reactions at the time of formation of C and MgSiO3 grains and clusters, along with the physical constants necessary for the calculations, are taken from Table 2 of Nozawa et al. (2003).
It has been believed that carbon reacts with oxygen to produce CO molecules, and that carbon atoms tied up in CO cannot be available for the formation of C grains because CO is stable against dissociation. However, in the ejecta of SNe, some of CO molecules might be destroyed by the collisions with energetic electrons and charge transfer reactions with the ionized inert gas (Liu & Dalgarno 1994, 1996; Clayton et al. 1999, 2001; Clayton 2013). Here, we do not consider the formation and destruction processes of CO molecules, since we treat the initial abundance of carbon atoms available for dust formation as a parameter.
For MgSiO3 grains, we assume that the key molecule is SiO molecule, which has been considered to be a precursor for the formation of silicate grains in SNe (e.g., Kozasa et al. 1989; Kotak et al. 2009). The initial abundance of SiO is also treated as a parameter. The number ratios of Mg and O atoms to SiO molecules are taken to be and . These abundance ratios are of typical in the oxygen-rich layer of solar-metallicity SNe if almost all Si atoms are bound to SiO molecules (see e.g., Figure 1 of Nozawa et al. 2010).
3.2 Evolution of the Gas Density and Temperature
The number density and size distribution of newly formed dust depend on the time evolution of the density and temperature of the gas. In the ejecta of SNe, the gas expands homologously after 1 day, and the nominal concentration of a gas species decreases as
| (54) |
where is the concentration at a time .
On the other hand, the temperature of the gas in the ejecta is determined by the balance between the energy input due to the decay of radioactive elements and the energy output due to expansion and radiative cooling. In this study, as in some previous works (e.g., Kozasa et al. 1989), we assume the time evolution of the gas temperature as
| (55) |
where is the gas temperature at , and is a constant parameter. In the calculations of dust formation, we employ the capillary approximation expressed by Equations (38)–(42) for evaluating the chemical potentials and .
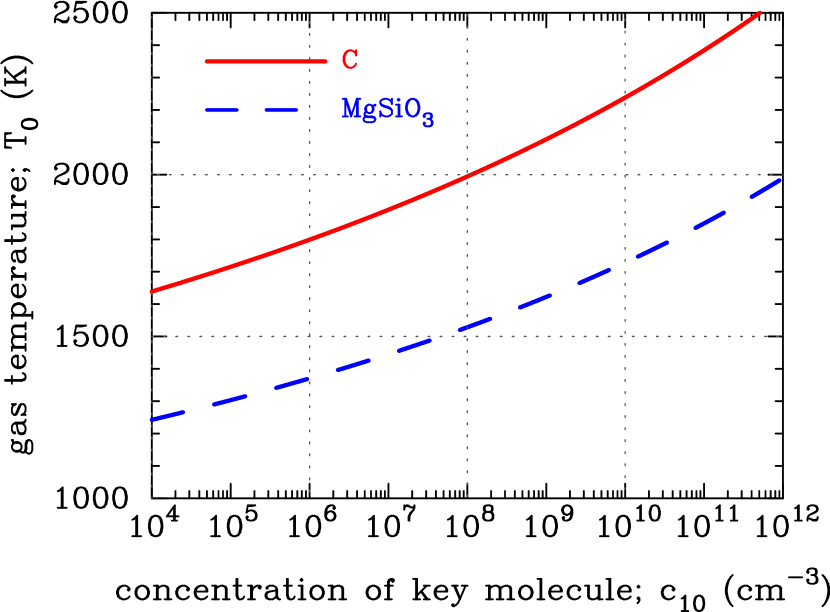
As the gas cools down, it shifts from unsaturated states () to supersaturated ones () in which the formation of dust grains occurs. Thus, we take as a time when , and determine the equilibrium temperature from the equation
| (56) |
for a given initial concentration of the key molecule (and given abundance ratios of reactants and products). Throughout this paper, the chemical potential for the formation of a bulk condensate from reactants per key molecule is approximated as with the numerical values and from Table 2 of Nozawa et al. (2003). Figure 1 shows the equilibrium temperature for C and MgSiO3 grains as a function of . For MgSiO3, and are adopted as mentioned above, but is insensitive to the changes in the abundance ratios. For both the grain species, is higher for higher , and K for C grains and K for MgSiO3 grains with cm-3.
As mentioned in Section 2, the condensation of dust is achieved through the formation of clusters and their growth. Thus, it is convenient to define the timescales characterizing these processes along with given temporal evolutions of the gas density and temperature. The time evolution of current density and thus the formation of clusters are regulated mainly by the time evolution of in (see Equations (41), (42), and (45)). Then, assuming that the depletion of the key molecule is negligible at the earlier stage of dust formation, we introduce the timescale of supersaturation with which the supersaturation ratio increases as follows,
| (57) |
where is the timescale of gas cooling for the current model. The second term on the right-hand side in Equation (57) generates from the time differentiation of the term in Equation (30) for the time evolutions of the gas density and temperature in Equation (54) and (55). On the other hand, the growth of dust grains proceeds through the collision (attachment) of the key species onto their surfaces, and the collision timescale is defined as
| (58) |
3.3 Calculations of Dust Formation
In what follows, we adopt as the minimum number of the key molecule that is regarded as a grain. This number corresponds to the minimum radius of grains Å for C grains and Å for MgSiO3 grains. The effect of changing on the results of calculations is examined in Appendix B. We take a sticking probability onto all sizes of clusters and grains. Among the three free parameters , , and in the models described above, we adopt and days as the standard values representing the gas cooling rate and the equilibrium time at which in the SN ejecta, although the cases for different and are examined as well. The calculations are performed up to the time long enough so that the current density and the growth rate of grains can become negligibly small.
The formation of dust grains from the gas phase takes place when .222The steady–state nucleation rate in Equation (59) can be applied only for ; see Appendix A. On the other hand, our non-steady–state calculations with the initial conditions of and () have confirmed the following; the formation of small () clusters is possible even if , although their abundances are very small. The abundances of small clusters at are the same as the steady–state values as a result of too high backward reaction rates (, see Equation (45)). Therefore, the steady–state abundances of small clusters at are taken as the initial values for the simulations starting from .
We also compare the results obtained from a set of formulae as described in Section 2 (hereafter referred to as the non-steady model) with those calculated from the revised steady–state nucleation rate (hereafter the steady model) given by
| (59) |
for which the detailed derivation is presented in Appendix A. In the steady model which does not involve the formation of clusters, the calculations of dust formation are performed by replacing with in Equation (47) without the first term on the right-hand side and by replacing with given in Equation (A9). In what follows, we refer to and as current densities and steady–state current density, respectively, for convenience.
4 RESULTS OF DUST FORMATION CALCULATIONS
Given the parameters and representing the cooling and dynamical times of the gas, the concentration controls the behavior of the formation processes of clusters and grains. We first present the results of the calculations in the case that the initial concentration of the key molecule is high enough that the assumption of a steady state is considered to be a good approximation. Then, we demonstrate the results for the low-density case. We also explore the dependence of the results on and in Section 4.3.
4.1 High Density Case
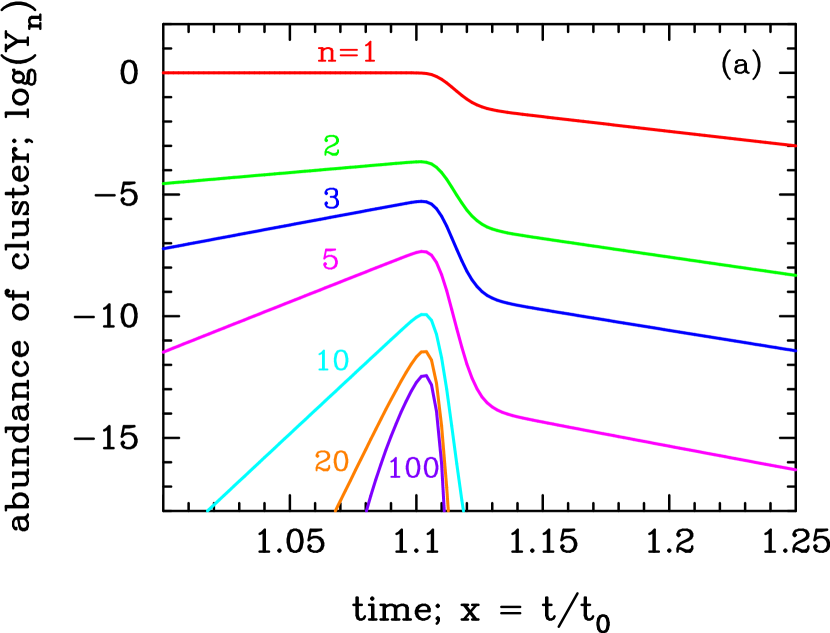
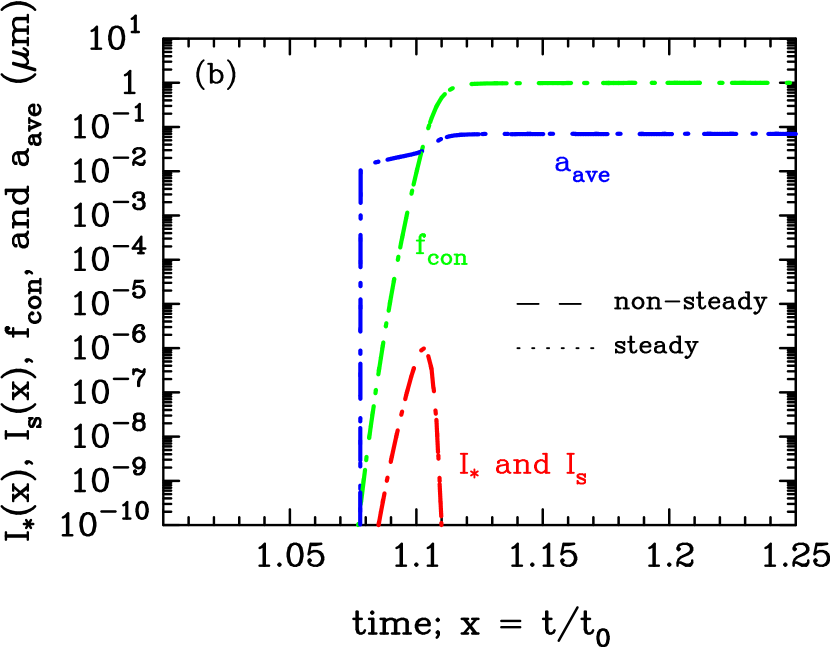
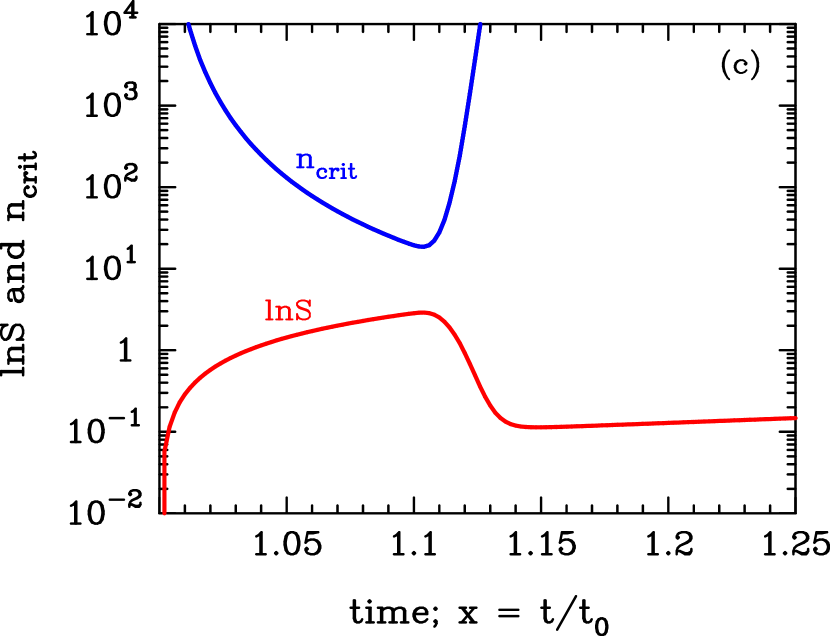
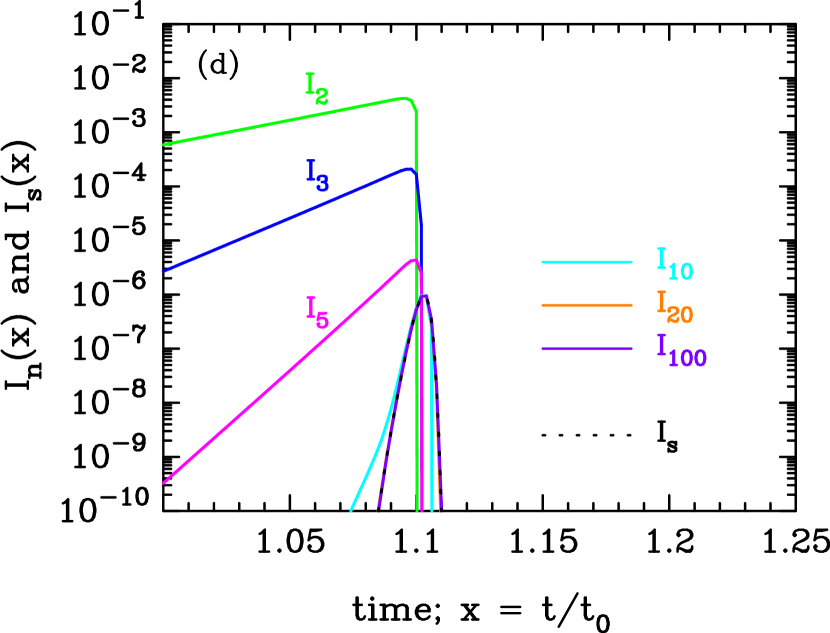
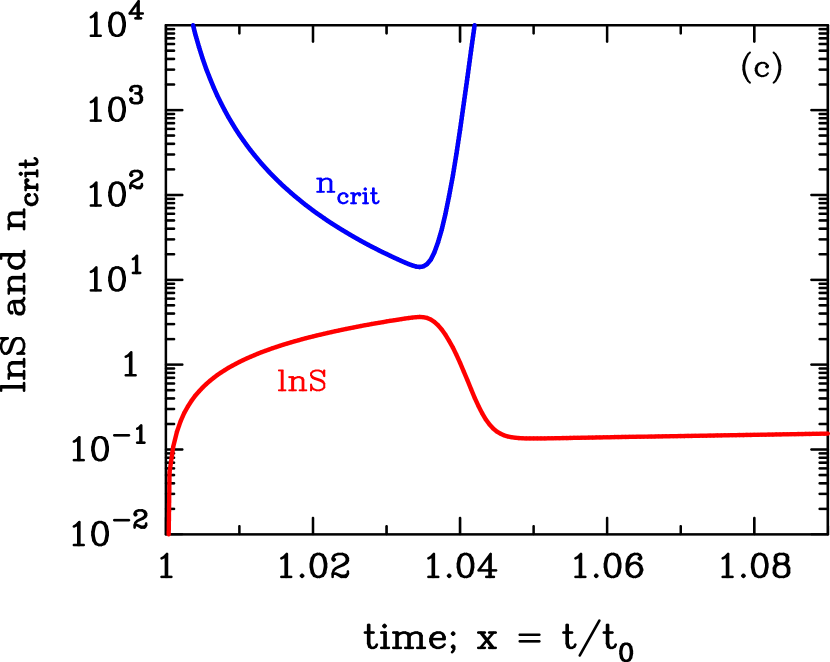
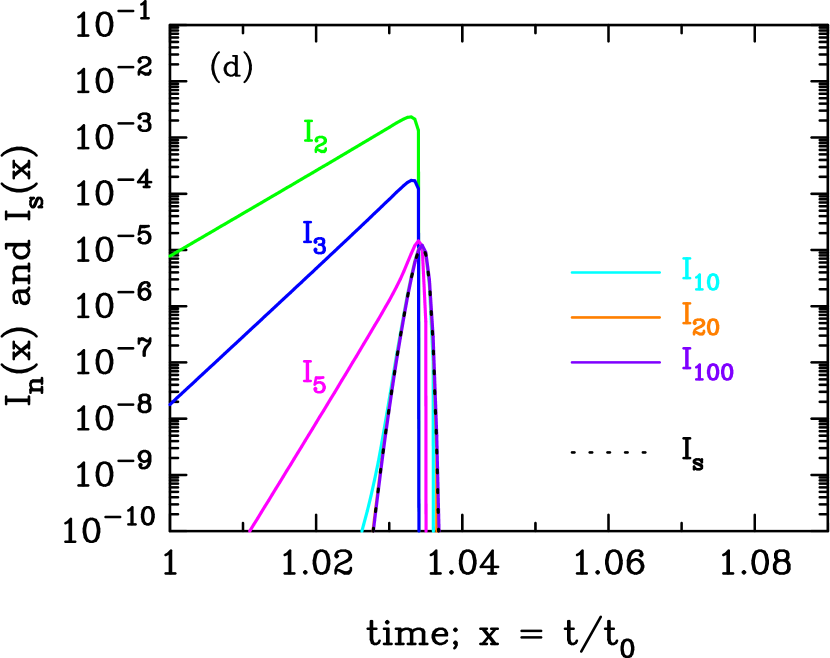
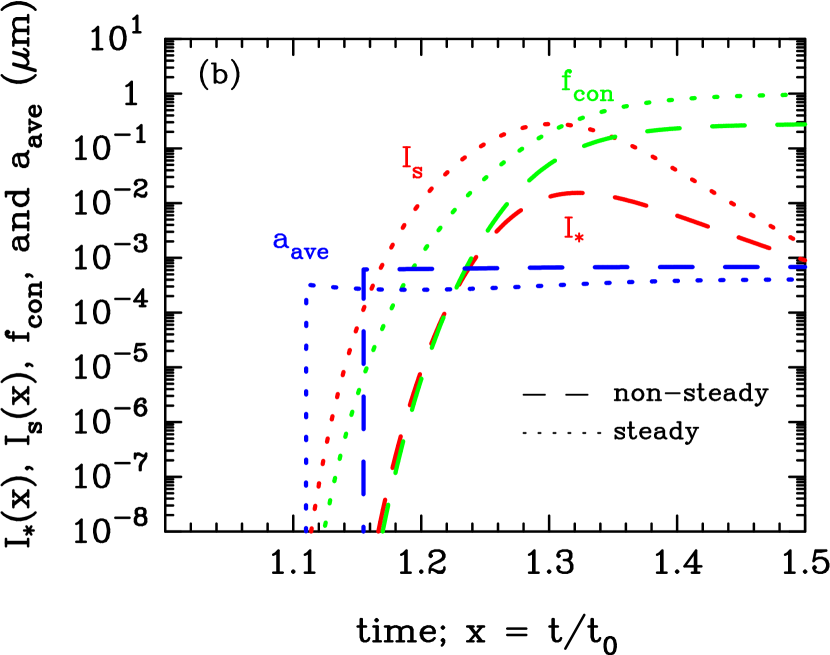
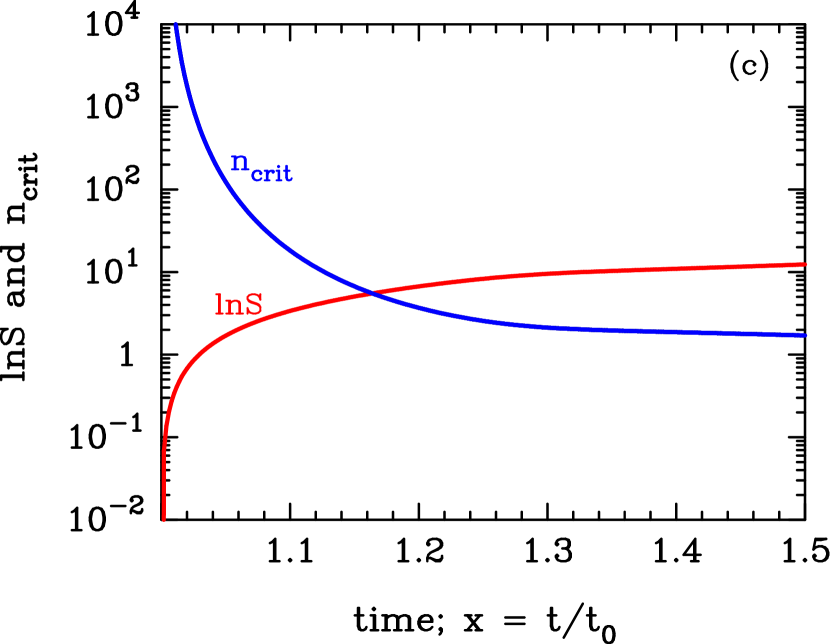
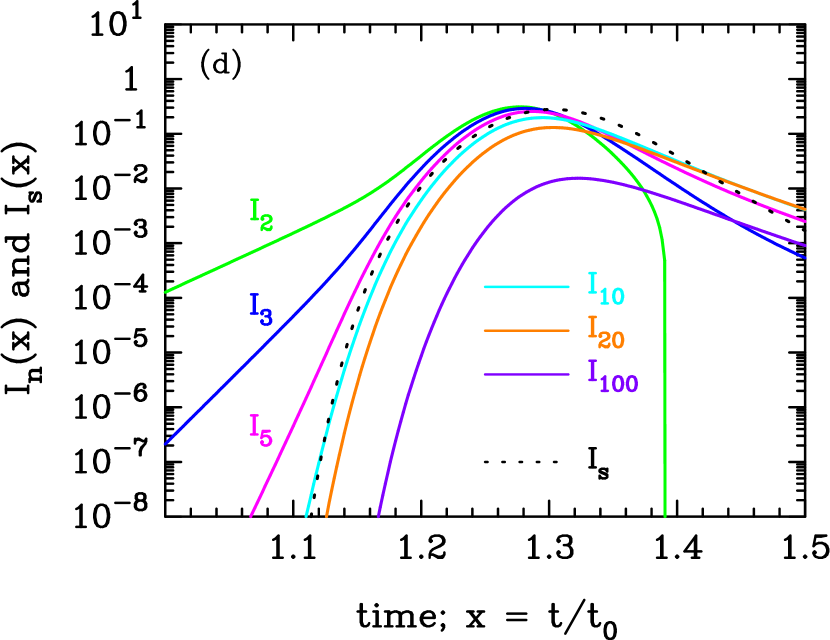
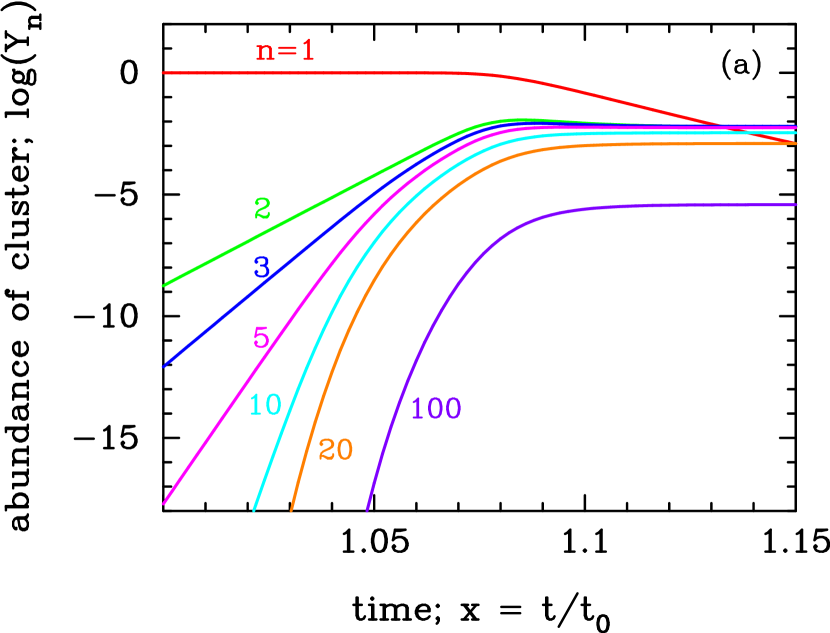
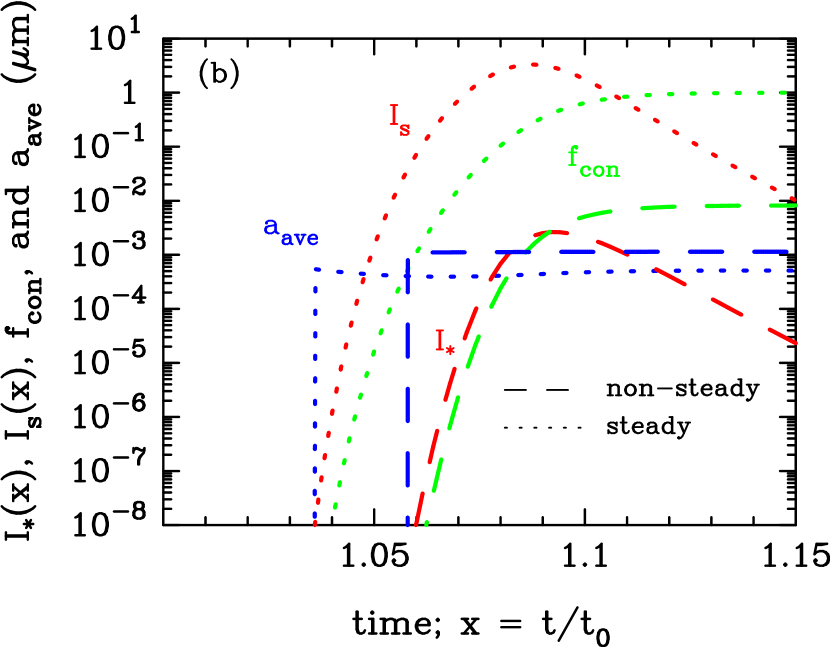
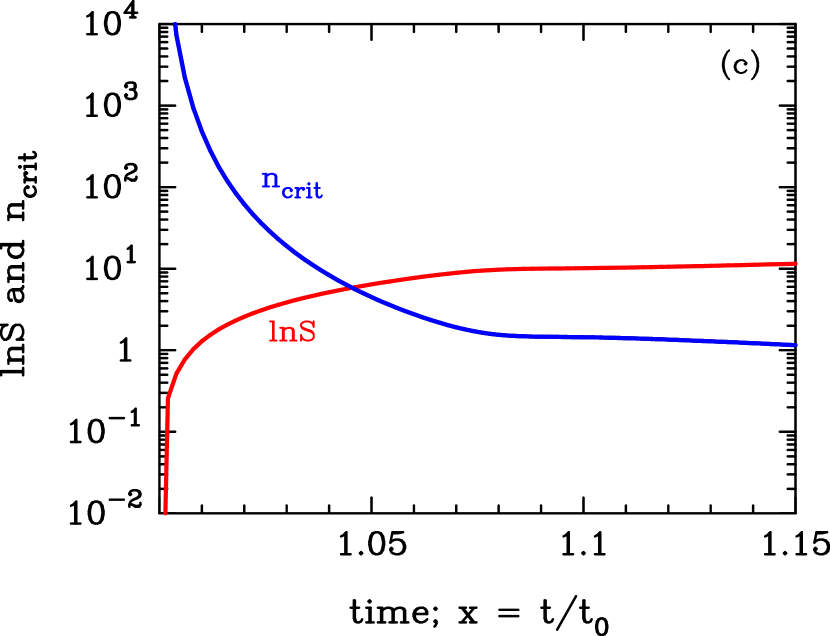
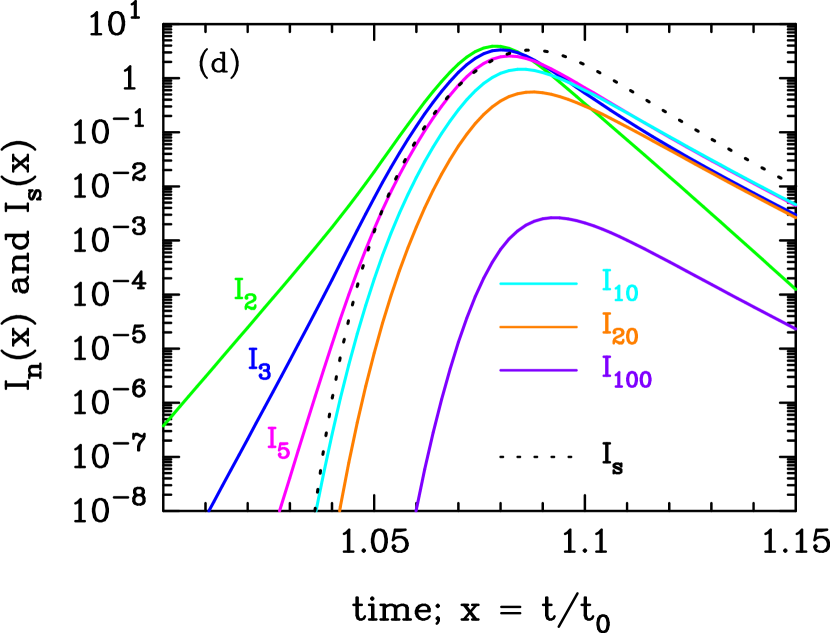
Figure 2 illustrates the formation process of C grains as a function of time () for cm-3, days, and ; Figure 2(a) depicts the evolutions of abundances of –mer clusters () as well as of the key molecules , and Figure 2(b) the time evolutions of the current density of –mer , average grain radius , and condensation efficiency . Note that, in the figure, the time evolution of the average radius is plotted after the time at which the condensation efficiency reaches , and hereafter the time is referred to as the onset time of dust formation.333 The threshold value is arbitrary, but, given that rises up quickly with time, it does not affect the conclusion of this paper as long as the value is less than . Figure 2(c) presents the time evolutions of the supersaturation ratio and the critical size that is defined as the size satisfying the condition , and Figure 2(d) the time evolutions of current densities for the formation of given –mers. The results for MgSiO3 grains are provided in Figure 3.
For both the grain species, the non-steady–state formation process of dust is described as follows. As can be seen from (c) and (d) of Figures 2 and 3, the increase in , induced by the decrease in gas temperature with time, leads to the formation of clusters with larger progressively. Once reaches 2 at which , becomes high enough that some amount of grains with start to form. A further increase in enhances , producing a much greater number of clusters and grains. Note that the onset time of dust formation is later for C grains () than for MgSiO3 grains (), which stems partly from the longer timescale of supersaturation and partly from the larger surface tension: 10 days and erg cm-3 for C grains ( 2.5 days and erg cm-3 for MgSiO3 grains). Since newly formed grains grow efficiently to cause the consumption of the key molecule, the supersaturation ratio reaches a maximum and then decreases. The critical size at is 20 for C grains (10 for MgSiO3 grains). The current densities for the formation of clusters with cease almost abruptly just before becomes , whereas those for –mer reach almost the same maximum value at and then decrease quickly. Accordingly, has a sharp peak; the gas temperature at the peak of is 1850 K (1490 K) for C (MgSiO3) grains, being lower than its equilibrium temperature K (1530 K). After then, dust grains continue to grow until by consuming almost all of the key molecules.
It should be noticed here that the current densities for the formation of clusters with around , being almost independent of , reach a steady–state value in this high-density case for which the condition of is satisfied (see Section 5). In addition, the steady–state value excellently matches the steady–state current density , as is seen from (b) and (d) in Figures 2 and 3, where we overplot the results obtained from the steady model (dotted lines).
The behavior of the formation process of clusters and grains in this high-density case can be qualitatively understood by inspecting the time evolution of regulating the backward reactions in Equation (45). The factor is a decreasing function of , and in a supersaturated gas, it becomes below unity for larger than a critical size approximately given as
| (60) |
for . Note that this expression for is equivalent to that for the steady–state current density as defined by Equation (A9). At the initial phase of , is very large () (see Figures 2(c) and 3(c)), so the backward reactions are dominant () for any size of –mers. In this case, the abundances of –mers at each time approximately take the values, , and the current to larger –mers is considerably smaller (). On the other hand, as increases with time, falls below , reaching down to 10–20. In this phase, the backward reactions are suppressed () for , so the –mers can grow exclusively through the collisions with the key molecules. Since the collision timescale is extremely small () in this high-density case, the reactions for proceed instantaneously, which makes the current densities being in a steady state (i.e., for ). Furthermore, the agreement of with can be interpreted as follows; even if is high enough, the backward reactions remain predominant for , where the relation holds. Thus, the abundance of –mers can be approximately estimated as
| (61) |
Then, the current of –mers is found to be on orders of
| (62) |
The exponential term in Equation (62), which dominates the time evolution of the current density, has the same form as the term in the steady–state current density . Hence, the current density for the formation of –mers is essentially equal to the steady–state current density . This allows us to conclude that the application of the steady–state current density could be valid as long as the consumption of the key molecules due to formation and growth of clusters and grains causes the supersaturation ratio to decrease in the course of time evolution of gas density and temperature, as is demonstrated in the case of a high initial gas density.
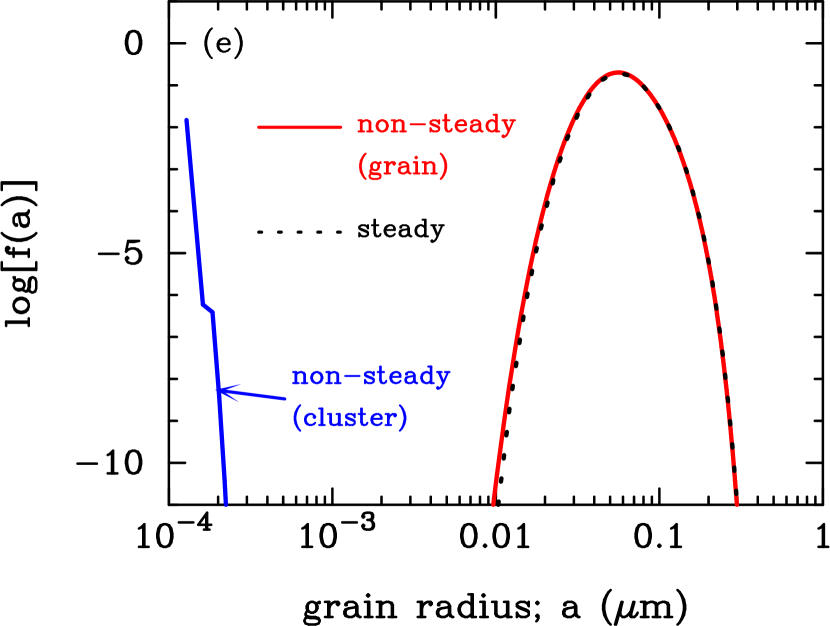
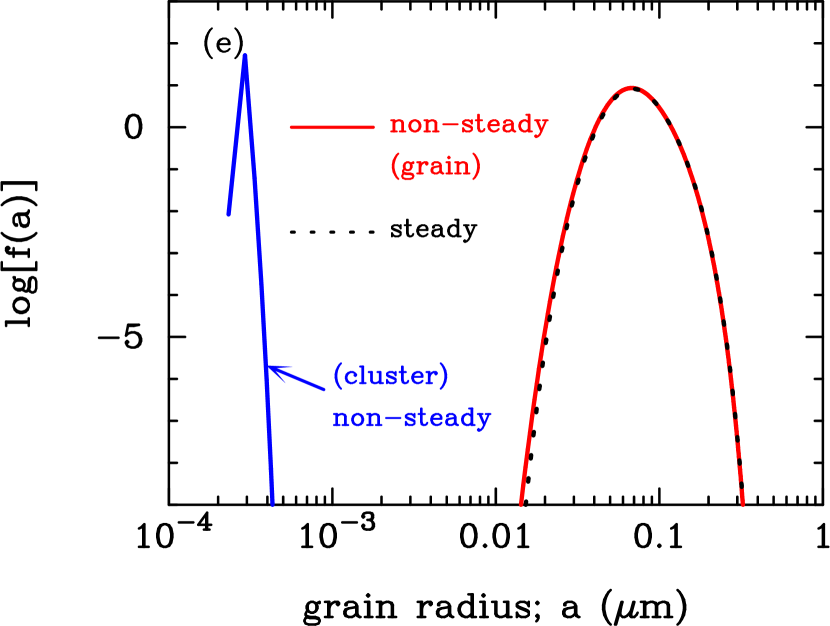
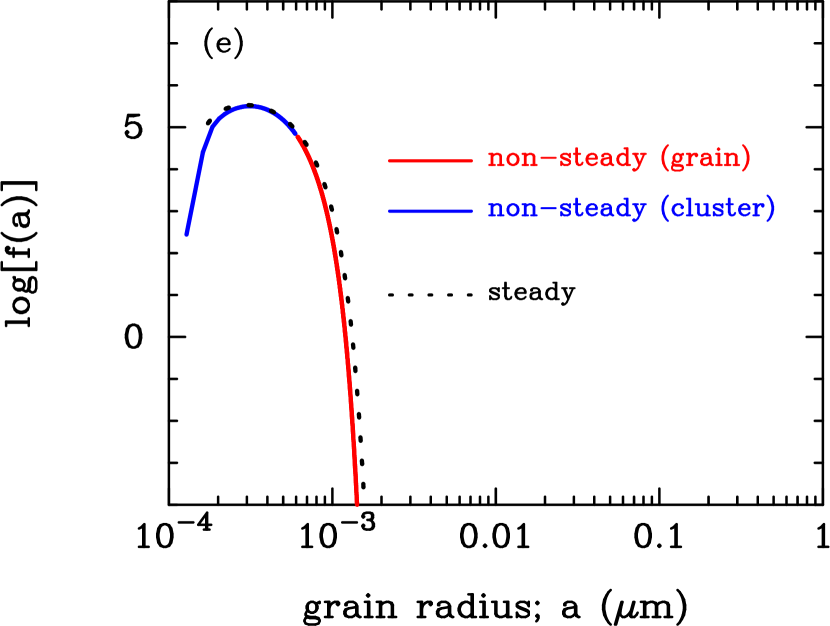
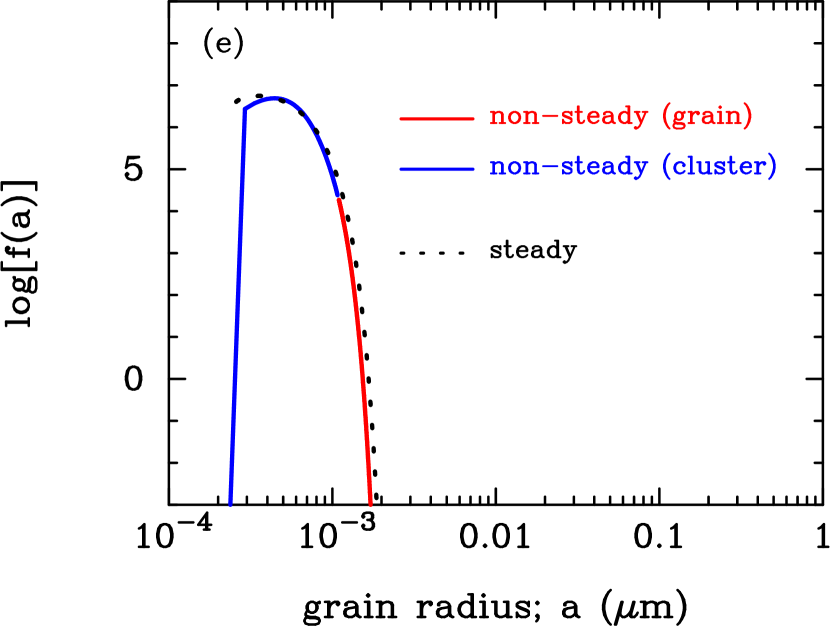
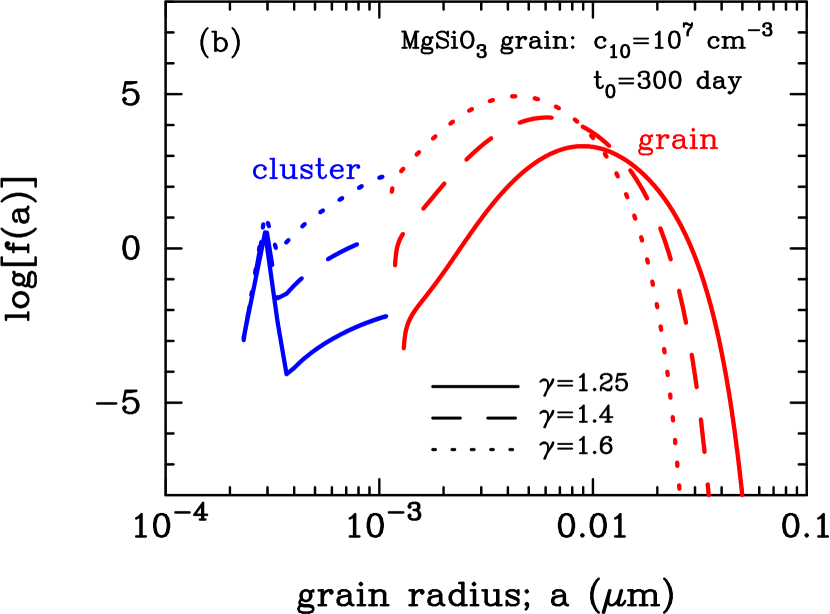
Figures 2(e) and 3(e) show the final size distributions of grains and clusters. The size distribution is lognormal–like with m for C grains and m for MgSiO3 grains. Since the size distributions of grains follow the time evolution of and is equal to , we can see that the size distribution in the non-steady model is the same as those in the steady model. In this high-density case with the final condensation efficiency , the abundance of the key molecules locked in the clusters is extremely small (). Our calculations show that, when the initial concentration is as high as cm-3, all carbon atoms and SiO molecules are ultimately locked in grains with the size distributions identical to those in the steady models.
4.2 Low Density Case
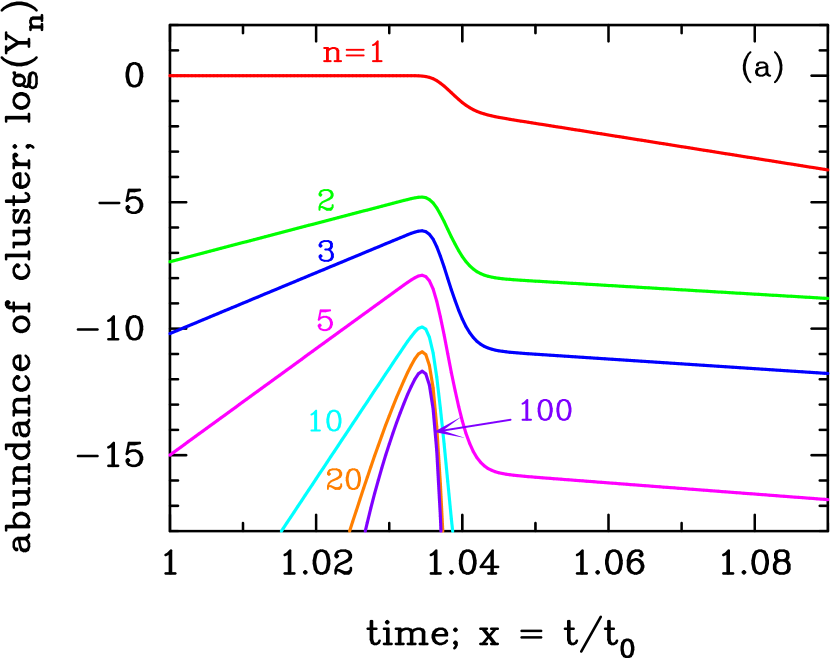
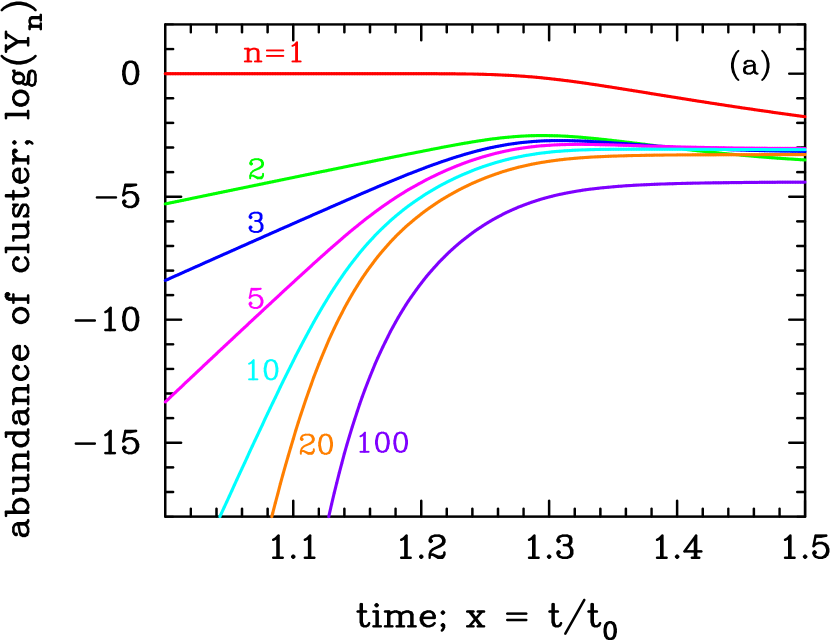
Figures 4 and 5 show the formation processes of C and MgSiO3 grains, respectively, for cm-3, days, and . Even for such a low initial gas density, the formation of –mers progresses as increases, as is the same as the high-density case. However, even if grains with are produced, they cannot grow efficiently through attachment of the key molecules because the collision timescale is considerably longer ( 1–10). Thus, despite the fact that the formation and growth of clusters and grains significantly consume the key molecules, continues to increase (Figures 4(c) and 5(c)), and gradually decreases after passing the peak in contrast to the high-density case (Figures 4(d) and 5(d)), which results in the formation of many small grains with . Finally, the depletion due to formation of clusters and grains and/or the dilution due to the expansion of the gas makes the concentration of the key molecules too low to advance the further growth, and the abundances of clusters approach to the constant values (see Figures 4(a) and 5(a)).
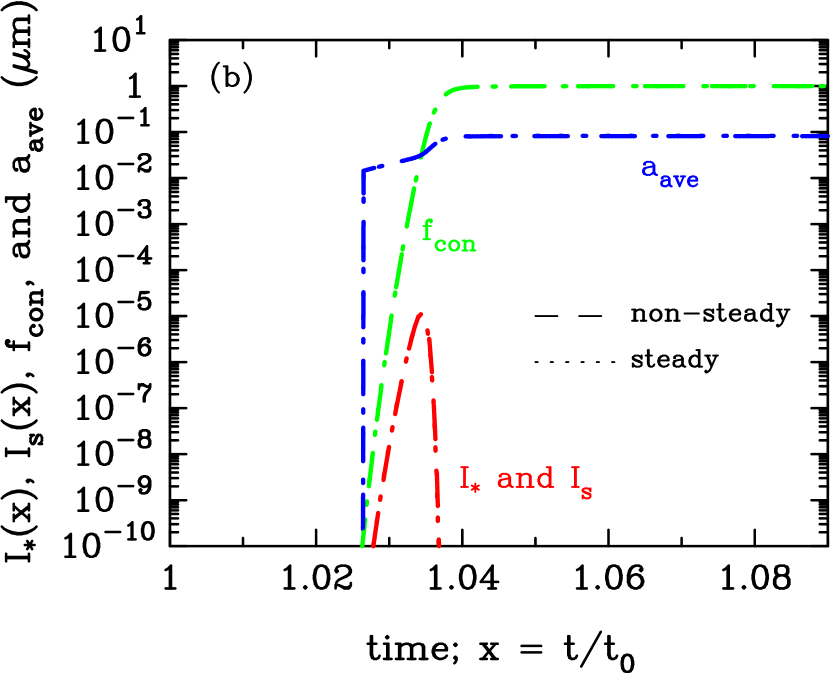
Figures 4(b) and 5(b) compare the time evolutions of (and ), , and between the non-steady and the steady models. It can be seen that the non-steady current density rises up at a time later than the steady–state current density , corresponding to the later onset time of dust formation, and that its peak value is much smaller than that in the steady model. This is at odds with the high-density case, indicating that the steady model is no longer appropriate for this low-density case with during the evolution. For clusters with , as mentioned in the previous subsection, evolves as , and at each time is on order of (c.f., Equation (62)). However, the collision timescale is too long for the current densities to establish a steady state at , so remains much lower than (Figures 4(d) and 5(d)).
There also appear differences in the final average radius and condensation efficiency of dust grains between the non-steady and steady models. The final condensation efficiency in the non-steady model is for C grains ( for MgSiO3 grains), which is lower than in the steady model for both the grain species. In both the models, the key molecules are little left in the gas phase () in the end, indicating that 70 % (99 %) of them are finally bound to clusters for the non-steady model. On the other hand, the final average radius of dust grains is larger for the non-steady model ( m for C grains and 0.0011 m for MgSiO3 grains) than for the steady model ( m for C grains and 0.0005 m for MgSiO3 grains).
The discrepancies in the average grain radius and condensation efficiency between the two models simply reflect the difference in the minimum size considered as grains. As can be seen from Figures 4(e) and 5(e), the final size distribution in the steady model is quite similar to the combined size distribution of grains and clusters in the non-steady model. This is because and are the same in both the models, so the number of –mer formed at a given time and the growth rate are essentially identical. However, in the steady model, clusters that meet are taken as bulk grains, and is normally less than 10, even down to 1–2 in the low density case as shown in Figures 4 and 5. Thus, the steady model, which regards small –mers as grains, leads to a smaller average grain radius and a higher condensation efficiency. Although we cannot have a clear number of constituent atoms to distinguish between small clusters and grains, it must be unreasonable to consider clusters with to hold the properties of bulk grains.
The results of calculations for this low initial density clearly attest that the application of the steady–state current density overestimates the condensation efficiency and underestimates the average grain radius for dust formation in less dense and/or rapidly cooling environments. Also, it may be useful to point out here that the application of the steady–state current density with a given cut-off value of critical size (e.g., Bianchi & Schneider 2007) in low-density/rapidly cooling environments, arguing the inadequacy of the extension to smaller critical sizes, leads to the considerable depression of the condensation efficiency and enhancement of the average grain radius, and cannot reproduce the combined size distribution of clusters and grains.
4.3 Dependence on and
In the subsections 4.1 and 4.2, we have demonstrated how the initial concentration of the key molecule affects the formation process and properties of newly formed grains. In this subsection, we investigate the dependence of other free parameters and on the formation process, average radius, and size distribution of dust grains.
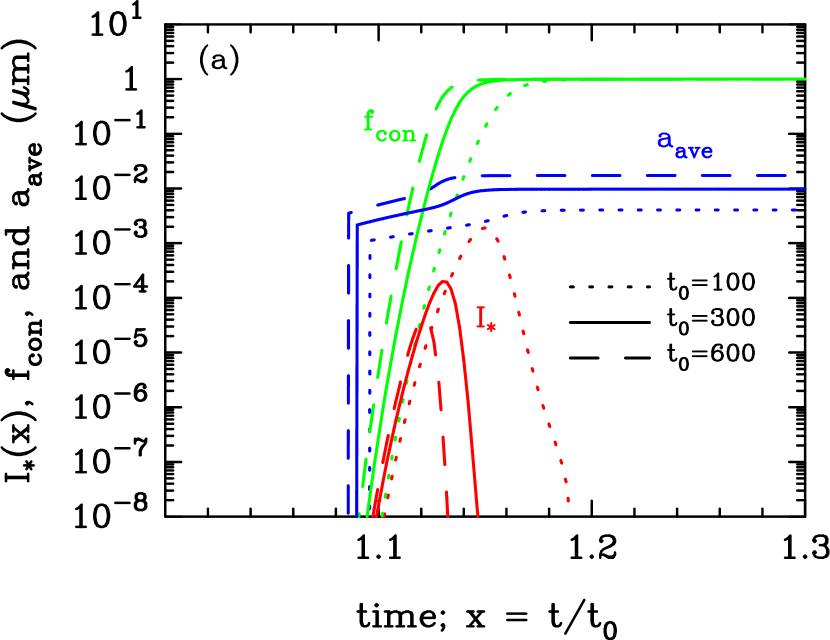
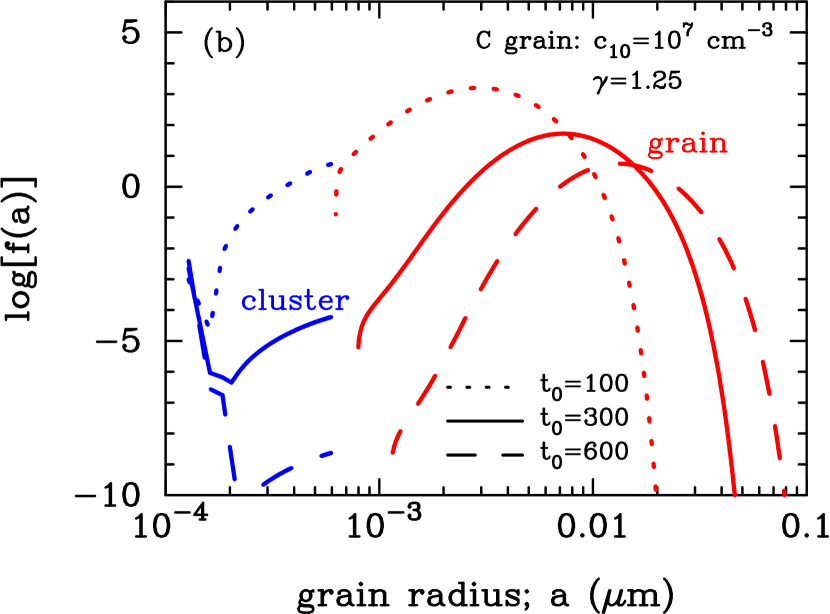
Figure 6(a) plots the formation process of C grains for 100, 300, and 600 days with cm-3 and 1.25. The results of the calculations show that a larger leads to a smaller peak of as well as a little earlier onset time of dust formation . This is explained as follows: as seen from Equation (57), the timescale of supersaturation in terms of , is independent of , while the timescale of grain growth, , is inversely proportional to . This means that the increase in makes grain growth more active but has little impact on the number of clusters at a given time . Therefore, for a larger , dust grains capture the key molecules more efficiently through their growth, which causes a faster rise of and a faster drop of (a smaller peak of ) and results in the grain size distribution weighted toward a larger radius (see Figure 6(b)). Thus, the increase in enhances the effect of grain growth relative to formation of clusters and act to produce dust grains with large average radii.
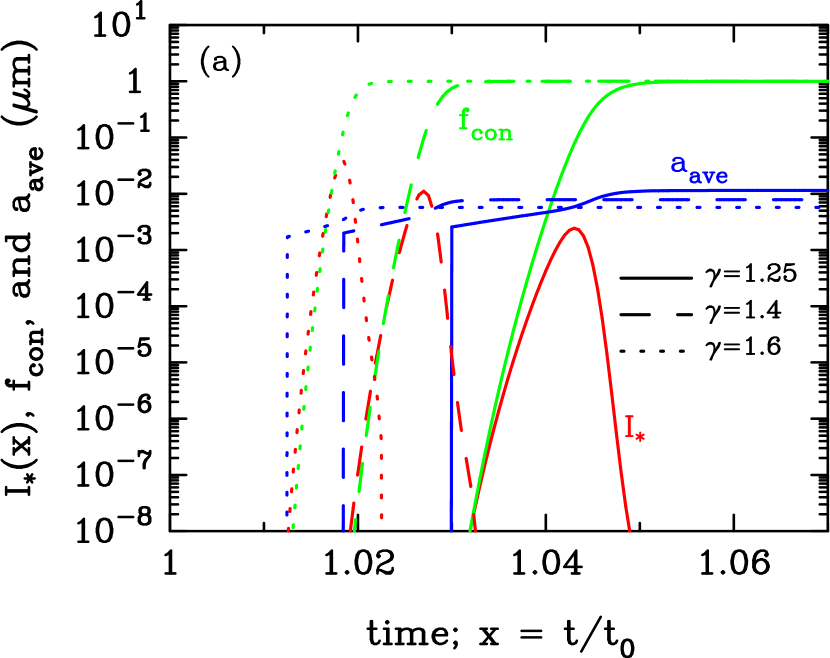
Figure 7 gives the results of the calculations for the formation of MgSiO3, adopting 1.25, 1.4, and 1.6 for cm-3 and = 300 days. For a larger , which corresponds to a more rapid cooling of the gas, the onset time of dust formation is earlier, and has a higher peak. Again considering the timescale in terms of , the timescale of supersaturation, decreases with increasing , whereas the timescale of grain growth, , increases. Hence, for a larger , a more rapid increase in as well as a more rapid decrease in leads to the formation of a larger number of clusters with at an earlier time before grain growth efficiently consumes the key molecules. Here it should be noted that the collision timescale in the models considered here is still short enough so that the consumption of the key molecules due to grain growth makes decrease during the evolution. Consequently, in the model with larger , increases more rapidly and has a higher and narrower peak at an earlier time, and the average grain radius as well as the peak radius of size distribution becomes smaller, as seen from Figures 7(a) and 7(b). In conclusion, the increase in makes the formation of clusters more active relative to grain growth and induces the formation of dust grains with small average radii even if is not much larger than unity.
5 THE SCALING RELATIONS FOR AVERAGE GRAIN RADIUS AND CONDENSATION EFFICIENCY
The objects to be clarified in the study of dust formation in astrophysical environments are not only the chemical composition of dust grains but also their amount and size distribution. In the ejecta of SNe, the knowledge on size distribution of newly formed dust is crucial for unraveling what amount and size of dust grains are finally ejected from SNe to the ISM, because the destruction efficiency of dust by the reverse shock heavily depends on the size distribution (e.g., Nozawa et al. 2007). Our results show that the size distribution of dust formed for given time evolutions of gas density and temperature is lognormal–like as long as during the formation of dust. Therefore, the average grain radius can be taken as a representative measurement of the size distribution. The condensation efficiency is also a fundamental quantity in estimating the mass of newly formed dust. In this section, we explore how the average grain radius and condensation efficiency can be constrained from a physical condition at the time of dust formation, and derive the scaling relations for the average radius and condensation efficiency, referring to the results of the calculations presented in the previous section. In addition, we clarify in what conditions the steady–state nucleation rate is applicable. Then, we shall present some examples of the application of the scaling relations for the formation of dust in SNe.
5.1 The Physical Quantity Characterizing Dust Formation Process and the Scaling Relations
The results in Section 4 demonstrate that the formation process of dust is determined by the competition between the formation of clusters and the growth of grains. Although the onset time of dust formation (and the condensation time at which the current density reaches the maximum), average grain radius, and condensation efficiency depend on , , and in a complicated manner, we have shown that the behavior of formation processes of dust grains can be qualitatively interpreted in terms of and during the formation of dust. It has been shown in the studies based on the steady–state nucleation rate that the average radius and number density of dust grains formed in a cooling gas undergoing macroscopic motion can be scaled by a non-dimensional quantity at the condensation time when the nucleation rate reaches the maximum (e.g., Hasegawa & Kozasa 1988).
The formation time of dust is the most direct information that can be obtained from observations of SNe. Hence, it is useful to relate the average grain radius and condensation efficiency to the gas density and temperature at the time of dust formation, in order to get the information on physical conditions in the ejecta from the observations and vice versa. One of the best indicators for the formation time of dust would be the condensation time, , defined as the time when has a peak. However, the depletion of the key molecules due to the formation and growth of clusters and grains at is considerably large ( 0.1–0.2 at ), which has significant effects on the relevant physical quantities. Thus, we adopt, as the time of dust formation, the onset time of dust formation, , defined as the time at which reaches . Then, the non-dimensional physical quantity characterizing the formation process of dust grains is given as
| (63) | |||||
where and , and () for C grains (MgSiO3 grains). In Equation (63), we employ the approximation (see Equation (57)), although we have calculated without using this approximation in the following figures.
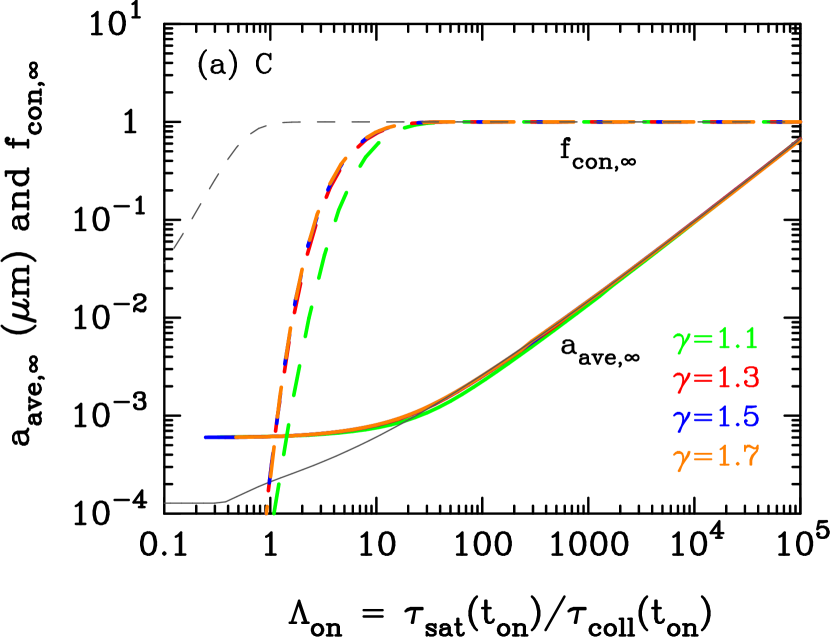
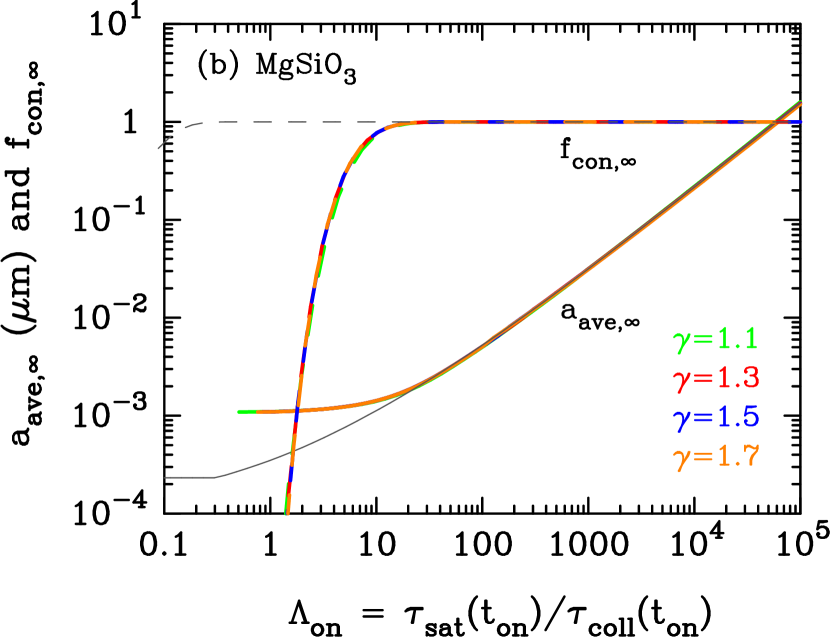
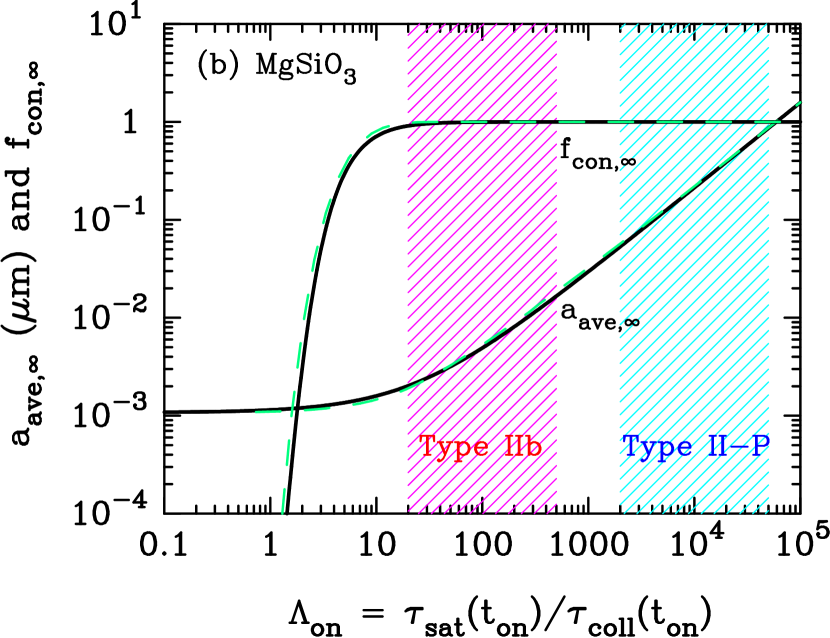
Figure 8 presents the final average grain radius and condensation efficiency as a function of calculated for 1.1, 1.3, 1.5, and 1.7 by covering a wide range of and . The figures show that, as increases, and increase, and at 20–30 for both C and MgSiO3 grains; for a larger , grain growth becomes more dominant over the formation of clusters, and as a result larger grains are formed to lock up all of the key molecules. The remarkable consequence of Figure 8 is that and for different (especially for ) are, respectively, plotted almost completely as a single curve for both C grains (Figure 8(a)) and MgSiO3 grains (Figure 8(b)). This means that the average grain radius and condensation efficiency can be uniquely determined by one parameter , except for C grains formed in extremely slowly cooling gas with low densities corresponding to the case of with . In the figures, we also plot and from the steady model for . They deviate from those from the non-steady model at , where the steady model predicts too small to be regarded as bulk grains with keeping . In other words, the steady–state nucleation rate is applicable only if .
Then, we derive the approximation formulae describing the dependence of and on for the non-steady model, which are, respectively, given by
| (64) |
and
| (65) |
where the fitting parameters , , and ( 1–3) are given in Table 1. In Figure 9, and calculated by the above fitting formulae are compared with the results of simulations for . Equation (64) reproduces the calculated average radii with the error less than 5 % for .
It should be emphasized here that the scaling relations given above are independent of the initial conditions of the calculations and the time evolution of the gas density. In fact, we have performed the dust formation calculations for expanding gas flows with a constant velocity by changing , and confirmed that the resulting and entirely coincide with those shown in Figure 8. Therefore, the average grain radius and condensation efficiency of a given grain species can be universally described by the corresponding non-dimensional physical quantity .
5.2 Application of the Scaling Relations to Dust Formation in SNe
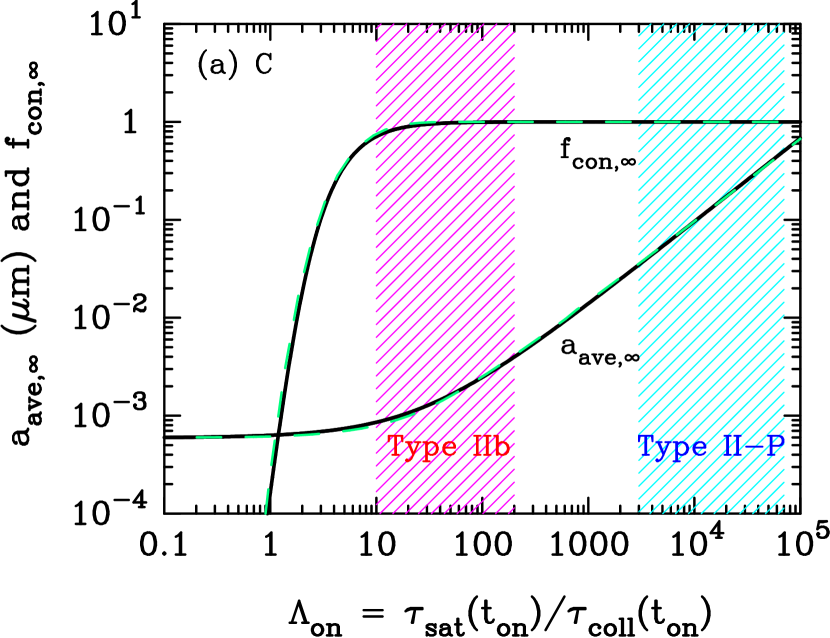
Equation (64) allows us to estimate the typical size of newly formed grains once we know the density of the gas in the ejecta and the onset time of dust formation (or the formation time of dust). For example, from Figures 1 and 2 in Nozawa et al. (2003), the concentration of carbon atoms in the carbon-rich He layer of Type II–P SNe is found to be – cm-3 at days. For the reasonable values of (1.5–1.7) and (2,000 K), Equation (64) presents 0.03–0.3 m ( (0.3–8, see Figure 9(a)), which is consistent with the average grain radii given in Figure 7 of Nozawa et al. (2003). In Type IIb SNe with much less massive hydrogen envelopes, the density of the gas at days is by a factor of 100–300 lower than in Type II–P (see Figure 2 of Nozawa et al. (2010)), and Equation (64) leads to 0.001 m (). This radius also agrees with that obtained in Nozawa et al. (2010). These simple analyses suggest that our previous calculations by a theory of the non-steady–state nucleation and grain growth applying the steady–state nucleation rate with a relaxation time toward the steady–state rate (see Nozawa et al. 2003) were performed under the condition that the steady–state approximation is appropriate.
Observationally, there have been few studies that reported a typical size of dust formed in SNe. Recently, Maeda et al. (2013) clearly detected the formation of C grains in the luminous Type IIn SN 2010jl around day 550 after the explosion by the optical through the near-infrared observation. They suggested that the typical radius of the dust grains is less than 0.1 m (more probably 0.01 m) to account for the wavelength-dependence of obscuration of hydrogen emission lines. These C grains are likely to have formed not in the ejecta but in relatively dense clumps in the shocked circumstellar shell, but it would be interesting to compare with our results. Based on the simple argument of optical depth, Maeda et al. (2013) showed that the gas density in the interclump medium must be cm-3. Then, assuming the abundance of carbon atoms to be , and with typical values of and , , where is the density contrast between the dense clumps and the interclump medium. Adopting 100–1000, Equation (64) yields 0.01–0.08 m, which is consistent with the grain size estimated from the observation. This emphasizes that Equations (64) and (65) could provide powerful constraints on the properties of newly formed grains through the gas density and condensation time extracted from observations as well as those predicted from theoretical models.
6 Summary
We have developed a new formulation describing the non-steady–state formation of small clusters and grains in a self-consistent manner, taking into account chemical reactions at the time of dust formation and assuming that the temperatures of small clusters are the same as that of the gas. Given the chemical potentials of small clusters, the formula can be applied to investigate the formation process of dust grains in rarefied astrophysical environments, where the steady–state nucleation rate is not applicable. It should be pointed out here that the formation process of dust is formulated in the present study under the assumption that the smallest cluster (dimer) has the same chemical composition as the grains. However, the formulation can be extended for the case that chemical compositions of small clusters are different from the grains, given the chemical reaction paths and chemical potentials. Also, the formula can be extended and applied to explore the effects of the difference in temperatures of small clusters and the gas (Kozasa et al. 1996; Yasuda & Kozasa 2012) as well as the temperature fluctuation (Keith & Lazzati 2011) and the shape of small clusters (Fallest et al. 2011) on the formation process of dust grains. These subjects will be studied in the future works.
Applying the new formulation with the capillary approximation for evaluating the chemical potentials of small grains, we have investigated the formation processes of C and MgSiO3 grains over a wide range of physical conditions expected in the ejecta of SNe. The results of the calculations have shown that the behavior of non-steady–state formation process of small clusters and grains can be qualitatively interpreted in terms of the temporal evolutions of the collision timescale of key molecule and the supersaturation timescale of the gas during the formation of dust; in the condition that , the formation process of dust grains can be completely reproduced by the steady–state nucleation rate, and grains form with the condensation efficiency , otherwise the formation of clusters and grains proceeds in a non-steady state, and the resulting condensation efficiency is with the efficiency of growth of clusters and grains being depressed considerably.
Analyzing the results of the model calculations, we found that the condensation efficiency and average radius of newly formed grains can be fully described by one non-dimensional quantity , the ratio of the supersaturation timescale to the collision timescale at the onset time of dust formation, although the time evolutions of gas temperature and density considerably influence the formation process as well as the average grain radius and condensation efficiency. Also, we have revealed that the steady–state nucleation rate is applicable under the condition of , irrespective of grain species; otherwise the application of the steady–state nucleation rate results in the formation of a large number of unreasonably small grains with the condensation efficiency considerably higher that calculated by the non-steady rate. Furthermore, we have derived the scaling relations for the average radius and condensation efficiency of C and MgSiO3 grains as a function of . The approximation formulae depend neither on the time evolution of the gas density and temperature nor on the initial condition, and thus could serve as a universal relation to predict the mass and average size of newly formed grains from the observations and/or the model calculations of explosions of supernovae and novae as well as mass-loss winds from stars.
Appendix A A Revised Formula of Steady-state Nucleation Rate
The rate of the steady–state homogeneous nucleation accompanied by chemical reactions of relevant gaseous molecules has been developed by introducing the concept of the key species (Kozasa & Hasegawa 1987) and has been applied for the formation of dust not only in the ejecta of SNe but also in the solar nebula (Kozasa & Hasegawa 1988) and in circumstellar envelopes of asymptotic giant branch stars (e.g., Kozasa & Sogawa 1997, 1998; Chigai et al. 1999). Yamamoto et al. (2001) tried to generalize the formulation for the steady–state nucleation rate and derived an analytic formula in which the effect of chemical reactions at the time of formation is included as a correction factor in a form of functions of partial pressures of reactants except for the key species and products as well as the standard gas pressure. However, the formula is incomplete because the nucleation rate depends on the standard gas pressure explicitly in the case that the number of product molecules is different from that of reactant molecules except for the key species. Thus, in this Appendix, we reformulate the analytic formula for the rate of the steady–state nucleation proceeding through the chemical reactions at the time of formation.
Here we consider the formation of dust grains through the chemical reactions (16) and (17). In a steady state, the current density from –mer to –mer is independent of , being identical to the steady–state nucleation rate . Thus, Equations (19) and (33) lead to the following relations, respectively,
| (A1) |
and
| (A2) |
where is defined by Equation (20). By summing up Equation (A1) and Equation (A2) multiplied by successively, the nucleation rate can be derived from the equation
| (A3) |
By applying Equations (28) and (35), the factor on the second term in the right-hand side of Equation (A3) is written as
| (A4) |
with
| (A5) |
where is the supersaturation ratio defined by Equation (30). Since and for , the second term on the right-hand side of Equation (A3) approaches to zero for as . Then, the steady state nucleation rate is given by
| (A6) |
As long as , the summation in Equation (A6) can be replaced with the integration, and the nucleation rate can be approximately calculated as
| (A7) |
Under the capillary approximation given by Equation (40), is expressed as
| (A8) |
and have a maximum at given by
| (A9) |
Thus, the integration of Equation (A7) with the saddle-point method results in the steady state nucleation rate given by
| (A10) |
and, for ,
| (A11) |
This revised formula of the steady state nucleation rate includes a correction factor defined as
| (A12) |
It should be emphasized that the factor is expressed as functions of concentration ratios of gaseous reactants/products to the key molecule and does not include the standard pressure explicitly.
In most of the past works for the formation of dust in the ejecta of SNe (e.g., Nozawa et al. 2003; Todini & Ferrara 2001), the factor has been set to be unity. Since for the formation of a multi-element grain with no gaseous product such as in the ejecta of SNe (see Nozawa et al. 2003), the revised formula provides a nucleation rate larger than the previous one; for the elemental abundances of the gas ( and ) for the formation of MgSiO3 used in the text, the revised formula presents the nucleation rate only by a factor of higher than the old one. This enhancement cannot be significant because Paquette & Nuth (2011) showed that the resulting size distribution of dust is little affected even if the steady state nucleation rate is changed by a few orders of magnitude.
Appendix B Dependence on
Here we describe how the change in in Equation (1) affects the formation process of dust as well as the average radius and condensation efficiency of newly formed grains. First of all, as demonstrated in Section 4.1 and discussed in Section 5, the change of does not influence the results of calculations as long as the formation of dust grains proceeds under the condition of and , because the current densities for achieve a steady–state value, being independent of . Thus, here we examine the effect of change in for the model in which the non-steady–state effect for the formation process of grains is significant.
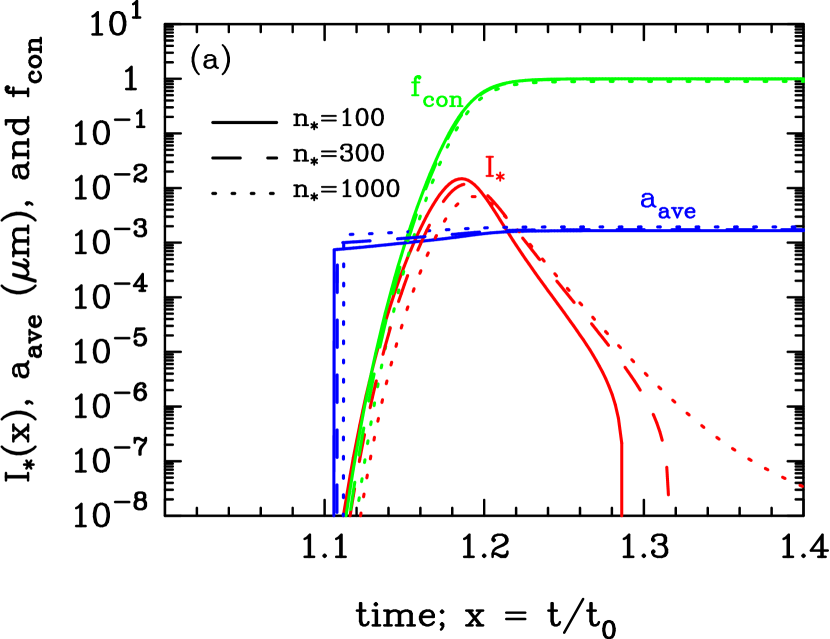
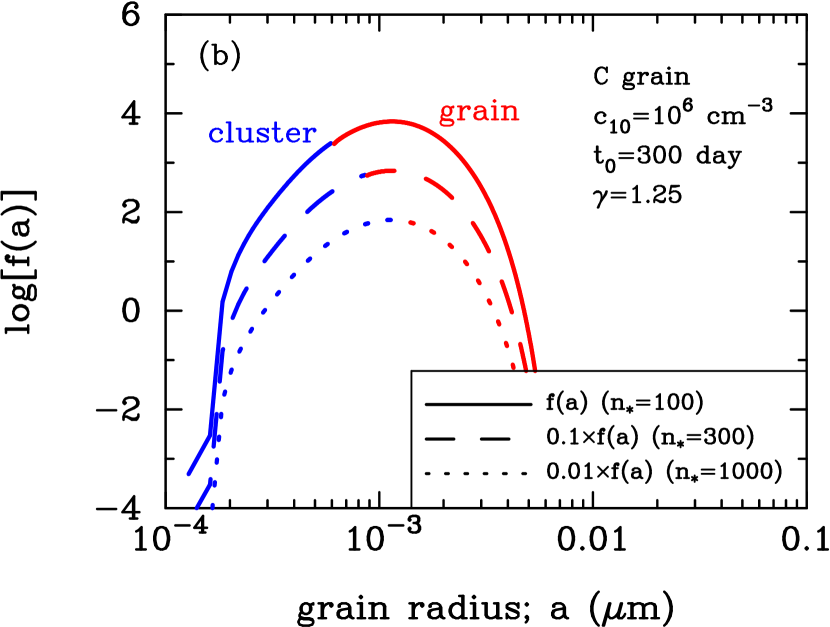
Figure 10(a) presents the time evolutions of the current , average grain radius , and condensation efficiency of C grains for , 300, and 1000 with cm-3, days, and . The figure shows that, as increases, the onset time of dust formation is slightly delayed, and the peak value of decreases. In addition, a larger leads to a smaller and a larger : and m for , while and m for . Thus, the formation process as well as the resulting properties of dust grains seems to depend on the adopted value of .
However, we recognize that the dependence of is superficial. As is seen from the final size distributions displayed in Figure 10(b), where the values for and 1000 are shifted down, respectively, by factors of 0.1 and 0.01 for clarity, the combined size distributions of clusters and grains are identical with each other, regardless of . It should be noted that this demonstrates that the change in does not influence the formation processes of clusters and grains themselves. The independence of the combined size distribution on can be understood as follows; the evolutions of and are the same for in all the three cases. On the other hand, for , the current density under the condition that , as can be seen from Equations (42) and (45). Thus, the combined size distribution can be expected to be independent of since, in the model considered here, is not depressed very much by the depletion of the key molecules due to grain growth. The increase in only enhances the minimal size of grains, which results in the reduced number of atoms finally locked in grains (that is, condensation efficiency) and the increased average radius of grains for the given combined size distribution of clusters and grains.
In conclusion, the change in does not vary the formation process of dust grains but affects the resulting condensation efficiency and average radius of grains. The value of is important only for dust formation at low gas densities where the average radius of newly formed grains is very small ( m), as is exemplified above. It should be kept in mind that, even if is enhanced from to 1000, the minimal size of grains is only increased by a factor of . We also note that small grains formed in the SN ejecta would be destroyed quickly by the passage of the reverse shock before being injected into the ISM (Nozawa et al. 2007, 2010; Silvia et al. 2010, 2012). Thus, when we consider the final mass of dust ejected from SNe, the uncertainty in the mass of small grains, resulting from the uncertainty in , could not be important.
References
- Abraham (1974) Abraham, F. F. 1974, Homogeneous Nucleation Theory, Academic Press, INC, New York
- Barlow et al. (2010) Barlow, M. J., Krause, O., Swinyard, B. M., et al. 2010, A&A, 518, L138
- Binchi & Schneider (2007) Bianchi, S., & Schneider, R. 2007, MNRAS, 378, 973
- Blander & Katz (1972) Blander, M., & Katz, J., 1972, J. Stat. Phys., 4, 55
- Cherchneff & Dwek (2009) Cherchneff, I., & Dwek, E. 2009, ApJ, 703, 642
- Chigai et al. (1999) Chigai, T., Yamamoto, T., & Kozasa, T. 1999, ApJ, 510, 999
- Clayton et al. (2013) Clayton, D. D. 2013, ApJ, 762, 5
- Clayton et al. (2001) Clayton, D. D., Deneault, E. A.-N., & Meyer, B. S. 2001, ApJ, 562, 480
- Clayton et al. (1999) Clayton, D. D., Liu, W., & Dalgarno, A. 1999, Science, 283, 1290
- Deneault et al. (2003) Deneault, E. A.-N., Clayton, D. D., & Heger, A. 2003, ApJ, 594, 312
- Dwek et al. (2007) Dwek, E., Galliano, F., & Jones, A. P. 2007, ApJ, 662, 927
- Donn & Nuth (1985) Donn, B., & Nuth, J. A. 1985, ApJ, 288, 187
- Fallest et al. (2011) Fallest, D. W., Nozawa, T., Nomoto, K., Umeda, H., Maeda, K., Kozasa, T., & Lazzati, D. 2011, MNRAS, 418, 571
- Ferrarotti & Gail (2001) Ferrarotti, A. S. & Gail, H.-P. 2001, A&A, 371, 133
- Gall et al. (2011) Gall, C., Hjorth, J., & Andersen, A. C. 2011, ARA&A, 19, 43
- Gomez et al. (2012) Gomez, H. L., Krause, O., Barlow, M. J., et al. 2012, ApJ, 760, 96
- Goumans & Bromley (2012) Goumans, T. P. M., & Bomley, S. T. 2012, MNRAS, 420, 3344
- Hasegawa & Kozasa (1988) Hasegawa, H., & Kozasa, T. 1988, Prog. Theor. Phys. Suppl., 96, 107
- Keith & Lazzati (2011) Keith, A. C., & Lazzati, D. 2011, MNRAS, 410, 685
- Kotak et al. (2009) Kotak, R., Meikle, W. P. S., Farrah, D., et al. 2009, ApJ, 704, 306
- Kozasa et al. (1996) Kozasa, T., Dorschner, J., Henning, Th., & Stognienko, R. 1996, A&A, 307, 551
- Kozasa & Hasegawa (1987) Kozasa, T., & Hasegawa, H. 1987, Prog. Theor. Phys., 77, 1402
- Kozasa & Hasegawa (1988) Kozasa, T., & Hasegawa, H. 1988, Icarus, 73, 180
- Kozasa et al. (1989) Kozasa, T., Hasegawa, H., & Nomoto, K. 1989, ApJ, 344, 325
- Kozasa et al. (1991) Kozasa, T., Hasegawa, H., & Nomoto, K. 1991, A&A, 249, 474
- Kozasa & Sogawa (1997) Kozasa, T., & Sogawa, H. 1997 Ap&SS, 251, 165
- Kozasa & Sogawa (1998) Kozasa, T., & Sogawa, H. 1998 Ap&SS, 255, 437
- Lakićević et al. (2012) Lakićević, M., van Loon, J. Th., Stanke, T., De Breck, C., & Patat, F. 2012, A&A, 541, L1
- Landau & Lifshitz (1976) Landau, L. D., & Lifshitz, E. M. 1976, Statistical Physics, 3rd Edition, Part 1, Pergamon Press, Oxford
- Liu & Dalgarno (1994) Liu, W., & Dalgarno, A. 1994, ApJ, 428, 769
- Liu & Dalgarno (1996) Liu, W., & Dalgarno, A. 1996, ApJ, 471, 780
- Maeda et al. (2013) Maeda, K., Nozawa, T., Sahu, D. K., et al. 2013, ApJ, accepted
- Matsuura et al. (2011) Matsuura, M., Dwek, E., Meixner, M., et al. 2011, Science, 333, 1258
- Nozawa et al. (2008) Nozawa, T., Kozasa, T., Tominaga, N., et al. 2008, ApJ, 684, 1343
- Nozawa et al. (2006) Nozawa, T., Kozasa, T., & Habe, A. 2006, ApJ, 648, 435
- Nozawa et al. (2007) Nozawa, T., Kozasa, T., Habe, A., Dwek, E., Umeda, H., Tominaga, N., Maeda, K., & Nomoto, K. 2007, ApJ, 666, 955
- Nozawa et al. (2010) Nozawa, T., Kozasa, T., Tominaga, N., Maeda, K., Umeda, H., Nomoto, K., & Krause, O. 2010, ApJ, 713, 356
- Nozawa et al. (2003) Nozawa, T., Kozasa, T., Umeda, H., Maeda, K., & Nomoto, K. 2003, ApJ, 598, 785
- Nozawa et al. (2011) Nozawa, T., Maeda, K., Kozasa, T., Tanaka, M., Nomoto, K. & Umeda, H. 2011, ApJ, 736, 45
- Paquette & Nuth. (2011) Paquette, J. A., & Nuth, J. A. 2011, ApJ, 737, L6
- Sibthorpe et al. (2010) Sibthorpe, B., Ade, P. A. R., Bock, J. J., et al. 2010, ApJ, 719, 1553
- Silvia et al. (2010) Silvia, D. W., Smith, B. D., & Shull, J. M. 2010, ApJ, 715, 1575
- Silvia et al. (2012) Silvia, D. W., Smith, B. D., & Shull, J. M. 2012, ApJ, 748, 12
- Todini & Ferrara (2001) Todini, P., & Ferrara, A. 2001, MNRAS, 325, 726
- Yamamoto et al. (2001) Yamamoto, T., Chigai, T., Watanabe, S., & Kozasa, T. 2001, A&A, 380, 373
- Yasuda & Kozasa (2012) Yasuda, Y., & Kozasa, T. 2012, ApJ, 745, 159
- Zhukovska et al. (2008) Zhukovska, S., Gail, H.-P., & Trieloff, M. 2008, A&A, 479, 453
| C | MgSiO3 | |
|---|---|---|
| (m) | ||
| 0.854 | 0.871 | |
| 4.15 | 6.38 | |
| 1.91 | 2.17 | |
| 0.088 | 0.049 |
Note. — The minimal radius of bulk grain is for the number of constituent monomer .