The X-ray properties of the black hole transient MAXI J1659–152 in quiescence
Abstract
We present new Chandra X-ray observations of the transient black hole X-ray binary \maxi in quiescence. These observations were made more than one year after the end of the source’s 2010–2011 outburst. We detect the source at a 0.5–10 keV flux of erg s-1 cm-2, which corresponds to a luminosity of erg s-1. This level, while being the lowest at which the source has been detected, is within factors of 2 of the levels seen at the end of the initial decay of the outburst and soon after a major reflare of the source. The quiescent luminosity of \maxi, which is the shortest-orbital-period black hole X-ray binary (2.4 hr), is lower than that of neutron-star X-ray binaries with similar periods. However, it is higher than the quiescent luminosities found for black hole X-ray binaries with orbital periods 2–4 times longer. This could imply that a minimum quiescent luminosity may exist for black hole X-ray binaries, around orbital periods of 5–10 hr, as predicted by binary-evolution models for the mass transfer rate. Compared to the hard state we see a clear softening of the power-law spectrum in quiescence, from an index of 1.55(4) to an index of 2.5(4). We constrain the luminosity range in which this softening starts to – ( () , which is consistent with the ranges inferred for other sources.
Subject headings:
accretion, accretion disks – X-rays: binaries – X-rays: individual (\maxi)1. Introduction
Low-mass X-ray binaries (LMXBs) are systems in which a low-mass donor star transfers mass via Roche-lobe overflow onto a neutron star (NS) or black hole (BH). Many of the LMXBs are transient systems. These transients undergo occasional outbursts during which they typically reach peak luminosities of 0.01–1 times the Eddington luminosity (), but they spend most of their time in quiescence, with much lower luminosities. Here we adopt the definition of quiescence (for BH LMXBs) by Plotkin et al. (2013), . We note that finding a source at does not necessarily mean that a source is detected at its minimum quiescent luminosity, as sources have been found with as low as a few times (Garcia et al., 2001). The nature of the accretion flow in quiescence is still a matter of debate. Proposed explanations for the very low quiescent luminosities include radiatively inefficient flows (Narayan & Yi, 1994) and low net accretion rates in the inner regions as the result of disk winds (Blandford & Begelman, 1999) or jets (Fender et al., 2003).
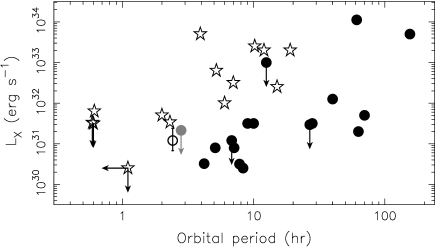
In the last decade, the high sensitivities of Chandra and XMM-Newton have opened up the possibility of detailed X-ray studies of quiescent LMXBs down to Eddington ratios as low as (Garcia et al., 2001; Hameury et al., 2003). These observations have revealed that, when comparing LMXBs with similar orbital periods (), quiescent NS systems have on average higher luminosities than quiescent BH systems, by factors of 10–100 (Garcia et al., 2001). This can clearly be seen in Figure 1. It is important to consider systems with the same ; at a given BH and NS LMXBs are assumed to have similar quiescent mass accretion rates (Menou et al., 1999). Expected mass transfer rates for quiescent BHs and NSs were calculated by Menou et al. (1999), and they showed that for quiescent LMXBs there should exist a minimum mass transfer rate that stems directly from the existence of a bifurcation orbital period, . Below this period the mass transfer is driven by gravitational wave radiation and above it, it is dominated by the nuclear evolution of the secondary star. Specifically, the mass transfer rate increases with decreasing orbital period below , while it increases with above . For a wide range of donor masses, the results of Menou et al. (1999) imply 5–10 hr for BHs and 3–5 hr for NSs.
The luminosity difference between quiescent BH and NS LMXBs has been interpreted as evidence for the presence of an event horizon in BH LMXBs (Garcia et al., 2001), although it may also be the result of jet-dominated states in quiescent BH LMXBs (Fender et al., 2003). Interestingly, the lowest-luminosity quiescent source currently known ( erg s-1) is an NS LMXB, 1H 1905+000 (Jonker et al., 2007). However, this source is likely an ultra-compact with an orbital period less than 80 minutes (Jonker et al., 2006), and therefore falls in a range (4 hr) in which, until recently, no quiescent BH LMXBs had been observed.
Another result of the Chandra and XMM-Newton observations of quiescent LMXBs concerns the nature of the quiescent accretion flow in BH systems.The quiescent state of BH LMXBs has often been considered a low-luminosity extension of the so-called low-hard state. Indeed, in terms of radio/X-ray flux correlations, which likely trace the evolution of the accretion (in)flow and/or jet outflow, quiescent BH LMXBs appear to follow the main relation seen in the low-hard state (Gallo et al., 2006, 2012). However, recent observations suggest that in terms of X-ray spectral shape considerable evolution occurs in the accretion flow as some sources approach quiescence (Corbel et al., 2006), with spectral power-law photon indices that are steeper (2.2–2.5) than those seen in the low-hard state (1.5). A recent study of the quiescent spectra of ten BH LMXBs by Plotkin et al. (2013) suggests that, once these sources reach , their spectra saturate at power-law indices of . Based on their findings Plotkin et al. (2013) argue that quiescence does not appear to represent a distinct spectral state separated from the low-hard state. Several mechanisms could be responsible for the observed steepening toward quiescence, such as, e.g., a non-linear dependence of mass accretion rate on the inner-disk radius, as expected in the presence of outflows (see discussion in Corbel et al., 2006), changes in the properties of a Comptonizing corona (Tomsick et al., 2004; Sobolewska et al., 2011), or the jet’s cooling break shifting through the X-ray band (Plotkin et al., 2013).
In this paper we present Chandra observations of \maxi, an X-ray transient that was discovered in 2010 September with the Swift Burst Alert Telescope (Mangano et al., 2010). Although it was originally thought to be a gamma-ray burst, optical spectra obtained with the Very Large Telescope/X-shooter (de Ugarte Postigo et al., 2010) and X-ray observations with RXTE (Kalamkar et al., 2010) strongly suggested that \maxi is an LMXB with a BH primary. During an outburst in 2010/2011 that lasted more than nine months, the source was extensively observed with various X-ray (Kalamkar et al., 2011; Muñoz-Darias et al., 2011; Yamaoka et al., 2012), optical/near-infrared (Russell et al., 2010b; Kaur et al., 2012) and radio observatories (van der Horst et al., 2011; Miller-Jones et al., 2011; Paragi et al., 2013). These observations revealed that the source made several state transitions and showed behavior similar to that seen in many other transient BH LMXBs. The distance to \maxi has been estimated using various methods, with a most likely range of 4.5–8.5 kpc (Kennea et al., 2011; Kaur et al., 2012; Kong, 2012; Kuulkers et al., 2013; Jonker et al., 2012). Following Jonker et al. (2012), we adopt a distance of 6 kpc in this paper.
XMM-Newton and Swift observations made during the rise and maximum of the outburst revealed the presence of dips in the X-ray light curves, from which an orbital period of 2.4140.005 hr was derived (Kuulkers et al., 2013; Kennea et al., 2011). This makes \maxi the BH LMXB with the shortest known orbital period. Such a short orbital period is of particular interest to one of the issues described earlier: the difference between NS and BH quiescent luminosities at low .
was already observed with Chandra during the initial decay of its outburst, a subsequent three-month reflare, and soon after the source appeared to have reached quiescence. The results of these observations were reported by Jonker et al. (2012). They found the source in a quiescent state during most of their observations. The minimum quiescent luminosity of \maxi was determined from two observations taken shortly after the reflare; it falls at the high end of what is expected for its orbital period (assuming a distance of 6 kpc), although it is still fainter than quiescent NS LMXBs with similar values. One explanation for this higher than expected luminosity could be that at the time of the last Chandra observations the source still had not reached its minimum quiescent luminosity. The new Chandra observations presented here were made about a year after the source had entered quiescence. They allow us to test whether the quiescent luminosity reported by Jonker et al. (2012) was close to a minimum luminosity, or if the source had declined even further. We also present a more detailed study of the spectral softening in \maxi.
2. Observations and data analysis
has been observed eight times with Chandra. A log of the observations can be found in Table 1. All observations were made with the back-illuminated S3 CCD chip of the Advanced CCD Imaging Spectrometer (ACIS; Garmire et al., 2003). The first six observations were already analyzed by Jonker et al. (2012). Two new observations, made in 2012 July, were added to the analysis presented in this work. Observations 6–8 were made in VFAINT mode, which allows for better background cleaning, while the others were made in FAINT mode. All observations were analyzed using CIAO 4.4, CALDB 4.5.5.1, and ACIS Extract version 2012nov1 (Broos et al., 2010). As a first step, the chandrarepro script was run to reprocess the data from all the observations. The data were checked for episodes of enhanced background, but none were found. Images in the 0.5–7.0 keV band were extracted for each observation to search for extended emission. Further analysis was performed with the help of ACIS Extract.
| Obs. No. | Obs-ID | Start Date/Time | Exposure | Net Count Rate | Fluxa | Goodness | |
|---|---|---|---|---|---|---|---|
| (UT) | (ks) | 0.3–7 keV (counts s-1) | (erg s-1 cm-2) | (%) | |||
| 1 | 12438 | 2011 Apr 14 23:05:18 | 6.4 | 1.87(12) | 0.1 | ||
| 2 | 12439 | 2011 Apr 23 17:59:11 | 9.1 | 1.8(2) | 0.9 | ||
| 3 | 12440 | 2011 May 03 07:09:45 | 13.6 | 2.5(4)b | 2.5b | ||
| 4 | 12441 | 2011 May 12 05:03:10 | 18.1 | 1.55(4)c | 34 | ||
| 5 | 12442 | 2011 Aug 15 19:59:16 | 30.8 | 2.5(4)b | 2.5b | ||
| 6 | 12443 | 2011 Oct 12 12:45:46 | 90.7 | 2.5(4)b | 2.5b | ||
| 7 | 14454 | 2012 Jul 03 00:52:46 | 39.4 | 2.5(4)b | 2.5b | ||
| 8 | 13731 | 2012 Jul 07 02:50:23 | 35.5 | 2.5(4)b | 2.5b | ||
| 7+8 |
Notes. Errors on the fit parameters reflect the 1 uncertainties.
aUnabsorbed flux in the 0.5–10 keV band.
bThese observations were fitted together with power-law indices linked.
cPile-up model parameter alpha is 0.11 0.10.
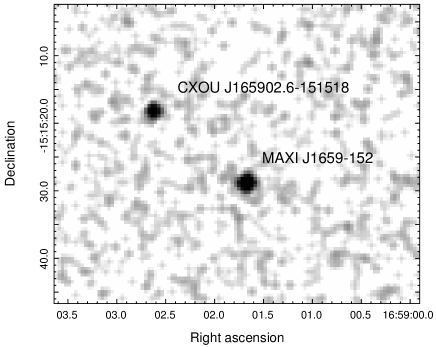
Source spectra were extracted from near-circular polygon-shaped regions modeled on the Chandra ACIS point-spread function (PSF). The source extraction regions had a PSF enclosed energy fraction of 0.97 (for a photon energy of 1.5 keV) and a radius of 19, except for the extraction region for observation 4, which had an enclosed energy fraction of 0.98 and a radius of 27 (due to the higher count rate). For the background extraction regions we used annuli centered around the source, with inner radii of 44 (22″ for observation 4) and outer radii of 24–25″ (455 for observation 4). A circular region with a radius of 43 centered around the source to the north-east of \maxi (CXOU J165902.6–151518; see Figure 2) was excluded from the background region. For observation 4 we excluded an additional 10″80″ rectangle surrounding the read-out streak from the background region. Response files were created using the mkacisrmf and mkarf tools in CIAO.
The spectra were fitted in the 0.3–7.0 keV range with XSPEC 12.7.1 (Arnaud, 1996). Given the low number of source counts per spectrum (as low as 10), we used the C statistic (Cash, 1979), modified to account for the subtraction of background counts, the so-called W statistic. The spectra were grouped to at least one photon per spectral bin. Following Jonker et al. (2012) all spectra were fitted with an absorbed power law (tbabs*pegpwrlw in XSPEC), with the abundances set to wilm and the cross sections set to vern. Because of high count rates (see Table 1), for observation 4 we also added the pile-up model of Davis (2001).
The was first determined from fits to the spectrum of observation 4, which had the highest number of counts, and subsequently it was fixed in all spectral fits. We obtained a value of 0.33(2) atoms cm-2, which is somewhat higher than the value of 0.23 atoms cm-2 used by Jonker et al. (2012) (see also Kennea et al., 2011).
To put to our Chandra observations in the context of the full outburst decay, we also constructed a 0.3–10 keV light curve from archival Swift/XRT observations, using the online Swift/XRT data products generator111http://www.swift.ac.uk/user_objects/ (Evans et al., 2009). For our Chandra observations, corresponding Swift/XRT 0.3–10 keV count rates were calculated from our Chandra spectra, by simulating Swift/XRT spectra based on the best-fit model parameters and using Swift/XRT response files.
3. Results
All the 0.5–7 keV band images were visually inspected for possible features close to \maxi that could be related to jet outflows, such as those seen in XTE J1550–564 (Corbel et al., 2003), H 1743–322 (Corbel et al., 2005), and possibly XTE J1752–223 (Ratti et al., 2012). None could be seen. We also created a combined image from 7 of the 8 observations to increase sensitivity; observation 4 was excluded from this because of the prominent read-out streak. The total exposure time for the resulting image, which is shown in Figure 2, is 219 ks. Again, no obvious jet-related structures could be identified.
Table 1 lists the results of our spectral fits. Since they had similar count rates, the spectra of observations 3 and 5–8 were fitted simultaneously with their power-law indices tied, as the power-law indices would otherwise be poorly constrained; the normalizations were left free to vary independently. The unabsorbed 0.5–10 keV fluxes measured during the two new Chandra observations (7 and 8) of \maxi are erg s-1 cm-2 and erg s-1 cm-2. Since observations 7 and 8 were taken only a few days apart, we also made a fit with the normalizations of the power-law component tied, which resulted in a flux of erg s-1 cm-2. We find power-law indices between 1.5 and 2.5. There appears to be a correlation between the slope of the power law and the flux, as can be seen from Table 1 and Figure 3; the power law steepens as the flux decreases. A fit to the spectral index versus flux relation in Figure 3 with a constant index is significantly worse (/dof=14.1/3) than one with a power-law (/dof=1.00/2). We note that the power-law indices reported here are somewhat higher than the values reported in Jonker et al. (2012), although they are consistent at the 1 level individually. This is likely the result of our much smaller source extraction regions (2″instead of 10″) and the higher value that we used in our fits.
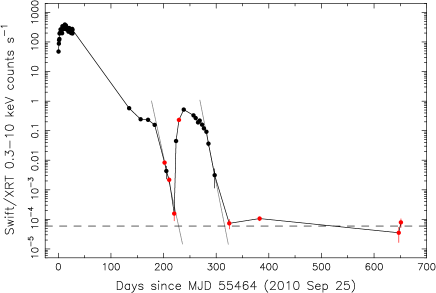
In Figure 4 we show the combined Swift and Chandra light curve of \maxi. The Chandra data are shown in red. The dashed horizontal line shows the count rate level corresponding to the average flux in the last two Chandra observations. Around day 200 \maxi showed an initial decline towards quiescence. This decline was rapid, with an exponential decay time scale of 5.30.3 days (fitted to the first three Chandra observations, plus the Swift observation near day 200). The best-fit exponential decay is shown as a gray diagonal line. The source had nearly reached the quiescent level at the time of the third Chandra observation. However, shortly thereafter it showed a nearly 90-day reflare (Yang & Wijnands, 2011), during which the flux went up by a factor of 3000. The second decay was rapid as well; a fit to the two Swift data points before the fifth Chandra observation yields an exponential decay time scale of 4.8 0.9 days, hence the -folding times are consistent with being the same.

4. Discussion
We have presented an analysis of Chandra observations of \maxi. Two new observations were analyzed in addition to the earlier six presented in Jonker et al. (2012) and Plotkin et al. (2013). These two observations were made more than 320 days after the end of the reflare that was observed at the end of the outburst of \maxi (see Figure 4). While the flux of observations 7/8 is the lowest value observed in the quiescent state of \maxi, it is consistent (within 1 errors) with the value measured in observation 5, which was taken close to the end of the reflare. The flux of observation 6 was also within a factor of two of the flux seen in observations 7/8. The five lowest fluxes seen with Chandra (obs. 3, 5, 6, 7+8) all fall within a factor of 2.5 of each other. Combined with the fact that these fluxes were measured over a time span of 430 days, this suggests that this flux range (2.8(8)–7(3) erg s-1 cm-2) represents a relatively stable (within a factor of 2.5) minimum quiescent flux for \maxi.
The average flux of observations 7/8 translates into a 0.5–10 keV luminosity of ( erg s-1, where the distance is likely in the range 4.5–8.5 kpc (see Section 1). In Figure 1 we show the quiescent luminosities of NS (stars) and BH LMXBs (circles) as a function of ; \maxi is shown as an open circle. As can be seen from this figure there is a clear correlation between the quiescent luminosities of BH LMXBs and their , although there is substantial scatter. The quiescent luminosity of \maxi is relatively high compared to some of the systems in the range of 4.2–8.3 hr. This would still be true had we assumed a distance of 4.5 kpc, which would imply a luminosity of 6.8 erg s-1. As mentioned in Section 1, the mechanism that drives the mass accretion in quiescence is expected to switch from gravitational-wave losses to evolution of the secondary star around a of 5–10 hr in BH LMXBs, depending on the mass of the secondary (Menou et al., 1999). As a result, the lowest quiescent BH luminosities are expected to be found in systems with a around 5–10 hr. Based on the data presented in their paper, Gallo et al. (2008) already suggested that such a minimum may exist at a limiting luminosity of a few times 1030 erg s-1. Although the number of systems with of a few hours is still very small, the relatively high quiescent luminosity of \maxi, the shortest system, may be a further sign of the existence of a minimum quiescent luminosity for BH LMXBs, in a range consistent with that implied (5–10 hr) by the work of Menou et al. (1999).
Additional support for the existence of a minimum quiescent luminosity for BH LMXBs may come from Swift J1357.2–0933, a very faint X-ray transient discovered in early 2011 (Krimm et al., 2011). This system likely contains a BH (Armas Padilla et al., 2013) and has a short orbital period of 2.8 hr (Corral-Santana et al., 2013). A Swift/XRT observation at the end of the outburst, when the source was returning to or had returned to quiescence, yielded an upper limit on the 0.5–10 keV luminosity of 2 erg s-1 (Armas Padilla et al., 2013), for a distance of 1.5 kpc (Rau et al., 2011). Swift J1357.2–0933 is shown as the gray data point in Figure 1. This upper limit is close to the quiescent luminosity of \maxi, and about a decade higher than one would expect based on extrapolating the general trend seen for BH systems above = 4 hr.
Figure 3 shows a steepening of the spectrum as the flux decreases. This has previously been seen in other sources (Corbel et al., 2006; Plotkin et al., 2013), but our observations of \maxi present one of the clearest examples of spectral softening as a source recedes into quiescence. Our Chandra observations of \maxi allow us to set constraints on the luminosity level at which this softening starts. In observation 4, which showed the highest luminosity of our observations, the power-law index was found to be 1.55(4), which is consistent with the indices seen in the hard state at the end of the outburst of \maxi (Yamaoka et al., 2012). In the second brightest observation (nr. 1), the index was already significantly higher at 1.87(12). It is therefore likely that in \maxi the spectral softening started between 0.5–10 keV fluxes of erg s-1 cm-2 (obs. 1) and erg s-1 cm-2 (obs. 4). This corresponds to fractional Eddington luminosities222We use an Eddington luminosity of 1.3 () erg s-1. of (0.18–6.2)( (). For XTE J1550–564 Corbel et al. (2006) report an average power-law index of 2.25(8) in the 0.5–10 keV flux range of (7–94) erg s-1 cm-2. For a distance of 4.38 kpc and a BH mass of 9.1 (Orosz et al., 2011) this implies that the softening in XTE J1550–564 must have started above a fractional Eddington luminosity of 1.8. In H 1743–322 an index of 2.2(6) was measured by Corbel et al. (2006) at a 0.5–10 keV flux of 5.0(7) erg s-1 cm-2. For a distance of 8.5 kpc (Steiner et al., 2012) this implies that the softening must have started above a fractional Eddington luminosity of 4.2 (). Combining Chandra data from ten quiescent BHs (including the ones discusses above), Plotkin et al. (2013) find that softening is already ongoing around and plateaus around , similar to the range we find for \maxi.
There are also various reports of softening of X-ray spectra toward quiescence based on RXTE data (see, e.g., Tomsick et al., 2001; Wu & Gu, 2008; Dincer et al., 2008; Russell et al., 2010a; Sobolewska et al., 2011). These authors report that softening already starts at luminosities of , which is much higher than the luminosity range implied by \maxi. However, in several of these works (Tomsick et al., 2001; Russell et al., 2010a; Sobolewska et al., 2011) the spectra were not corrected for Galactic ridge emission, which provides a natural explanation for the observed softening; the Galactic ridge emission can be fitted with a power law with an index of 2.14 (Revnivtsev, 2003), and an even higher index when an absorbed power law is used. Simulations that we performed suggest that a ridge contribution of as little as 5% can already result in detectable softening in a typical RXTE observation. In other works (Wu & Gu, 2008; Dincer et al., 2008) attempts were made to correct the spectra for the Galactic ridge emission. We inspected Swift/XRT archival data of GRO J1655–40 (Homan et al., 2005), GX 339–4, and H 1743–332 (both this work), taken around the same time as the RXTE data, or covering the same luminosity range; these data show no evidence for spectral softening occurring around . Moreover, at a few times Wu & Gu (2008) find a range of indices (with RXTE) that is substantially higher (1.7–2.5) then the average index found at a few times with Chandra (; Plotkin et al., 2013). We therefore suspect that the reports of spectral softening based on RXTE data may not be reliable and they should therefore be regarded with some caution.
As mentioned in Section 1, the softening of spectra in quiescence can be explained by a variety of models. Quiescent spectra are generally not of sufficient quality for accurate spectral modeling (beyond a simple power law) and it is therefore difficult to test (and distinguish between) competing models for quiescent accretion flows. However, the observed softening (and its relation with luminosity) can possibly be used for this purpose. For example, Ball et al. (2001) showed that for convection-dominated accretion flows the softening in quiescence is expected to occur at luminosities below , whereas our work shows that softening already starts at luminosities 20–600 times higher.
The outburst light curve in Figure 4 shows that \maxi had almost reached quiescence around day 220. However, a major reflare, during which the luminosity increased by a factor of 3000, occurred soon after. While reflares (or secondary maxima) near the end of an outburst are not uncommon (see, e.g., Chen et al., 1993; Tomsick et al., 2004; Russell et al., 2012), the magnitude of this reflare appears to be unusually high. This may be partly due to fact that the secondary maximum is well separated from the main outburst by a brief period of near-quiescence, whereas in other systems it occurred during (the decay of) the main outburst phase. Given the short orbital period of the system it is possible that the secondary had undergone substantial X-ray heating of its outer layers, possibly resulting in a temporary increase in the mass transfer rate (see, e.g., Augusteijn et al., 1993).
Finally, during its outburst \maxi showed spectral and timing signatures (Kalamkar et al., 2011) that suggested that the source had crossed the so-called “jet line” (Fender et al., 2009) during its transition from the hard state to softer spectral states. Such crossings have been associated with major ejection events, which are observed in the radio, but also on occasion in X-rays. Although the outburst of \maxi has been monitored densely in radio, no radio flares were observed around the time at which \maxi crossed the jet line (Paragi et al., 2013). Our deep Chandra images of \maxi do not reveal any indications for a major ejection event in X-rays either.
References
- Armas Padilla et al. (2013) Armas Padilla, M., Degenaar, N., Russell, D. M., & Wijnands, R. 2013, MNRAS, 428, 3083
- Arnaud (1996) Arnaud, K. A. 1996, in Astronomical Society of the Pacific Conference Series, Vol. 101, Astronomical Data Analysis Software and Systems V, ed. G. H. Jacoby & J. Barnes, 17
- Augusteijn et al. (1993) Augusteijn, T., Kuulkers, E., & Shaham, J. 1993, A&A, 279, L13
- Ball et al. (2001) Ball, G. H., Narayan, R., & Quataert, E. 2001, ApJ, 552, 221
- Blandford & Begelman (1999) Blandford, R. D., & Begelman, M. C. 1999, MNRAS, 303, L1
- Broos et al. (2010) Broos, P. S., Townsley, L. K., Feigelson, E. D., et al. 2010, ApJ, 714, 1582
- Cash (1979) Cash, W. 1979, ApJ, 228, 939
- Chen et al. (1993) Chen, W., Livio, M., & Gehrels, N. 1993, ApJ, 408, L5
- Corbel et al. (2003) Corbel, S., Fender, R. P., Tzioumis, A. K., et al. 2003, Nature, 47, 477
- Corbel et al. (2005) Corbel, S., Kaaret, P., Fender, R. P., et al. 2005, ApJ, 632, 504
- Corbel et al. (2006) Corbel, S., Tomsick, J. A., & Kaaret, P. 2006, ApJ, 636, 971
- Corral-Santana et al. (2013) Corral-Santana, J. M., Casares, J., Muñoz-Darias, T., et al. 2013, Science, 339, 1048
- Davis (2001) Davis, J. E. 2001, ApJ, 562, 575
- de Ugarte Postigo et al. (2010) de Ugarte Postigo, A., Flores, H., Wiersema, K., et al. 2010, GRB Coordinates Network, 11307
- Dincer et al. (2008) Dincer, T., Kalemci, E., Tomsick, J. A., & Buxton, M. 2008, in Microquasars and Beyond
- Evans et al. (2009) Evans, P. A., Beardmore, A. P., Page, K. L., et al. 2009, MNRAS, 397, 1177
- Fender et al. (2003) Fender, R. P., Gallo, E., & Jonker, P. G. 2003, MNRAS, 343, L99
- Fender et al. (2009) Fender, R. P., Homan, J., & Belloni, T. M. 2009, MNRAS, 396, 1370
- Gallo et al. (2006) Gallo, E., Fender, R. P., Miller-Jones, J. C. A., et al. 2006, MNRAS, 370, 1351
- Gallo et al. (2008) Gallo, E., Homan, J., Jonker, P. G., & Tomsick, J. A. 2008, ApJ, 683, L51
- Gallo et al. (2012) Gallo, E., Miller, B. P., & Fender, R. 2012, MNRAS, 423, 590
- Garcia et al. (2001) Garcia, M. R., McClintock, J. E., Narayan, R., et al. 2001, ApJ, 553, L47
- Garmire et al. (2003) Garmire, G. P., Bautz, M. W., Ford, P. G., Nousek, J. A., & Ricker, Jr., G. R. 2003, in SPIE Conference Series, ed. J. E. Truemper & H. D. Tananbaum, Vol. 4851, 28–44
- Hameury et al. (2003) Hameury, J.-M., Barret, D., Lasota, J.-P., et al. 2003, A&A, 399, 631
- Homan et al. (2005) Homan, J., Kong, A., Tomsick, J., et al. 2005, The Astronomer’s Telegram, 644
- Jonker et al. (2006) Jonker, P. G., Bassa, C. G., Nelemans, G., et al. 2006, MNRAS, 368, 1803
- Jonker et al. (2012) Jonker, P. G., Miller-Jones, J. C. A., Homan, J., et al. 2012, MNRAS, 423, 3308
- Jonker et al. (2007) Jonker, P. G., Steeghs, D., Chakrabarty, D., & Juett, A. M. 2007, ApJ, 665, L147
- Kalamkar et al. (2011) Kalamkar, M., Homan, J., Altamirano, D., et al. 2011, ApJ, 731, L2
- Kalamkar et al. (2010) Kalamkar, M., Yang, Y., Altamirano, D., et al. 2010, The Astronomer’s Telegram, 2881
- Kaur et al. (2012) Kaur, R., Kaper, L., Ellerbroek, L. E., et al. 2012, ApJ, 746, L23
- Kennea et al. (2011) Kennea, J. A., Romano, P., Mangano, V., et al. 2011, ApJ, 736, 22
- Kong (2012) Kong, A. K. H. 2012, ApJ, 760, L27
- Krimm et al. (2011) Krimm, H. A., Barthelmy, S. D., Baumgartner, W., et al. 2011, The Astronomer’s Telegram, 3138
- Kuulkers et al. (2013) Kuulkers, E., Kouveliotou, C., Belloni, T., et al. 2013, A&A, 552, A32
- Mangano et al. (2010) Mangano, V., Hoversten, E. A., Markwardt, C. B., et al. 2010, GRB Coordinates Network, 11296
- Menou et al. (1999) Menou, K., Esin, A. A., Narayan, R., et al. 1999, ApJ, 520, 276
- Miller-Jones et al. (2011) Miller-Jones, J. C. A., Madej, O. K., Jonker, P. G., et al. 2011, The Astronomer’s Telegram, 3358
- Muñoz-Darias et al. (2011) Muñoz-Darias, T., Motta, S., Stiele, H., & Belloni, T. M. 2011, MNRAS, 415, 292
- Narayan & Yi (1994) Narayan, R., & Yi, I. 1994, ApJ, 428, L13
- Orosz et al. (2011) Orosz, J. A., Steiner, J. F., McClintock, J. E., et al. 2011, ApJ, 730, 75
- Paragi et al. (2013) Paragi, Z., van der Horst, A. J., Belloni, T., et al. 2013, MNRAS, 432, 1319
- Plotkin et al. (2013) Plotkin, R. M., Gallo, E., & Jonker, P. G. 2013, ApJ, 773, 59
- Ratti et al. (2012) Ratti, E. M., Jonker, P. G., Miller-Jones, J. C. A., et al. 2012, MNRAS, 423, 2656
- Rau et al. (2011) Rau, A., Greiner, J., & Filgas, R. 2011, The Astronomer’s Telegram, 3140
- Rea et al. (2011) Rea, N., Jonker, P. G., Nelemans, G., et al. 2011, ApJ, 729, L21
- Revnivtsev (2003) Revnivtsev, M. 2003, A&A, 410, 865
- Reynolds & Miller (2011) Reynolds, M. T., & Miller, J. M. 2011, ApJ, 734, L17
- Russell et al. (2010a) Russell, D. M., Maitra, D., Dunn, R. J. H., & Markoff, S. 2010a, MNRAS, 405, 1759
- Russell et al. (2010b) Russell, D. M., Lewis, F., Bersier, D., et al. 2010b, The Astronomer’s Telegram, 2884
- Russell et al. (2012) Russell, D. M., Curran, P. A., Muñoz-Darias, T., et al. 2012, MNRAS, 419, 1740
- Sobolewska et al. (2011) Sobolewska, M. A., Papadakis, I. E., Done, C., & Malzac, J. 2011, MNRAS, 417, 280
- Steiner et al. (2012) Steiner, J. F., McClintock, J. E., & Reid, M. J. 2012, ApJ, 745, L7
- Tomsick et al. (2001) Tomsick, J. A., Corbel, S., & Kaaret, P. 2001, ApJ, 563, 229
- Tomsick et al. (2004) Tomsick, J. A., Kalemci, E., & Kaaret, P. 2004, ApJ, 601, 439
- van der Horst et al. (2011) van der Horst, A. J., Kouveliotou, C., Paragi, Z., et al. 2011, in AAS/High Energy Astrophysics Division, Vol. 12, 13.12
- Wu & Gu (2008) Wu, Q., & Gu, M. 2008, ApJ, 682, 212
- Yamaoka et al. (2012) Yamaoka, K., Allured, R., Kaaret, P., et al. 2012, PASJ, 64, 32
- Yang & Wijnands (2011) Yang, Y. J., & Wijnands, R. 2011, The Astronomer’s Telegram, 3379