DIGIT survey of far-infrared lines from protoplanetary discs: II. CO ††thanks: Herschel is an ESA space observatory with science instruments provided by European-led Principal Investigator consortia and with important participation from NASA.
CO is an important component of a protoplanetary disc as it is one of the most abundant gas phase species. Furthermore, observations of the CO transitions can be used as a diagnostic of the gas, tracing conditions in both the inner and outer disc. We present Herschel/PACS spectroscopy of a sample of 22 Herbig Ae/Be (HAEBEs) and 8 T Tauri stars (TTS), covering the pure rotational CO transitions from = 14 13 up to = 49 48. CO is detected in only 5 HAEBEs, AB Aur, HD 36112, HD 97048, HD 100546 and IRS 48, and in 4 TTS, AS 205, S CrA, RU Lup, and DG Tau. The highest transition seen is = 36 35, with of 3669 K, detected in HD 100546 and DG Tau. We construct rotational diagrams for the discs with at least 3 CO detections to derive , and find average temperatures of 270 K for the HAEBEs and 485 K for the TTS. HD 100546 requires an extra temperature component with 900-1000 K, suggesting a range of temperatures in its disc atmosphere, consistent with thermo-chemical disc models. In HAEBEs, the objects with CO detections all have flared discs in which the gas and dust are thermally decoupled. We use a small model grid to analyse our observations and find that an increased amount of flaring means higher line flux, as it increases the mass in warm gas. CO is not detected in our flat discs as the emission is below the detection limit. We find that HAEBE sources with CO detections have high and strong PAH emission, again connected to the heating of the gas. In TTS, the objects with CO detections are all sources with evidence for a disc wind or outflow. For both groups of objects, sources with CO detections generally have high UV luminosity (either stellar in HAEBEs or due to accretion in TTS), but this is not a sufficient condition for the detection of the far-IR CO lines.
Key Words.:
Stars – infrared, Astrochemistry, Line: identification, Protoplanetary discs1 Introduction
It is firmly established that circumstellar discs around young stars are sites of planet formation. During the first 10 Myr, the initially gas-rich disc will first evolve into a transitional and finally into a debris disc, while dispersing its gas content. The knowledge of this dispersal process and what favours/hinders it is a crucial part of the planet-formation puzzle, as the amount of gas present in a disc determines whether gas-rich planets can form. Therefore, three aspects need to be characterised well: the disc geometry, the solid state content, and the gas content. Both the geometry and the dust in HAEBE discs are well-studied (e.g. the review by Williams & Cieza williams2011 (2011); Meeus et al. meeus2001 (2001), Dominik et al. dominik2003 (2003) and Benisty et al. benisty2010 (2010) for the geometry; Acke et al. acke2010 (2010) for the Polycyclic Aromatic Hydrocarbon (PAH) and Juhász et al. (juhasz2010 (2010)) for the dust properties).
To understand the gas component — spatial distribution, chemistry and physical properties — it is necessary to observe a range of transitions in several species, as they can originate in different regions of the disc under distinct conditions (density, temperature, radiation field). For the purpose of studying the gas disc, H2 and CO lines are most often used, since they are the most abundant molecules present. In the FUV, H2 probes the warm gas and is frequently detected in TTS (e.g., Herczeg et al. herczeg2006 (2006); Ingleby et al. ingleby2011 (2011); France et al. france2012 (2012)). In the IR, the detection of H2 is more difficult, due to the nature of the H2 molecule (homonuclear with wide spacing of energy levels). In a survey of 15 HAEBEs with CRIRES, Carmona et al. (carmona2011 (2011)) detected ro-vibrational transitions at 2.1218 m in only two objects. Earlier, Bitner et al. (bitner2008 (2008)), Carmona et al. (carmona2008 (2008)), Martin-Zaïdi et al. (claire2009 (2009, 2010)) searched for pure rotational lines of H2 at 17.035 m in a sample of 20 HAEBEs; only two detections were reported. In TTS, the success rate is a little higher: Lahuis et al. (lahuis2007 (2007)) detected mid-IR H2 emission lines in six TTS, while Bary et al. (bary2008 (2008)) found five more H2 detections in the near-IR.
In sharp contrast, the detection of CO, although less abundant, is much easier. Its lines have been used to trace both the inner and outer disc. The fundamental ro-vibrational CO band (v) at 4.7 m traces warm ( 100 K) gas in the terrestrial planet-forming region (0.1 – 10 AU). This band is often observed in HAEBEs (e.g. Blake & Boogert blake2004 (2004); Brittain et al. brittain2007 (2007)) and in TTS (e.g. Najita et al. najita2003 (2003); Salyk et al. salyk2011 (2011)). The bands are rotationally excited up to high 30), resulting in between 900 and 2500 K. is much lower for 13CO, 250 K (Brown et al. brown2013 (2013)). UV fluorescence can cause super-thermal level populations, as observed (Brittain et al. brittain2007 (2007)) and modelled (Thi et al. thi2013 (2013)) in UV-bright HAEBEs where 5000 K, as well as in TTs (Bast et al. 2011; Brown et al. brown2013 (2013)). While some HAEBEs have CO extending to the dust sublimation radius (Salyk et al. salyk2011 (2011)), others have evidence for significant inner disc gas clearing (Goto et al. goto2006 (2006), Brittain et al. brittain2007 (2007), Pontoppidan et al. pontoppidan2008 (2008), van der Plas et al. plas2009 (2009)). Thi et al. thi2013 (2013), and van der Plas (Ph.D. Thesis) find that, in flaring discs, , and the inner radius of CO, 10 AU, while in self-shadowed discs, and 1 AU: flaring HAEBE discs thus have lower CO abundances in their inner regions than flat discs. In a recent paper, Maaskant et al. (2013) show that several group I sources (the flaring discs ) have dust-depleted gaps separating an optically thin inner disc and a flaring outer disc. It has been proposed that dust-depleted regions are a typical property of group I discs. This geometry allows more radiation reaching the outer disc, so they can be heated more when compared to the group II ( flat discs ). For the TTS, Brown et al. (brown2013 (2013)) found that most of the line profiles in TTS indicate that the CO emission originates in the disc plus a slow disc wind.
On the other end of the spectrum, CO low- pure rotational transitions (v) can be observed in the millimeter. These low- transitions originate from cold, optically thick CO located in the outer disc, and are routinely detected in HAEBE (e.g. Thi et al. thi2001 (2001), Dent et al. dent2005 (2005)) and in TTS (e.g. Koerner & Sargent koerner1995 (1995); Öberg et al. oberg2010 (2010)). As the lines are optically thick, the outer disc radius can be estimated from the line profile (e.g. Dent et al. dent2005 (2005), Panić et al. panic2008 (2008)). In HAEBE discs, the dust temperature in the entire disc is high enough (at least 30 K) to avoid freeze-out of CO on the dust grains (e.g. Panic et al. panic2009 (2009), Bruderer et al. bruderer2012 (2012)), while in TTS, this happens more frequently (e.g. Hersant et al. hersant2009 (2009)).
The much less observed far-IR wavelength range covers rotationally-excited mid-to high- CO lines which probe temperatures intermediate between the low- sub-mm and the vibrationally-excited near-IR lines. Giannini et al. (giannini1999 (1999)) analysed ISO/LWS observations of 3 HAEBEs, covering rotational lines from = 14 to = 19. Their modelling showed that the CO emission originates from a compact region (up to a few 100 AU) around the central star, and suggest that the stellar FUV radiation excites the CO.
CO far-IR lines in HAEBEs and TTS were also observed by DIGIT (Sturm et al. sturm2010 (2010)) and GASPS (Meeus et al. meeus2012 (2012)) with the instrument PACS (Poglitsch et al. poglitsch2010 (2010)) onboard Herschel (Pilbratt et al. pilbratt2010 (2010)). Bruderer et al. (bruderer2012 (2012); hereafter BR12) modelled pure rotational CO transitions in HD 100546 (Sturm et al. sturm2010 (2010)). They showed that, in this disc, 1) in the disc surface, the gas temperature is decoupled from the dust temperature; 2) the low- ( 10) lines trace a radius between 70-220 AU, at a low scale height in the disc, the mid- ( 20) lines trace a radius of 35-80 AU, while the high- ( 20) lines trace the upper disc atmosphere at 20-50 AU. Therefore, the higher the , the closer to the star is the region the transition traces; 3) the highest lines are optically thin and scale with the amount of hot gas in the disc surface, while the lowest lines are optically thick and scale with the outer disc radius. The authors also show that the rotational diagram of HD 100546 (including, besides PACS also APEX data of low- transitions) can be fitted with 3 components: 60, 300 and 750 K.
We now present PACS spectra of a much larger sample of HAEBEs and TTS observed within the DIGIT Open Time Key Project (OTKP; P.I. Neal Evans). These spectra show pure rotational transitions of CO with from 14 up to 49, corresponding to between 581 and 6724 K. Detections of O i, C ii, OH, H2O, CH+ are reported in a companion paper by Fedele et al. (submitted; paper I). In Sect. 2, we present the sample and the observations, while in Sect. 3 we show the line detections and fluxes and construct rotational diagrams. In Sect. 4 we look into the UV luminosity and use a small disc model grid to explain our observations. In Sect. 5, we speculate on the impact of PAH luminosity and inner disc clearing on the CO emission, while in Sect. 6, we present our conclusions.
2 Sample and observations
Our sample consists of 22 Herbig Ae/Be stars and 8 T Tauri stars. The HAEBE sample has spectral types between B9 and F4, and is representative for the HAe stars, while the TTS sources tend to be distinct from typical TTS in some way (such as having a large amount of veiling, or the presence of a strong disc wind or outflow or a disc gap). We refer to Paper I for a discussion of the sample properties.
For each HAEBE star, we derived its disc group (I: flared discs, II: flat discs, in the classification of Meeus et al. meeus2001 (2001)), and calculated by integrating the UV flux obtained from the IUE archive between 1150 and 2430 for the HAEBEs. For the TTS, we measured between 1250-1700 directly for a few sources. When direct measurements of FUV were not available, they were derived instead from observations of the H I Pf line and an empirical relationship between and Pf (Salyk et al. salyk2013 (2013)), in conjunction with an empirical relationship between and (Yang et al. yang2012 (2012)). These results are listed in Table 1.
| HAEBE | Disc | / | CO | |
|---|---|---|---|---|
| group | 1150-2430 | () | det. | |
| AB Aur | I | 4.63 | 0.203 | Y |
| HD 35187 | II | 2.23 | 0.034 | n |
| HD 36112 | I | 1.32 | 0.029 | Y |
| HD 38120 | I | – | 0.116 | n |
| HD 50138 | II | – | – | n |
| HD 97048 | I | 7.69 | 0.367 | Y |
| HD 98922 | II | – | – | n |
| HD 100453 | I | 0.29 | 0.038 | n |
| HD 100546 | I | 7.22 | 0.098 | Y |
| HD 104237 | II | 1.54 | – | n |
| HD 135344 B | I | 0.11a | 0.015 | n |
| HD 139614 | I | 0.39 | 0.022 | n |
| HD 141569 A | II/TO | 6.83 | 0.007 | n |
| HD 142527 | I | 0.15a | 0.149 | n |
| HD 142666 | II | 0.37–0.68 | 0.028 | n |
| HD 144432 | II | – | 0.003 | n |
| HD 144668 | II | 1.55–2.94 | – | n |
| IRS 48 | I | 4.63 | 0.386 | Y |
| HD 150193 | II | 8.53 | – | n |
| HD 163296 | II | 3.21–5.58 | – | n |
| HD 169142 | I | 0.45 | 0.093 | n |
| HD 179218 | I | – | – | n |
| TTS | log / | / | CO | |
| 1250-1700 | det. | |||
| DG Tau | -0.13 | 0.016b | Y | |
| HT Lup | -0.65 | 0.006b | n | |
| RU Lup | -0.42 | 0.01 | Y | |
| RY Lup | – | 0.002 | n | |
| AS 205 A/B | -0.15/-0.37 | 0.016/0.01 | Y | |
| SR 21 | – | 0.0003b | n | |
| RNO90 | -0.16 | 0.016b | n | |
| S CrA A/B | -0.10/-0.59 | 0.016/0.006b | Y |
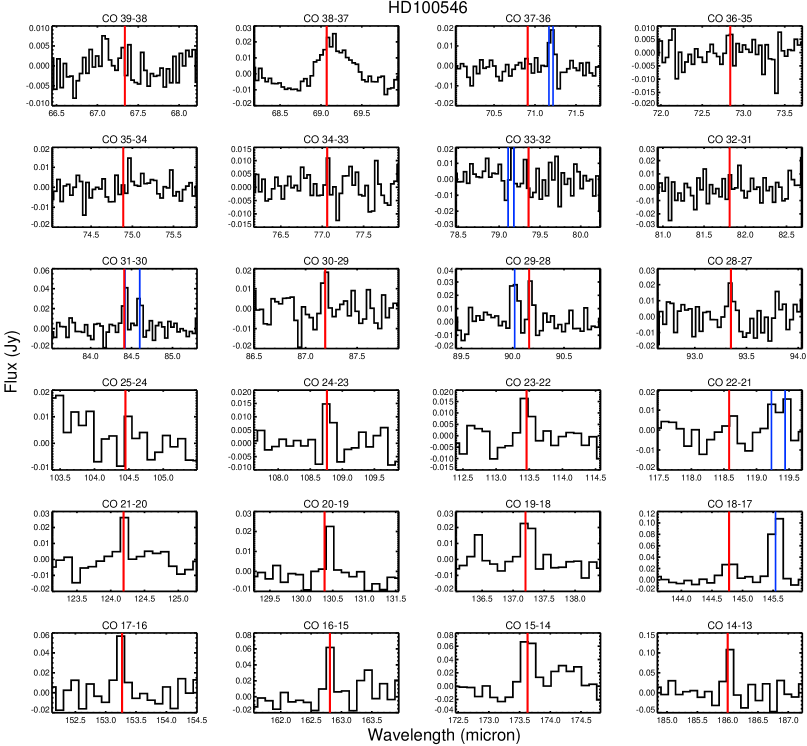
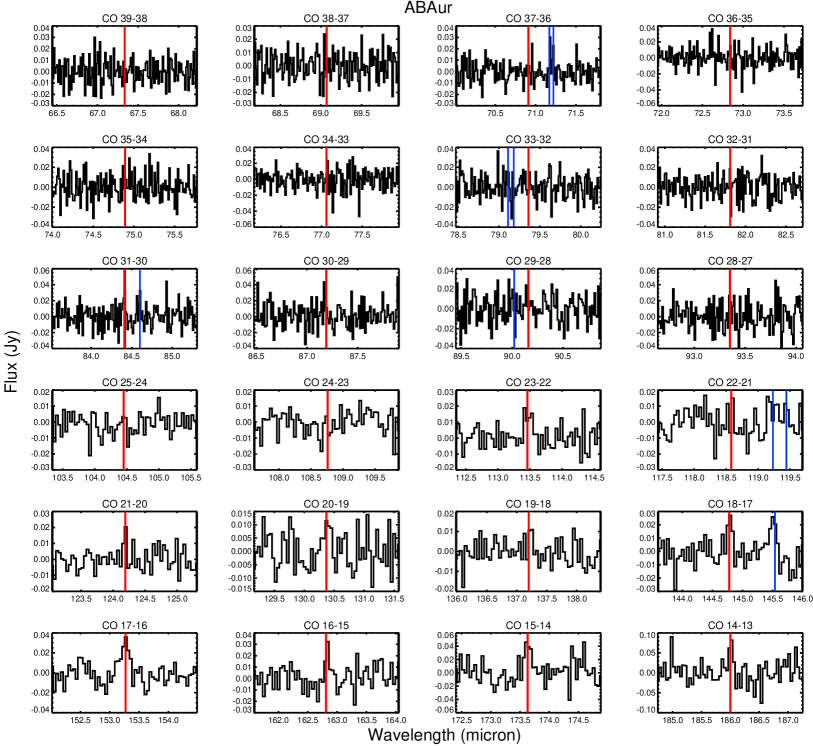
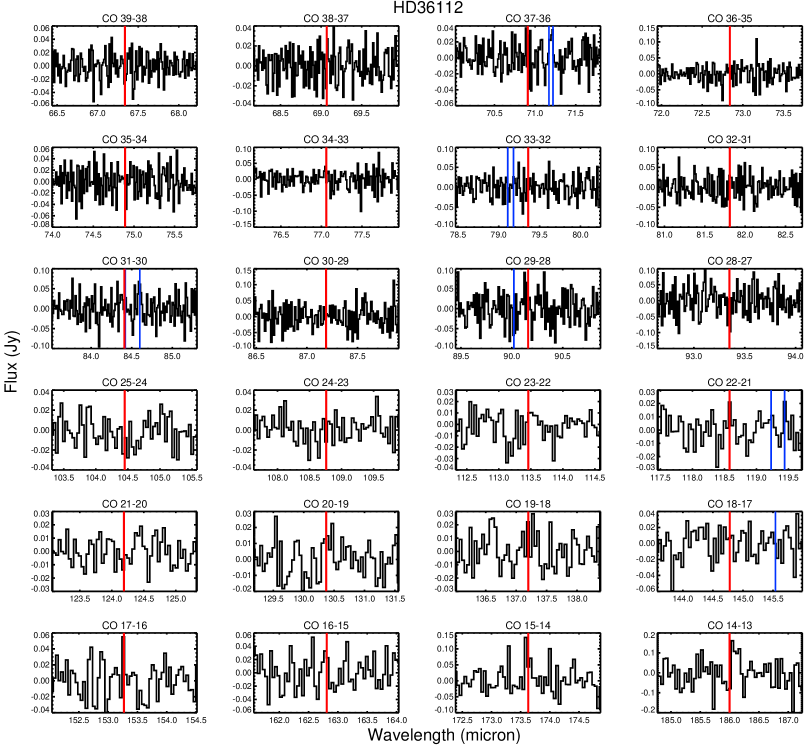
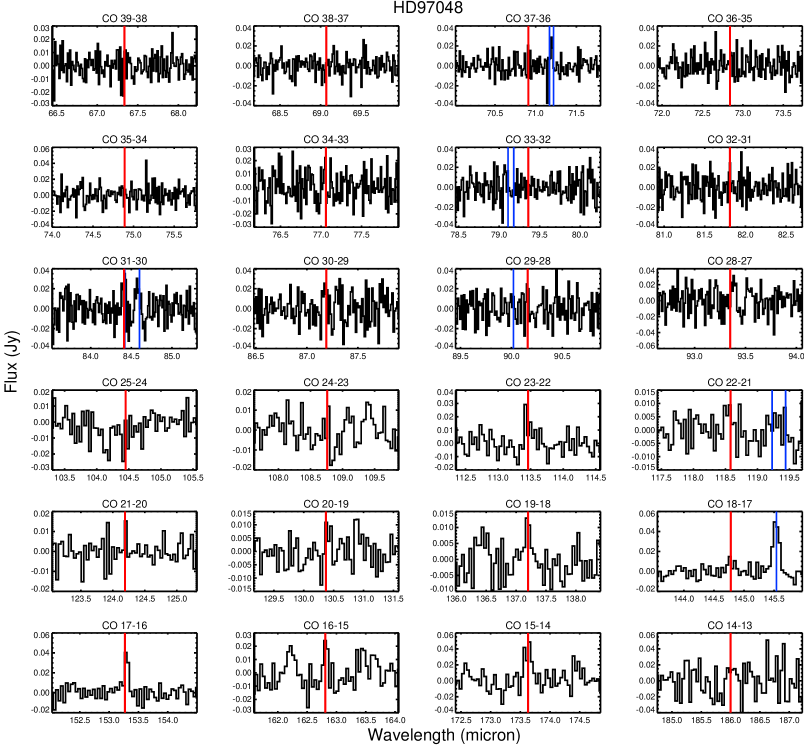
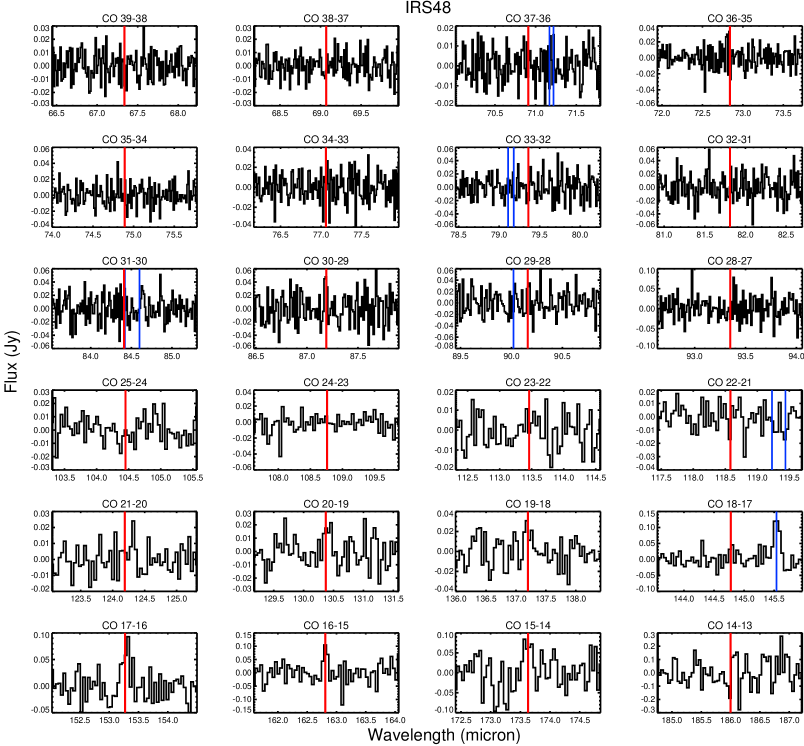
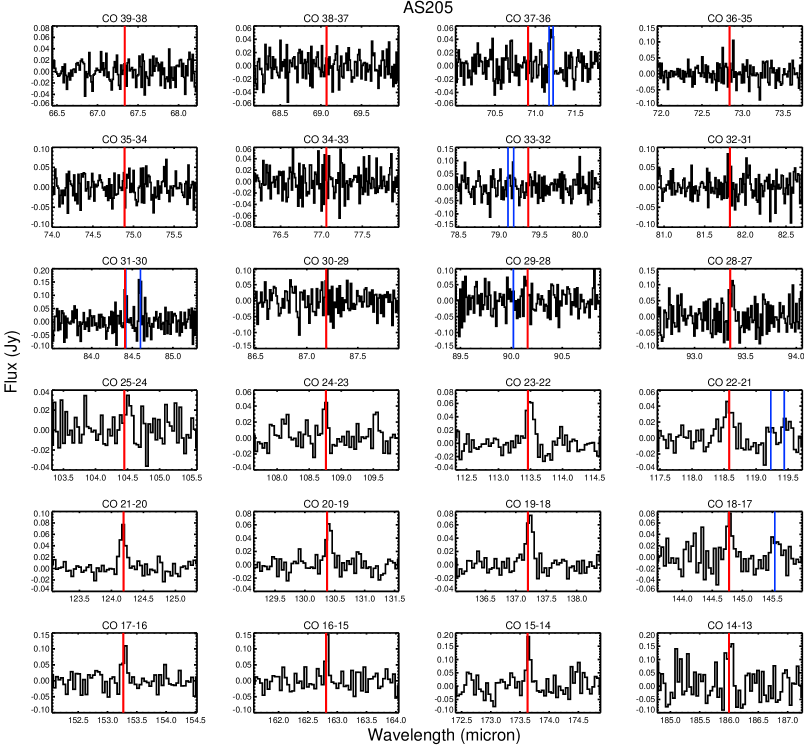
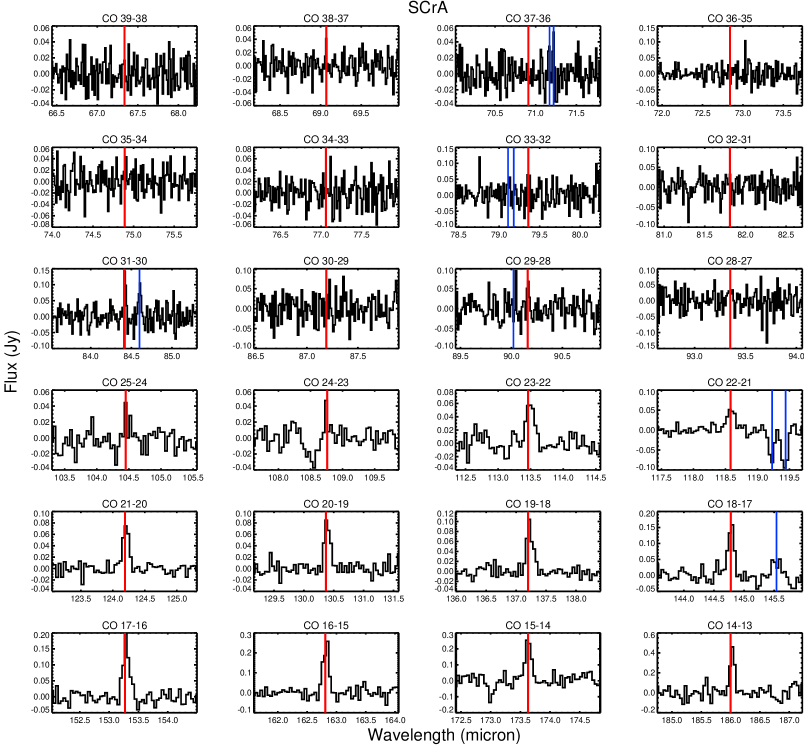
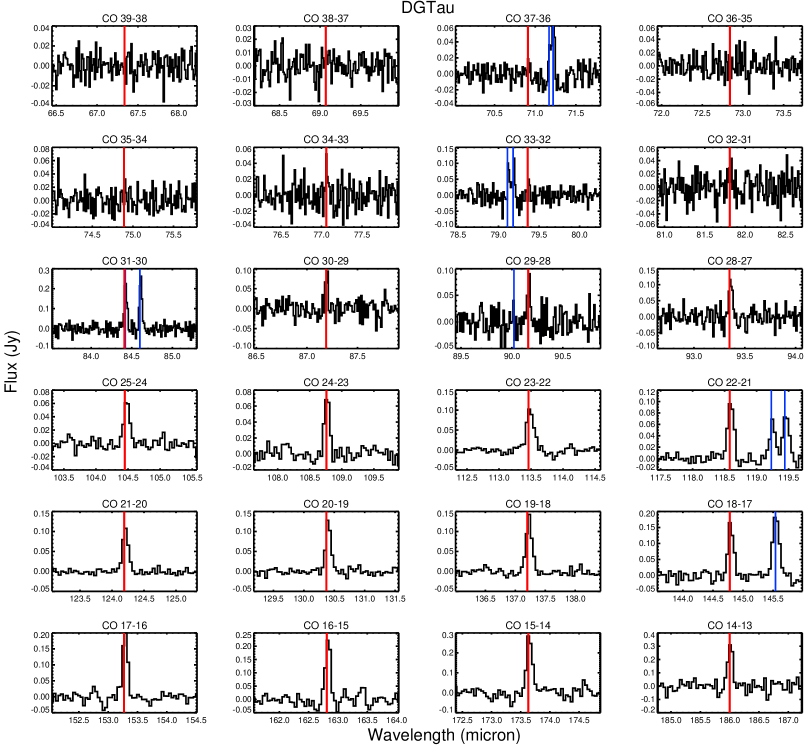
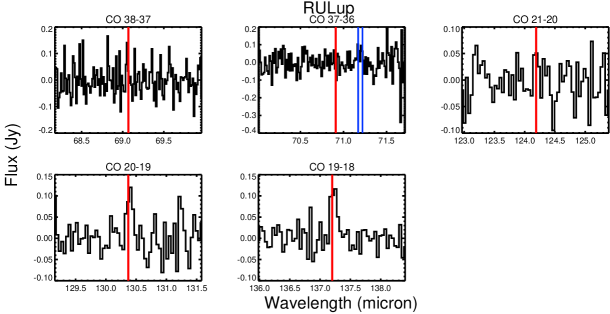
We obtained Herschel/PACS spectroscopy in SED range mode, covering the spectral range between 51 and 210 m. Not all sources were observed in the full range. For an overview of the observational settings and the reduction methods we refer to Paper I, where we also show the full range spectra for each object. In Fig. 1 we present a zoom in at the positions of the CO lines for HD 100546, while we show similar plots in Figs. 7 to 14 for those objects where CO was detected.
With the sensitivity of our spectra, we are able to achieve a typical S/N on the continuum of 100 and to detect a line with 3 confidence when the line flux is higher than 1 10-17 W m-2, varying with the observed wavelength and level of continuum flux. Furthermore, at the edges of the bands, the spectra become more noisy, resulting in higher upper limits (for a more detailed discussion on this topic we refer to the DIGIT data overview paper by Green et al. green2013 (2013)). For detected lines, we extracted the line fluxes using a Gaussian fit to the emission lines, using the RMS on the continuum (excluding the line) to derive a 1 error on the line flux. For non-detections, we give a 3 upper limit, also calculated from the continuum RMS. The derived line fluxes are listed in Table 2. The second row for each source is the flux density in the adjacent continuum.
| Transition | =38 37 | =37 36 | =36 35 | =35 34 | =34 33 | =33 32 | =32 31 | =31 30a |
|---|---|---|---|---|---|---|---|---|
| AB Aur | 100.5 | 95.3 | 100.7 | 73.8 | 100.3 | 79.5 | 77.9 | 92.1 (2.6) |
| 134.8 Jy | 134.3 Jy | 135.5 Jy | 136.6 Jy | 134.8 Jy | 133.1 Jy | 129.7 Jy | 132.0 Jy | |
| HD 36112 | 21.8 | 25.2 | 38.4 | 24.3 | 20.3 | 25.1 | 24.9 | 29.5 |
| 20.5 Jy | 20.5 Jy | 20.6 Jy | 20.3 Jy | 20.3 Jy | 20.0 Jy | 19.1 Jy | 19.1 Jy | |
| HD 97048 | 42.8 | 45.7 | 38.2 | 33.1 | 42.4 | 37.6 | 40.2 | 56.6 (15.0) |
| 65.8 Jy | 66.6 Jy | 68.1 Jy | 68.5 Jy | 70.3Jy | 69.1 Jy | 66.0 Jy | 68.5 Jy | |
| HD 100546 | 107.4 | 82.9 | 52.9 (12.6) | 44.1 | 53.1 (14.4) | 84.5 | 65.3 | 139.7 (27.6) |
| 172.0 Jy | 162.4 Jy | 160.6 Jy | 159.5 Jy | 156.7 Jy | 148.6 Jy | 139.7 Jy | 141.7 Jy | |
| IRS 48 | 28.7 | 23.0 | 37.5 | 31.2 | 28.4 | 37.9 | 38.6 | 33.7 |
| 48.9 Jy | 47.2 Jy | 46.4 Jy | 46.6 Jy | 45.1 Jy | 42.6 Jy | 39.8 Jy | 39.4 Jy | |
| AS 205 | 22.8 | 33.1 | 37.0 | 29.8 | 24.1 | 37.2 | 25.9 | 46.0 |
| 20.7 Jy | 20.5 Jy | 21.0 Jy | 20.8 Jy | 20.9 Jy | 20.7 Jy | 19.3 Jy | 20.4 Jy | |
| S CrA | 24.0 | 33.2 | 37.9 | 28.3 | 30.4 | 42.6 | 30.8 | 40.8 |
| 23.6 Jy | 24.0 Jy | 24.5 Jy | 24.3 Jy | 24.6 Jy | 24.4 Jy | 23.7 Jy | 24.5 | |
| DG Tau | 15.4 | 42.4 | 25.7 (6.6) | 18.9 | 24.7 (5.5) | 47.6 | 19.8: (7.0) | 128.3 (25.3) |
| 26.5 Jy | 26.6 Jy | 26.7 Jy | 26.6 Jy | 26.7 Jy | 26.1 Jy | 25.2 Jy | 26.2 Jy | |
| =30 29 | =29 28 | =28 27 | =25 24 | =24 23 | =23 22 | =22 21 | ||
| AB Aur | 57.8 | 81.5 | 55.5 | 54.2 | 47.0 | 58.9 (12.4) | 45.7 | |
| 133.0 Jy | 129.8 Jy | 123.6Jy | 103.7 Jy | 99.2 Jy | 93.8 Jy | 88.0 Jy | ||
| HD 36112 | 27.6 | 22.7 | 32.3 | 17.7 | 13.3 | 11.0 | 9.1 | |
| 19.7 Jy | 19.4 Jy | 19.0 Jy | 15.9 Jy | 15.5 Jy | 14.6 Jy | 13.7 Jy | ||
| HD 97048 | 43.0 | 32.5 | 42.7 | 36.4 | 30.4 | 30.1 (8.7) | 14.7: (6.6) | |
| 71.1 Jy | 70.7 Jy | 68.2 Jy | 61.5 Jy | 59.1 Jy | 57.4 Jy | 53.7 Jy | ||
| HD 100546 | 73.4 (14.9) | 78.6 (18.7) | 81.5 (11.2) | 77.1 | 71.3 (11.5) | 78.4 (11.2) | 42.0 | |
| 139.6 Jy | 135.6 Jy | 126.1 Jy | 107.9 Jy | 100.5 Jy | 91.5 Jy | 83.2 Jy | ||
| IRS 48 | 26.0 | 29.0 | 27.3 | 22.7 | 17.8 | 13.0 | 14.2 | |
| 39.0 Jy | 36.8 Jy | 34.4 Jy | 28.3 Jy | 25.7 Jy | 23.2 Jy | 20.8 Jy | ||
| AS 205 | 28.3 | 20.8 | 55.1 (7.3) | 18.9 (5.4) | 15.2 (4.8) | 30.1 (3.7) | 17.9 (3.8) | |
| 19.8 Jy | 20.1 | 19.1 Jy | 15.9 Jy | 15.4 Jy | 14.5 Jy | 13.7 | ||
| S CrA | 24.6 | 23.2 | 24.9 (6.4) | 26.6 (6.5) | 23.1 (5.7) | 42.2 (4.9) | 31.4 (10.6) | |
| 24.4 Jy | 24.3 Jy | 23.6 Jy | 21.2 Jy | 20.3 Jy | 19.0 Jy | 17.6 Jy | ||
| DG Tau | 36.4 (6.2) | 41.3 (7.3) | 51.5 (6.9) | 39.8 (4.8) | 38.4 (4.1) | 64.9 (3.3) | 40.2 (8.4) | |
| 26.5 Jy | 26.0 Jy | 25.5 Jy | 21.4 Jy | 20.5 Jy | 19.4 Jy | 18.5 Jy | ||
| =21 20 | =20 19 | =19 18 | =18 17 | =17 16 | =16 15 | =15 14 | =14 13 | |
| AB Aur | 35.0 | 39.2 (9.3) | 29.8 | 49.6 (10.3) | 40.7 (14.4) | 27.0 | 64.0 (16.1) | 30.1 |
| 83.9 Jy | 80.5 Jy | 72.7 Jy | 73.5 Jy | 64.9 | 63.8 Jy | 50.6 Jy | 38.0 Jy | |
| HD 36112 | 8.4 | 7.9 (2.5) | 8.2 | 12.4 | 11.4 | 12.8 | 14.1 (4.1) | 16.0 (4.7) |
| 13.2 Jy | 12.8 Jy | 12.5 Jy | 12.3 Jy | 12.2 Jy | 12.0 Jy | 11.0 Jy | 8.2 Jy | |
| HD 97048 | 15.3 | 21.5 | 19.5 | 25.8 (7.1) | 32.4 (5.3) | 24.5 | 49.1 (11.5) | 23.8 |
| 55.1 Jy | 53.3 Jy | 54.2 Jy | 58.2 Jy | 58.8 Jy | 58.1 Jy | 54.3 Jy | 43.9 Jy | |
| HD 100546 | 65.0 (8.8) | 49.9 (5.7) | 64.7 (8.5) | 71.5 (6.9) | 73.9 (10.4) | 58.8 (9.7) | 88.3 (9.7) | 60.0 (8.3) |
| 75.1 Jy | 68.4 Jy | 64.1 Jy | 60.5 Jy | 57.0 Jy | 52.8 Jy | 45.9 Jy | 35.0 Jy | |
| IRS 48 | 9.9 (3.0) | 12.3 (4.1) | 11.1 (3.7) | 13.4 (2.8) | 22.7 (4.7) | 12.0: (4.8) | 18.4 | 21.5 |
| 18.7 Jy | 17.0 Jy | 15.7 Jy | 14.4 Jy | 13.3 Jy | 12.3 Jy | 10.2 Jy | 7.2 Jy | |
| AS 205 | 22.1 (2.3) | 20.3 (2.8) | 21.6 (2.4) | 18.5 (2.6) | 18.9 (3.9) | 13.0 (3.8) | 24.0 (5.5) | 16.3 (4.2) |
| 13.1 Jy | 12.8 Jy | 12.7 Jy | 12.7 Jy | 12.8 Jy | 12.6 Jy | 11.9 Jy | 9.1 Jy | |
| S CrA | 34.1 (2.5) | 26.7 (2.7) | 34.2 (2.9) | 44.2 (3.9) | 44.7 (4.3) | 52.4 (4.7) | 50.5 (7.5) | 39.7 (6.6) |
| 16.9 Jy | 16.1 Jy | 15.7 Jy | 15.3 Jy | 15.0 Jy | 14.7 Jy | 13.4 Jy | 9.8 Jy | |
| DG Tau | 46.4 (2.0) | 42.5 (2.0) | 45.9 (2.3) | 50.0 (2.9) | 47.7 (2.9) | 44.9 (3.5) | 67.7 (4.5) | 31.0 (3.9) |
| 17.6 Jy | 16.9 Jy | 16.8 Jy | 16.5 Jy | 16.2 Jy | 15.9 Jy | 14.4 Jy | 10.4 Jy | |
| RU Lup | 9.0 | 10.8 (2.9) | 11.5 (2.1) | – | – | – | – | – |
| 4.2 Jy | 4.0 Jy | 4.1 Jy | – | – | – | – | – |
3 Results
3.1 Detections
We detected CO lines in only 5 HAEBE stars of our sample: AB Aur, HD 36112, HD 97048, HD 100546, and IRS 48. While all 5 detections toward HAEBEs occur for fairly nearby stars pc, there are many HAEBEs at similar distances without detections. All 5 HAEBEs with detections have group I (flaring) discs; there is no CO detection seen in a group II (flat) HAEBE disc. Within the group I sources, the sources with CO detections have the highest observed.
For the TTS, we detected CO in 4 objects: AS 205, a disc wind source (Bast et al. bast2011 (2011)), and a possible outflow source (Mundt mundt1984 (1984)); S CrA and B: disc wind sources (Bast et al. bast2011 (2011)), RU Lup: a disc wind source (Bast et al. bast2011 (2011)), as well as an outflow source (Herczeg et al. herczeg2005 (2005) and references therein); and DG Tau: an outflow source (e.g. Lavalley-Fouquet et al. lavalley2000 (2000)). An equivalent disc geometry classification as for the HAEBEs does not exist, so we could not compare the two samples in this regard. However, CO detections are only seen in TTS that show evidence for a strong disc wind (according to the line shape criterion defined in Bast et al. bast2011 (2011)), or a resolved outflow, or both. It is not yet known whether there is a correlation between the presence of disc winds and outflows, although several discs have signatures of both.
The highest observable transition is = 49 48, but the highest detected transition in our spectra is = 36 35, seen only in HD 100546 and the outflow source DG Tau. In Table 5, we list the transitions, their wavelength and the upper level energy (in kelvin) that are detected in our spectra. The transition = 31 30 is at the same wavelength as an OH line; therefore we consider it to be an upper limit in our further analysis.
3.2 Rotation Diagrams
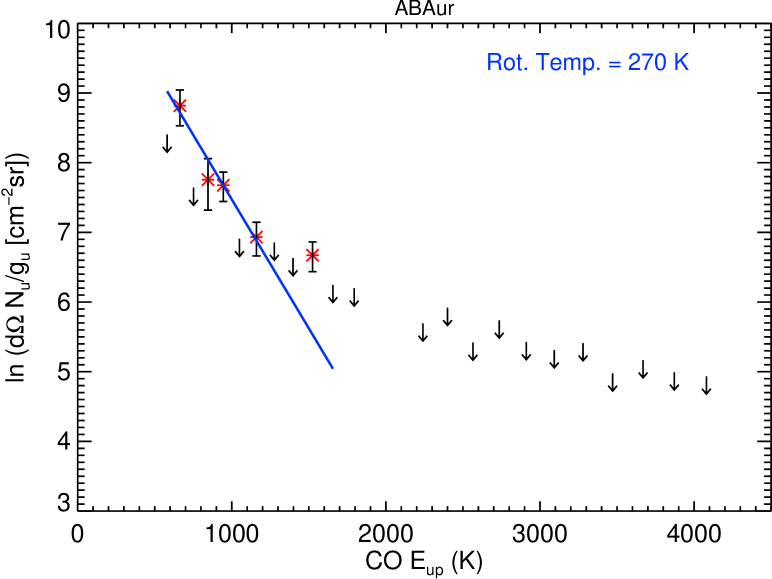
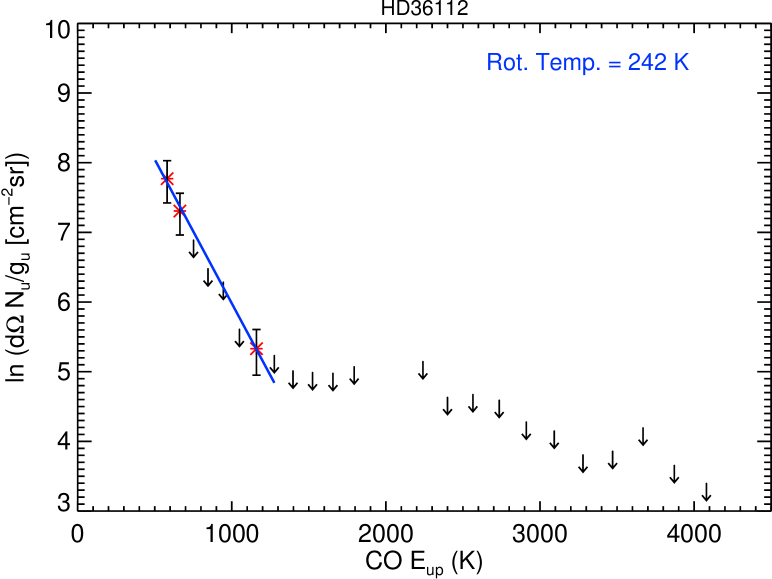
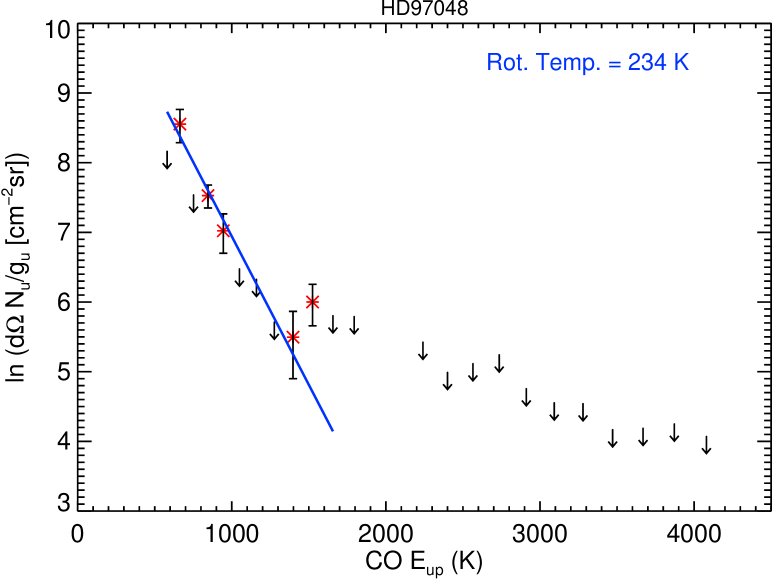
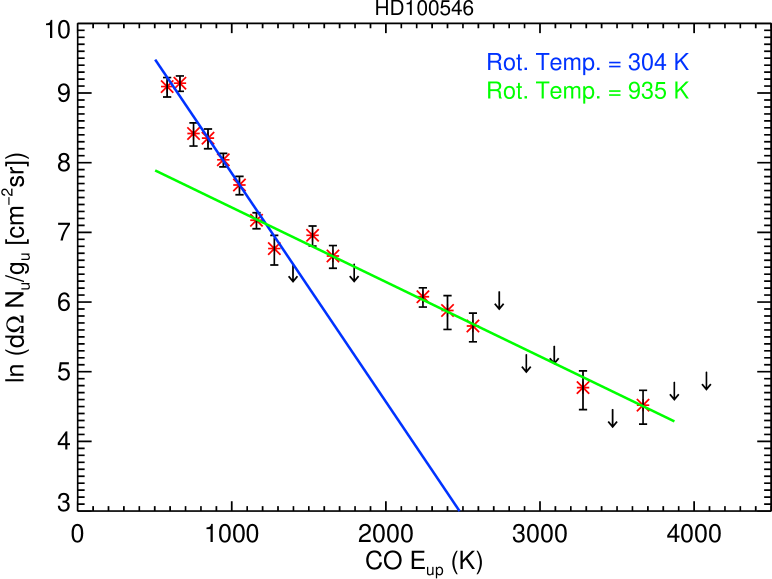
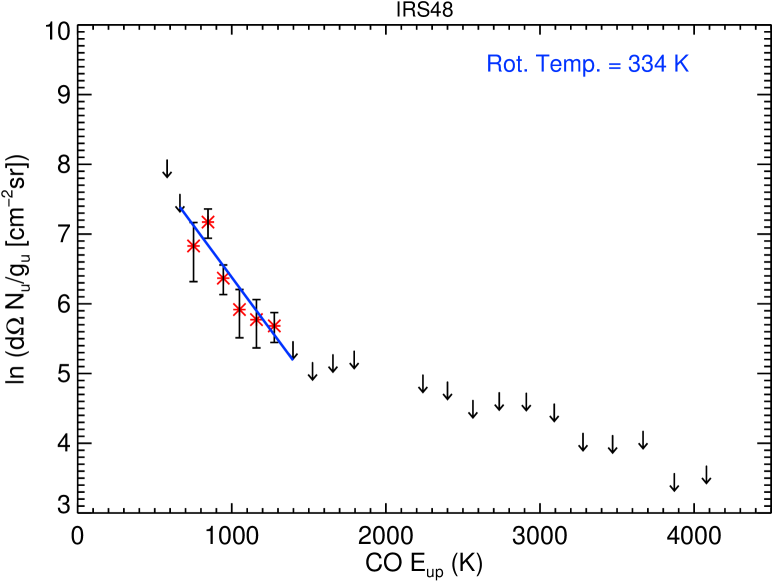
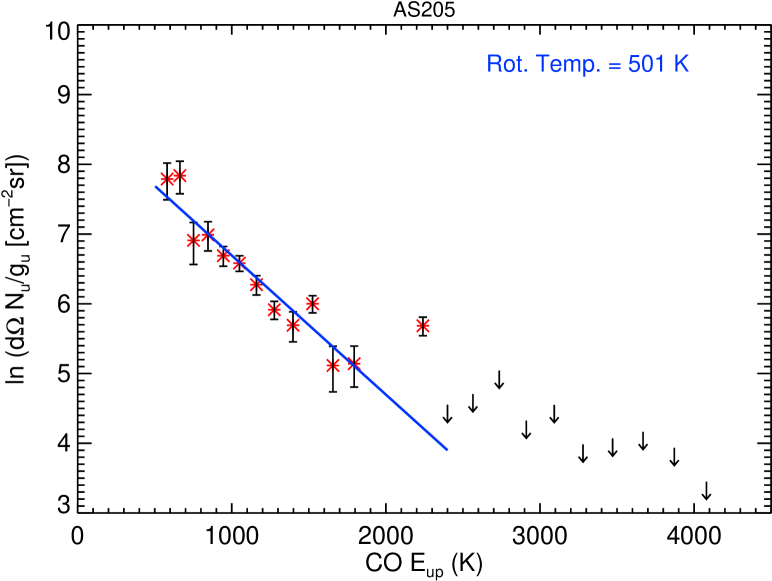
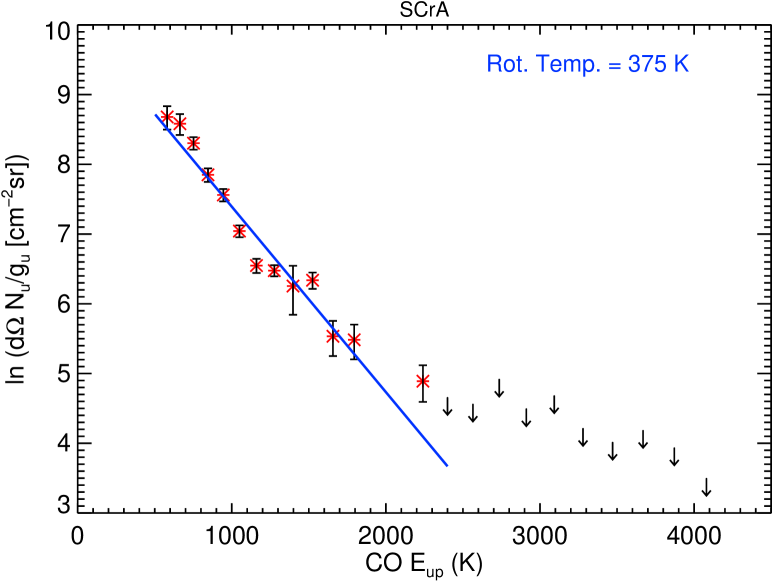
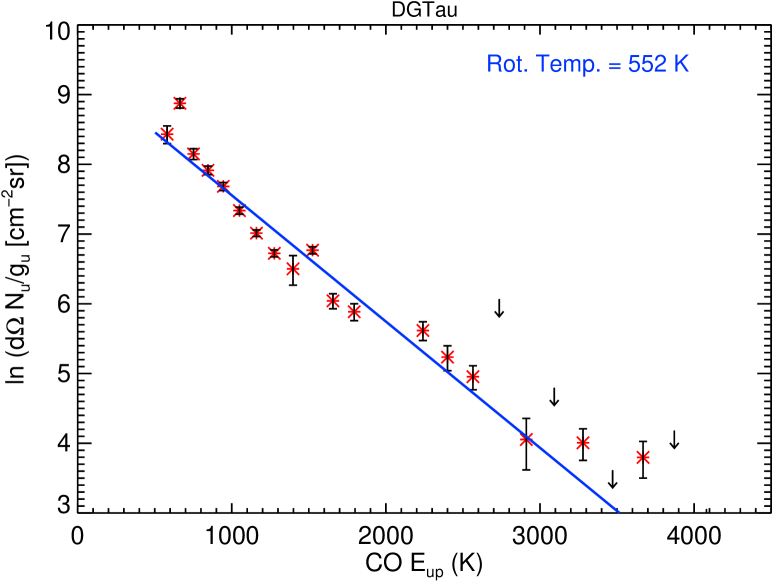
Since we covered a wide range in transitions it is possible to analyse our data with the aid of rotational diagrams (see Goldsmith & Langer goldsmith1999 (1999)). We constructed rotational diagrams for the sources with at least three CO line detections (see Fig. 2), and list the derived in Table 3. We derived the error on by calculating the 2 extreme temperatures that are still consistent with the errors on the line fluxes. We define the Y axis of the diagram as Nu / gFu / (Au h gu)) such to include the solid angle of the emission, since the CO ladder could emerge from different regions in the disc (see discussion in BR12). For the HAEBEs, we obtain between 200 and 350 K. For HD 100546 we also need a second component to fit the rotational diagram, with 900 -1000 K. Also for AB Aur and HD 97048 a second component could be present, but in these cases we do not have enough line detections to derive a temperature. More sensitive data could reveal higher emission lines also for these sources. The result for HD 100546 is similar to that found in an earlier analysis (Sturm et al. sturm2010 (2010)). We note that, for a few transitions (around 22 21, or = 1397 K), the fit predicts a too high line flux when compared to the observations. It is not clear whether to attribute this to bad flux calibration of this wavelength range ( 118 m) and/or due to the low quality of this spectral region. The mean of the HAEBE values, excluding the hot component in HD100546, is K. For TTS, the temperatures are higher - between 350 and 600 K, with the outflow source DG Tau having the highest : 582 12 K. The mean value is K, significantly higher than the mean for the HAEBEs.
The rotational temperatures of 200-350 K in HAEBE discs are lower than those typically found from 12CO ro-vibrational fundamental ( = 1 0) near-IR transitions (Salyk et al. salyk2011 (2011)). They are comparable, however, to the rotational temperatures derived from the 13CO ro-vibrational fundamental lines, which probe somewhat further out into the disc (Brown et al. brown2013 (2013)).
We note that converting derived from a rotation diagram to a kinetic temperature is not straightforward, as it assumes optically thin emission. Even if the lines are thin, equals only if the excitation is in thermal equilibrium with the gas, i.e., if the density is high enough. Indeed, Bruderer et al. (bruderer2012 (2012)) discussed that the CO ladder reflects emission from the disc atmosphere from a range of radii ( 20–80 AU) at different temperatures, and that the shape of the CO ladder can depend on several factors: 1) the gas temperature and density; 2) for the low- to mid- lines, optical depth effects; and 3) the amount of emitting molecules if the line is optically thin, or size of emitting region, if the line is optically thick. For HD 100546, Bruderer et al. (bruderer2012 (2012)) predicted that lines up to = 16 15 are optically thick. Assuming that the model for HD100546 is relevant for all our sources, the lines we observe are mainly optically thin so that the gas temperature and density are the main factors, assuming a normal CO abundance.
| Object | (K) | Notes |
|---|---|---|
| AB Aur | 270 | Highest not fitted, 2 components? |
| HD 36112 | 242 | |
| HD 97048 | 234 | Highest not fitted, 2 components? |
| HD 100546 | 276 | Needs 2 temperature components |
| 935 | ||
| IRS 48 | 334 | |
| AS 205 | 501 | Highest not fitted, 2 components? |
| S CrA | 375 | |
| DG Tau | 582 |
4 Analysis
4.1 Relation with the (UV) luminosity
Does the far-IR CO line emission depend on stellar luminosities? We compared average HAEBE and TTS CO line luminosities for the = 17 16 transition, and found that they are remarkably similar: for the HAEBEs and for the TTS, while the average bolometric luminosities are 86.0 and 5.0 for the HAEBEs and TTS, respectively. This indicates that there is no correlation between the average line luminosity and .
But what about the UV luminosity? Models suggest that UV radiation is important for the gas heating and the excitation of the molecules, and one of the main factors determining the strength of the emission lines observed in the far-IR (e.g. Woitke et al. woitke2010 (2010); Kamp et al. kamp2011 (2011)). Also BR12 showed the importance of the temperature of the stellar radiation field with respect to the amount of line flux (see their Fig. 13). Because of self-shielding, the CO molecule can survive the UV radiation in the surface layers and the CO emission lines trace the heated disc surface. Since CO is an important coolant, an increased amount of heating leads to the detection of higher lines, as well as higher line luminosity.
HAEBE stars with strong and flaring discs (group I) often have high [O i] 63 m line flux (Meeus et al. meeus2012 (2012); paper I). Furthermore, sources with higher [O i] 63 fluxes also have higher far-IR CO fluxes, as is shown in Meeus et al. (meeus2012 (2012)) for the CO = 18 17 transition.
In HAEBEs, the bulk of the UV radiation is stellar, and the relative contribution from accretion is small. In contrast, the accretion luminosity is the most important contributor to the UV luminosity of TTS (e.g. Yang et al. yang2012 (2012)), as the relatively cool stellar photospheres produce very little UV flux. In Sect.3, we showed that is higher in our sample of TTS than in the HAEBEs. This can perhaps be attributed to a difference in gas heating mechanism, which is stellar in HAEBEs, while it is due to accretion and could also be due to shocks in the TTS. Podio et al. (podio2012 (2012)) and Karska et al. (karska2013 (2013)) show that, in outflow sources, heating by shocks is necessary to explain the observed molecular line emission. In our TTS sample, at least two sources with CO detections (DG Tau and RU Lup) show evidence for a jet.
Given the differences in origin of the UV radiation, important in the context of gas heating mechanisms, we will discuss HAEBEs and TTS separately in the following sections.
4.1.1 HAEBEs
The five HAEBEs with CO detections all have flaring discs, with a hot disc atmosphere. Four out of five detections are in stars with a relatively high , but there are also non-detections at values similar to those of the detections, with the transitional disc HD 141569 A having the highest value. Unfortunately, the modest ranges in and line luminosity, coupled with the small sample size, make it impossible to statistically test whether the line luminosity correlates with .
4.1.2 TTS
Salyk et al. (salyk2013 (2013)) show that the accretion rate can also be correlated with the strength of the H Pf (n = 7 4) line at 4.65 m, which was observed in all of the TTS in our sample. In the following, we use data from that paper, taken with either VLT/CRIRES (Pontoppidan et al. pontoppidan2011 (2011)) or Keck/NIRSPEC. In Fig. 3 we plot the H Pf line emission both for sources that do show the PACS CO lines and those that do not. All the sources with CO detections have strong H Pf lines, while most of the sources without – with the exception of RNO 90 – have weak H Pf lines. Also the ro-vibrational CO lines appear to be stronger in the sources with PACS detections, especially the = 2 1 R(8) line at 4.6598 m, which is enhanced by UV radiative excitation (Brown et al. brown2013 (2013)). This implies a connection between accretion rate and CO detections, perhaps due to the UV radiation provided by the accretion column. However, a direct connection with the value of is not found. We see a similar spread in for the detections as the non-detections, so that there is no clear correlation between these variables.

4.2 Thermo-chemical models of the mid- to high- CO emission.
To explain the trend that far-IR CO lines are only detected towards flared discs, we ran a grid of thermo-chemical models introduced by Bruderer et al. (bruderer2012 (2012)). These models solve for the dust radiative transfer, the chemistry and the thermal balance in a self-consistent way. Details of the model and benchmark tests are reported in BR12. In that paper, the mid- to high- CO emission of HD 100546 is reproduced together with the fine structure lines of [O I] for a model tailored specifically to that disc. Here, we run a grid of generic disc models using a parameterized density structure. The surface density profile of the disc varies as
| (1) |
while the vertical density structure is a Gaussian
| (2) |
The scale-height H(r) is given by the power-law
| (3) |
The parameters assumed in the grid are given in Table 4. We vary the disc mass and the flaring parameter to study the dependence of the CO lines on these two parameters.
As a word of caution, we note that thermo-chemical modeling is prone to large uncertainties, in particular in the gas temperature calculation (Röllig et al. rollig2007 (2007)). We thus refrain from fitting individual objects, but aim to reproduce the main trends found in the observations.
| Parameter | Value | |
|---|---|---|
| Disc mass | ||
| Flaring angle | ||
| Inner radius | AUa𝑎aa𝑎a measured on the model photosphere (no UV observations available); The transition = 31 30 is a blend with OH, so the values listed are upper limits. The transitions = 26 25 at 100.46 m and = 13 12 at 200.41 m, are not listed, as the data are too noisy to give a meaningful upper limit. | |
| Outer radius | AU | |
| Scale height at 100 AU | H AU | |
| Surface density power-law | ||
| Stellar luminosity | L⊙ | |
| Stellar temperature | K | |
| Stellar X-ray luminosity | erg s-1 | |
| Gas-to-dust mass ratio | g/d100 | |
| Distance | 150 pc | |
| Inclination | ||
| Grain size | m | |
| Grain size distribution | ||
| Grain composition | ISM (Weingartner & Draine weingartner2001 (2001)) |
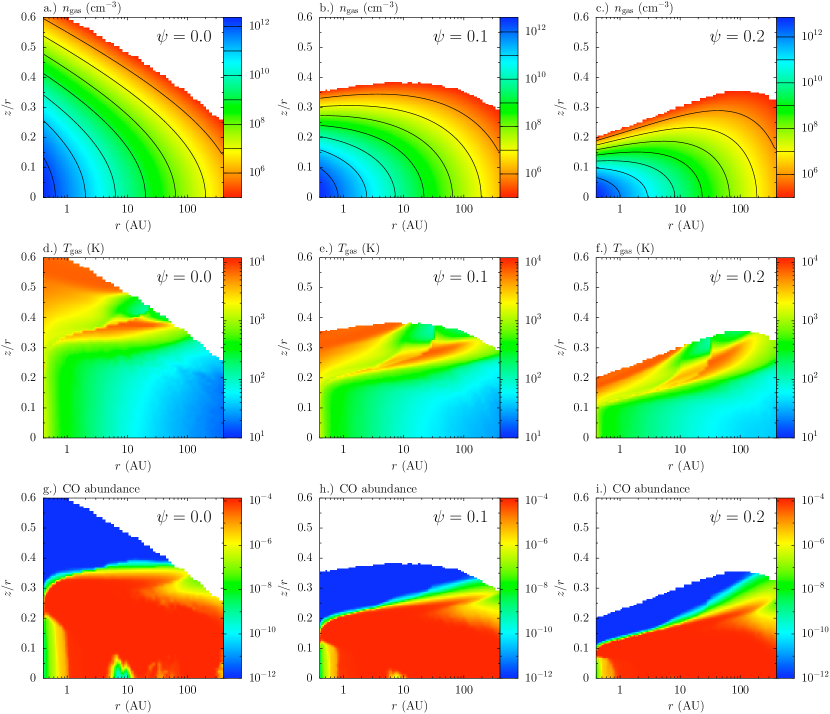
How does the flaring parameter affect the temperature structure? In Figure 4, the density, gas-temperature, and CO abundance profile of models with varying flaring parameters, and , and are shown. The figures are plotted such that the axes are distance-normalised height () versus . In the model without flaring () there is always an attenuating column of gas and dust between the star and regions with density cm-3. This density corresponds to the critical density of the CO transition ( K), needed to excite the line collisionally. The mass of gas which has a temperature high enough (T 750 K) to excite the PACS CO lines, , is – in any of the models – small compared to the total disc mass (). However, for larger flaring parameters, more gas can be irradiated and heated directly by the star to temperatures high enough for the excitation of the high- CO lines: for , = , for , = and for , = ; an increase up to a factor 10 with increasing flaring. Furthermore, the radial extent of the warm region also increases with amount of flaring. This is of importance, since BR12 find that lines up to can be optically thick so that the size of the emitting area determines the amount of line flux.
The abundance of CO (Figure 4g, 4h and 4i) is dominated by photodissociation in the upper atmosphere and the inner rim of the disc. The “warm-finger” of CO is produced by CO formation through the reaction of C+ with H2 to CH+ which only proceeds at high gas temperature (Jonkheid et al. jonkheid2007 (2007); Agúndez et al. agundez2008 (2008)). Starting from CH+, a chain of reactions through CO+ and HCO+ then leads to CO. CH+ is detected in both HD 97048 and HD 100546 (Thi et al. thi2011 (2011); paper I). The CO lines discussed in this section form at large heights in the disc atmosphere and are not affected by any chemistry lower in the disc.
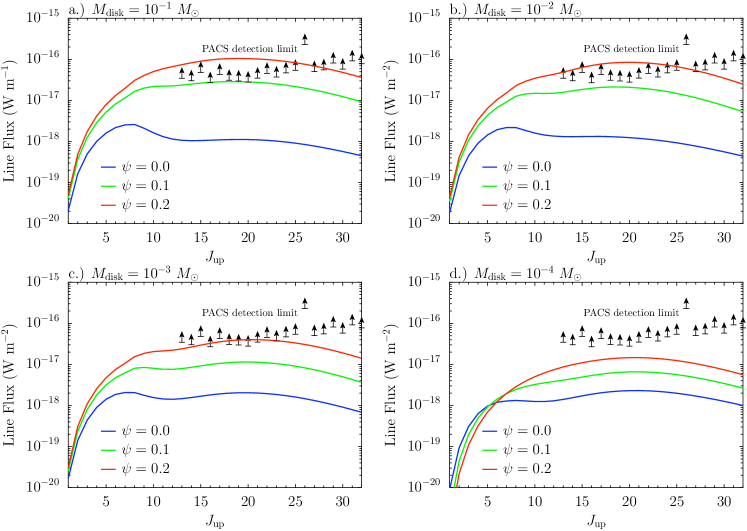
The CO ladder derived from the grid of models is shown in Figure 5. Lines with are convolved to the beam of the APEX telescope which has been used to detect these lines towards Herbig discs (e.g. Panić et al. panic2010 (2010)). Higher lines are convolved to the beam of the PACS instrument. Typical PACS detection limits are shown by the example of AB Aur. We find that indeed the flux in the PACS lines depends considerably on the flaring of the disc. This is a direct result of the increasing mass of several 100 K warm gas with the flaring parameter .
On the other hand, the shape of the CO ladder does not vary significantly with disc mass, as long as . While the CO lines above are optically thin, the equilibrium of gas heating and cooling processes yields similar amounts of gas warm enough to excite the CO lines. This result is different from the findings of BR12, because they leave the dust structure unchanged and vary the gas-to-dust ratio. In the models presented here, we vary both gas and dust mass and keep the gas-to-dust ratio constant. It is the amount of dust which absorbs the impinging stellar light that is key for the heating of the gas.
We conclude from this grid of thermo-chemical models, that the structure of the disc, and in particular the flaring which allows direct stellar irradiation of a larger volume of gas, is key for the understanding of the CO ladder observed by PACS. Non-flared discs produce too low line emission flux to be detected in our spectra.
5 Discussion
What other parameters can influence the strength of the CO emission? In what follows, we speculate about the influence that the PAH luminosity and the inner disc clearing can have on the far-IR CO emission. While PAHs are frequently detected in HAEBEs (up to 70%; Acke et al. acke2010 (2010)), they are seen in at most 15% of T Tauri discs (Geers et al 2006; Oliveira et al. 2007, 2010); therefore we concentrate our discussion on PAHs observed in HAEBEs.
5.1 PAH luminosity
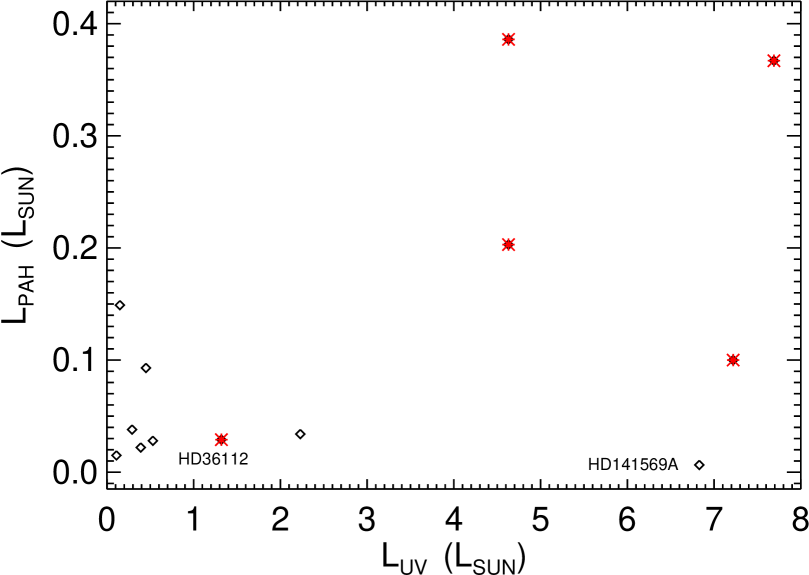
When present, PAHs contribute significantly to disc heating, absorbing UV photons in the upper disc layer after which they heat the disc through the photoelectric effect; as such they also have an influence on the observed line strengths (e.g. Kamp & Dullemond kamp2004 (2004); Bruderer et al. bruderer2012 (2012)). Therefore, we searched for a link between the PAH luminosity and the observed CO emission. If we consider the sources with the highest ( 4 ; AB Aur, HD 97048, HD 100546 - group I, and HD 141569 A, HD 150193 and HD 163296 - group II), we see that it contains equal amounts of sources with flaring and non-flaring discs, but the group II sources lack CO far-IR emission. As the amount of is not solely determining the strength of the CO lines, we now also take the PAH emission into account. In Table 1, we list for those objects where PAH bands are detected, while in Fig.6 we plot the as a function of for both sources with and without CO detections. The group II sources HD 150193 and HD 163296 do not show PAH emission features, while the transitional disc HD 141569 A only has weak PAH bands when compared to the group I sources: 0.007 versus 0.030 to 0.39 for the 5 HAEBEs with CO detections. This suggest that strong PAH emission, in addition to strong UV luminosity, enhances CO far-IR emission, consistent with the non-detection in HD 141569 A. However, the PAH luminosity does not uniquely determine the CO line flux. It is interesting in this context to mention studies of the ro-vibrational bands of CO at 4.7 m, revealing that HD 97048, HD 100546 and HD 141569 A have UV fluorescence, so that 5600 K, while their is distinct: 1000 K for the first two, and 250 K for HD 141569 A (van der Plas, Ph.D.; Brittain et al. brittain2007 (2007)), again indicating that the PAH luminosity is an important factor in the context of gas heating. However, BR12 showed that, in their model of HD 100546, a change in the PAH abundance changes the high- flux by less than a dex, leaving flaring as the most important parameter determining CO line fluxes.
5.2 Inner disc clearing
Based on a small sample of group I sources with spatially resolved mid-IR images, Maaskant et al. (maaskant2013 (2013)) suggest that group I sources have dust-depleted regions in the inner disc (50 AU) that let the radiation penetrate further out in the disc. As a result, the outer regions, most notable the inner edge of the outer disc, experience more heating causing an excess at mid- to far-IR wavelengths. On the other hand, no flat (group II) discs have reported gaps in the literature. This suggests that these discs are relatively more self-shadowed and consequently cooler in the outer parts of the disc. In our HAEBE sample with CO detections, HD 97048, HD 100546, IRS 48, HD 36112 and AB Aur all have dust-depleted inner regions (Maaskant et al. maaskant2013 (2013) for HD 97048; Bouwman et. al. bouwman2003 (2003) for HD 100546; Geers et al. geers2007 (2007), Brown et al. brown2012 (2012) and van der Marel marel2013 (2013) for IRS 48; Isella et al. isella2010 (2010) for HD 36112; Honda et al. honda2010 (2010) for AB Aur). This indeed suggests that inner dust clearing can result in more efficient heating of the outer layers, so that the amount of warm CO is increased.
5.3 Summary
The discussion above suggests that the CO line luminosity in HAEBEs can, besides dust and gas temperature decoupling in the surface layers (due to flaring) and high UV luminosity, also be enhanced by a combination of 1) PAH heating and 2) enhanced UV penetration of the outer disc due to a dust-depleted inner region. We expect these factors to also be inter-linked, but a detailed parameter study of disc models would be needed to explain the causality.
6 Conclusions
We analysed PACS spectra covering 53.5 to 190 m to study the far-IR CO ladder in a sample of HAEBE and TTS. Our results can be summarised as follows:
-
1.
Out of 22 HAEBEs and 8 TTS, we detected CO emission lines in only 5 HAEBE (23%) and 4 TTS (50%).
-
2.
In HAEBEs, the far-IR CO lines are only detected in flaring discs, indicating that the disc geometry (presence of a hot disc atmosphere) is important in creating detectable line emission. TTS with detections have evidence for a disc wind and/or outflow.
-
3.
The highest transition ( = 36 35), with = 3669 K) was observed in HD 100546 and the outflow source DG Tau.
-
4.
We constructed rotational diagrams for the objects with at least 3 CO detections, and derived between 200 and 500 K. The mean values of the warm components are K for the HAEBEs and K for the TTS. The HAEBE HD 100546 is the only object that clearly needs a second, hot component of 900 K, but other objects might also reveal a hot component when observed with a more sensitive instrument.
-
5.
We analysed the observed line fluxes with a small grid of thermo-chemical models. We found that an increased amount of flaring increased the CO line flux; a certain amount of flaring is necessary for the lines to become detectable with PACS and can increase the line flux by a factor 10. This is a direct result of the increase in warm gas mass with increasing amount of flaring where and are decoupled. Furthermore, we found that the disc mass is not a sensitive parameter, as long as it is higher than a few 10-4 M⊙.
-
6.
For the HAEBEs, amongst the group I sources, the ones with highest have detectable CO lines.
-
7.
In TTS, sources with strong Pf- lines (a tracer of accretion rate) tend to have CO emission, perhaps because of the UV heating provided by the accretion column. However, a quantitative connection between and CO detections is not yet clear.
-
8.
We suggest that both strong PAH luminosity and the presence of a dust-depleted inner disc region can increase disc heating, and by consequence, enhance the far-IR CO line luminosities.
Acknowledgements.
We would like to thank the PACS instrument team for their dedicated support. G. Meeus is supported by Ramon y Cajal grant RYC-2011-07920. B. Montesinos is partly supported by AYA-2011-26202. Support for this work, part of the Herschel ’Open Time Key Project’ Program, was provided by NASA through an award issued by the Jet Propulsion Laboratory, California Institute of Technology. PACS has been developed by a consortium of institutes led by MPE (Germany) and including UVIE (Austria); KUL, CSL, IMEC (Belgium); CEA, OAMP (France); MPIA (Germany); IFSI, OAP/AOT, OAA/CAISMI, LENS, SISSA (Italy); IAC (Spain). This development has been supported by the funding agencies BMVIT (Austria), ESA-PRODEX (Belgium), CEA/CNES (France), DLR (Germany), ASI (Italy), and CICT/MCT (Spain). This paper is based [in part] on observations made with ESO Telescopes at the Paranal Observatory under program ID 179.C-0151. This research has made use of the SIMBAD database, operated at CDS, Strasbourg, France.References
- (1) Acke, B., Bouwman, J., Juhász, A. et al. 2010, ApJ 718, 558
- (2) Agúndez, M., Cernicharo, J. and Goicoechea, J.R. 2008, A&A 2008, 483, 831
- (3) Bary, J.S., Weintraub, D.A., Shukla, S.J. et al. 2008, ApJ 678, 1088
- (4) Bast, J.E., Brown, J.M., Herczeg G.J. et al. 2011, A&A 527, 119
- (5) Benisty, M., Tatulli, E., Ménard, F. and Swain, M.R. 2010, A&A 511, A75
- (6) Bitner, M.A., Richte, M.J., Lacy, J.H. et al. 2008, ApJ 688, 1326
- (7) Blake, G.A. and Boogert, A.C.A. 2004, ApJ 606, 73
- (8) Bouwman, J., de Koter, A., Dominik, C. and Waters, L.B.F.M. 2003, A&A 401, 577
- (9) Brittain, S.D., Simon, Th. , Najita, J.R., and Rettig, T.W. 2007, ApJ 659, 685
- (10) Brown, J.M., Herczeg, G.J., Pontoppidan, K.M. and E.F. van Dishoeck 2012, ApJ 744, 116
- (11) Brown J. M., Pontoppidan, K. M., van Dishoeck, E.F. et al. 2013, ApJ, accepted
- (12) Bruderer, S., van Dishoeck, E.F., Doty, S.D. and Herczeg, G.J. 2012, A&A 541, 91
- (13) Carmona, A., van den Ancker, M.E., Henning, Th. et al. 2008, A&A 477, 839
- (14) Carmona, A., van der Plas, G., van den Ancker, M.E. et al. 2011, A&A 533, A39
- (15) Dent, W.R.F., Greaves, J.S., Coulson, I.M. 2005, MNRAS 359, 663
- (16) Dominik, C., Dullemond, C.P., Waters, L.B.F.M. et al. 2003, A&A 398, 607
- (17) Dullemond, C.P., Dominik, C. and Natta, A. 2001, ApJ, 560, 957
- (18) France, K., Schindhelm, E., Herczeg, G. J., et al. 2012, ApJ, 756, 171
- (19) Geers, V.C., Augereau, J.-C., Pontoppidan, K.M. et al. 2006, A&A 459, 545
- (20) Geers, V.C., Pontoppidan, K.M., van Dishoeck, E.F. et al. 2007, A&A 476, 279
- (21) Giannini, T., Lorenzetti, D., Tommasi, E. et al. A&A 346, 617
- (22) Goldsmith, P.F., and Langer, W.D. 1999, ApJ 517, 209
- (23) Goto, M., Usuda, T., Dullemond, C.P. et al. 2006, ApJ 652, 758
- (24) Green, J. D., Evans, N. J. II, Jörgensen, J. K. et al. 2013, ApJ, accepted (arXiv:1304.7389)
- (25) Hersant, F., Wakelam, V., Dutrey, A. et al. 2009, A&A 493, L49
- (26) Herczeg, G. J., Walter, F.M., Linsky, J.L. et al. 2005, AJ 129, 2777
- (27) Herczeg, G. J., Linsky, J.L., Jeffrey, L. et al. 2006, ApJS 165, 256
- (28) Honda, M., Inoue, A.K., Okamoto, Y.K. et al. 2010, ApJ718, 199
- (29) Ingelby, L., Calvet, N., Bergin, E. et al. 2011, ApJ 743, 105
- (30) Isella, A., Natta, A., Wilner, D., Carpenter, J.M. and Testi, L. 2010, ApJ725, 1735
- (31) Jonkheid, B., Dullemond, C. P., Hogerheijde M. R., & van Dishoeck, E. F. 2007, A&A, 463, 203
- (32) Juhász, A., Bouwman, J. Henning, Th. et al. 2010, ApJ 721, 431
- (33) Karska, A., Herczeg, G.J., van Dishoeck, E.F., et al. 2013, A&A 552, 141
- (34) Kamp, I., and Dullemond, C.P. 2004, ApJ615, 991
- (35) Kamp, I, Woitke, P., Pinte, C. et al. 2011, A&A 532, 85
- (36) Koerner, D.W., and Sargent, A.I. 1995, AJ 109, 2138
- (37) Lahuis, F., van Dishoeck, E.F., Blake, G.A. et al. 2007, ApJ 665, 492
- (38) Lavalley-Fouquet, C., Cabrit, S. and Dougados, C. 2000, A&A 356, L41
- (39) Maaskant, K. M., Honda, M., Waters, L.B.F.M. et al. 2013, arXiv:1305.3138
- (40) Martin-Zaïdi, C., Habart, E., Augereau, J.-C. et al. 2009, ApJ, 695, 1302
- (41) Martin-Zaïdi, C., Augereau, J.-C., Ménard, F. et al. 2010, A&A 516, A110
- (42) Meeus, G., Waters, L.B.F.M., Bouwman, J. et al. 2001, A&A 365, 476
- (43) Meeus, G., Montesinos, B., Mendigutía, I. et al. 2012, A&A 544, 78
- (44) Mundt R. 1984, ApJ280, 749
- (45) Najita, J., Carr, J.S., and Mathieu, R.D. 2003, ApJ 589, 931
- (46) Öberg, K.I., Qi, C., Fogel, J.K.J. et al. 2010, ApJ 720, 480
- (47) Panić, O., Hogerheijde, M.R., Wilner, D., and Qi, C. 2008, A&A 491, 219
- (48) Panić, O. and Hogerheijde 2009, A&A 508, 707
- (49) Panić, O., van Dishoeck, E. F., Hogerheijde, M. R., et al. 2010, A&A, 519, A110
- (50) Pilbratt, G. et al. 2010, A&A 518, L1
- (51) Podio, L., Kamp, I. et al. 2012, A&A, 545, 44
- (52) Poglitsch et al. 2010, A&A 518, L2
- (53) Pontoppidan K.M., Blake, G.A., van Dishoeck, E.F. et al. 2008, ApJ 684, 1323
- (54) Pontoppidan K.M., van Dishoeck, E.F., Blake, G.A. et al. 2011, Msngr, 143, 32
- (55) Röllig, M., Abel, N. P., Bell, T., et al. 2007, A&A, 467, 187
- (56) Salyk, C., Blake, G.A., Boogert, A.C.A. and Brown, J.M. 2009, ApJ 699, 330
- (57) Salyk, C., Blake, G.A., Boogert, A.C.A., and Brown, J.M. 2011, ApJ 743, 112
- (58) Salyk, C., Herczeg, G.J., Brown, J.M. et al. 2013, ApJ769, 21
- (59) Sturm, B., Bouwman, J., Henning, T., et al. 2010, A&A, 518, L129
- (60) Thi, W. F., van Dishoeck, E. F., Blake, G. A., et al. 2001, ApJ, 561, 1074
- (61) Thi, W. F., Ménard, F., Meeus, G. et al. 2011, A&A 530, L2
- (62) Thi, W. F., Kamp, I., Woitke, P. et al. 2013, A&A 551, 49
- (63) van de Marel, N., van Dishoeck, E.F., Bruderer, S. et al. 2013, Sci 340, 1199
- (64) van der Plas, G., van den Ancker, M.E., Acke, B. et al. 2009, A&A 500, 1137
- (65) Weingartner, J. C. & Draine, B. T. 2001, ApJ, 548, 296
- (66) Williams, J.P. and Cieza, L.A. 2011, ARA&A 49, 67
- (67) Woitke, P., Pinte, C., Tilling, I., et al. 2010, MNRAS 405, L26
- (68) Yang, H., Herczeg, G.J., Linsky, J.L. et al. 2012, ApJ 744, 121
Appendix A Detection of CO transitions
In Table 5, we list the transitions that were detected in our PACS spectra, while in Figs. 7 to 14, we show windows around the position of the CO lines for those objects where CO line emission was detected.
| Transition | Wavelength (m) | (K) |
|---|---|---|
| 36 35 | 72.84 | 3669 |
| 35 34 | 74.89 | 3471 |
| 34 33 | 77.11 | 3279 |
| 33 32 | 79.36 | 3093 |
| 32 31 | 81.81 | 2911 |
| 31 30 | 84.41 | 2735 |
| 30 29 | 87.19 | 2565 |
| 29 28 | 90.16 | 2400 |
| 28 27 | 93.35 | 2240 |
| 25 24 | 104.45 | 1794 |
| 24 23 | 108.76 | 1657 |
| 23 22 | 113.46 | 1524 |
| 22 21 | 118.58 | 1397 |
| 21 20 | 124.19 | 1276 |
| 20 19 | 130.37 | 1160 |
| 19 18 | 137.20 | 1050 |
| 18 17 | 144.78 | 945 |
| 17 16 | 153.27 | 846 |
| 16 15 | 162.81 | 752 |
| 15 14 | 173.63 | 663 |
| 14 13 | 186.00 | 581 |
Appendix B Upper limits
In Tables 6.1 and 7.2, we give the upper limits at a few key transitions (36 35, 29 28, 23 22, 18 17, and 15 14) for those sources where not a single CO emission line was detected.
| Object | 36 35 | Cont. | 29 28 | Cont. | 23 22 | Cont. | 18 17 | Cont. | 15 14 | Cont. |
|---|---|---|---|---|---|---|---|---|---|---|
| 72.8 m | 90.2 m | 113.5 m | 144.8 m | 173.6 m | ||||||
| HD 35187 | 5.7 | 4.9 | – | – | 16.7 | 3.3 | 10.8 | 2.9 | – | – |
| HD 38120 | 20.2 | 8.6 | 25.5 | 7.6 | 11.9 | 5.3 | 9.6 | 4.0 | 13.7 | 3.1 |
| HD 50138 | 33.0 | 5.7 | 33.6 | 3.9 | 12.9 | 20.1 | 12.7 | 1.22 | 17.1 | 0.95 |
| HD 100453 | 67.1 | 35.3 | 20.7 | 30.3 | 14.5 | 20.5 | 9.8 | 15.9 | 19.1 | 14.0 |
| HD 104237 | 53.9 | 9.3 | 27.6 | 8.6 | 13.9 | 6.4 | 11.7 | 4.8 | 19.0 | 4.3 |
| HD 135344 | 24.6 | 31.2 | 19.1 | 30.7 | 12.8 | 24.9 | 6.9 | 20.5 | 15.5 | 18.2 |
| HD 139614 | 32.8 | 18.3 | 21.7 | 17.1 | 11.2 | 13.4 | 9.5 | 12.1 | 17.2 | 11.7 |
| HD 142527 | 7.6 | 109.7 | 37.2 | 95.1 | 29.6 | 74.4 | 22.1 | 63.1 | 37.9 | 56.2 |
| HD 144668 | 36.8 | 5.6 | 21.5 | 4.5 | 13.4 | 2.8 | 8.2 | 1.9 | 20.1 | 1.7 |
| HD 163296 | 4.1 | 19.0 | 23.9 | 21.7 | 13.6 | 19.3 | 11.8 | 19.1 | 16.6 (5.1) | 19.4 |
| HD 169142 | 121.3 | 27.1 | 53.5 | 24.1 | 33.0 | 19.2 | 20.4 | 17.8 | 20.1 | 16.1 |
| HD 179218 | 22.8 | 21.0 | 13.9 | 16.4 | 10.1 | 10.7 | 6.5 | 7.2 | 12.2 | 5.7 |
| SR 21 | 32.3 | 33.5 | 26.4 | 29.9 | 11.0 | 21.8 | 11.3 | 16.6 | 18.9 | 13.9 |
| Object | CO 38 37 | Cont. 70.9 m | CO 21 20 | Cont. 124m |
|---|---|---|---|---|
| HD 98922 | 30.8 | 6.1 | 7.5: (3.2) | 1.1 |
| HD 141569 | 22.6 | 5.4 | 13.1 | 2.1 |
| HD 142666 | 30.1 | 6.7 | 11.9 | 5.1 |
| HD 144432 | 16.7 | 5.8 | 8.0 | 2.9 |
| HD 150193 | 24.7 | 7.2 | 7.1 | 3.2 |
| HT Lup | 50.2 | 6.2 | 23.9 | 11.0 |
| RU Lup | 22.0 | 5.9 | 9.0 | 4.2 |
| RY Lup | 20.3 | 6.3 | 8.6 | 3.9 |
| RNO90 | 25.6 | 3.8 | 11.9 | 2.1 |