Time Development of Early Social Networks: Link analysis and group dynamics
Abstract
Empirical data on early network history are rare. Students beginning their studies at a university with no or few prior connections to each other offer a unique opportunity to investigate the formation and early development of social networks. During a nine week introductory physics course, first year physics students were asked to identify those with whom they communicated about problem solving in physics during the preceding week. We use these students’ self reports to produce time dependent student interaction networks. These networks have also been investigated to elucidate possible effects of gender and students’ final course grade. Changes in the weekly number of links are investigated to show that while roughly half of all links change from week to week, students also reestablish a growing number of links as they progress through their first weeks of study. To investigate how students group, Infomap is used to establish groups. Further, student group flow is examined using alluvial diagrams, showing that many students jump between group each week., Finally, a segregation measure is developed which shows that students structure themselves according to gender and laboratory exercise groups and not according to end-of-course grade. The results show the behavior of an early social-educational network, and may have implications for theoretical network models as well as for physics education.
I Introduction
The formation and evolution of (social) networks has been modeled by many researchers, who have have investigated theoretical models of mechanisms for producing networks resembling empirical networks Barabási and Albert (1999); Liben-Nowell (2005); Caldarelli et al. (2002); Kim et al. (2005); Rosvall and Sneppen (2006). However, longitudinal network data is rare Kossinets and Watts (2006), and it is difficult to obtain network data from the time, , at which the network begins to form. Here, we investigate longitudinal social network data from a time close to .
Students beginning their university studies with few or no prior connections to each other, are in a new situation, and will presumably make new connections with other students as a natural part of their studies. Many of them will also become socially involved, which also involves making new connections to other students. As the students become both academically and socially integrated they may change the ways in which they are connected, and this might happen on a short time scale, perhaps daily or weekly. Thus, investigating high resolution network data from such students may offer insights as to how such networks form and how they evolve.
If students beginning their studies do not know the other students, we could expect them to try out many different possibilities for interaction. Some of these interactions will be deemed worthwhile by the student, and thus continue each week. Another would be that they do not interact much at all, but work alone. Finally, one might expect that the high performing students would become central "nodes", due to word of mouth (i.e. as a student you would hear about student X who is a high performing student, and then you would try to communicate with him to understand the subject better). These early patterns of interactions in social networks are largely unknown from an empirical point of view.
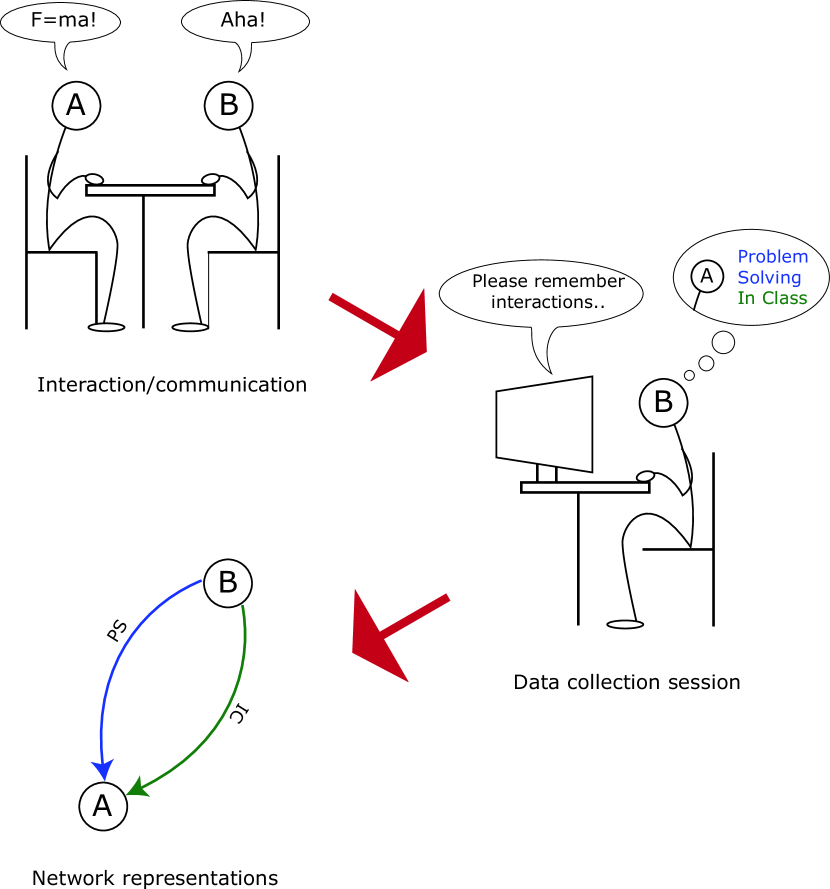
This study investigates early interaction patterns among approximately 170 students enrolled in an introductory mechanics course at the University of Copenhagen. Students report which interactions they remember in different categories (see Figure 1) related to physics learning and social communication. Naming another student naturally involves a direction (that is, A "names" B is A to B), so the network connections are directed. Self-reported measures are notorious for being biased Liben-Nowell (2005); Liljeros et al. (2001); however, unlike potentially more objective measures, they can tell us what students are interacting about. Also, using e-mails, phone calls, or digital proximity as proxies for social ties, may be misleading. For example, it has been found Eagle et al. (2009) that people remember their friends rather than remembering everyone they are near to as measured by digital means. In contrast, asking students who they remember having communicated with about some subject (in this case, physics and social interactions), does indicate what the interaction was about. In this work we try to minimize bias Marsden (2011); Liljeros et al. (2001); Pustejovsky and Spillane (2009) by only asking about remembered interactions and not asking students to rank these relations in any way. In particular, we do not ask the students to judge the quality of the interaction in any way, althoughrecent work Bruun and Brewe (2013) suggests that interactions remembered by students are more useful to them than are non-remembered interactions.
To build an understanding of the processes underlying the formation and evolution of social networks, researchers have related network measures to non network node properties. That is, the effects on the network of individual actions by the nodes (in our case, students). For example, for university students the the probability of making new social connections has been tied to the number of classes taken together Kossinets and Watts (2006). Also in a twenty year long study, people with increasing body mass index (BMI) tend to cluster together Christakis and Fowler (2007). Thus relating the calculations we can perform on networks to the socially relevant variables leads to knowledge of the social processes relevant to network formation.
One process occurring in social networks is the tendency for similar nodes to connect or be directly connected, referred to as homophily Kossinets and Watts (2006). However, in many networks, nodes are seen to group together in clusters (or modules) Clusters are usually identified by community detection algorithms Lancichinetti and Fortunato (2009). Nodes belonging to the same cluster need not be similar or directly connected. However, in these groups, information presumably flows more easily, and even if the probability for a single node to associate with similar nodes is high, random connections to non-similar people will occur, thus diminishing the similarity within the group.
Recently, the Infomap algorithm Rosvall and Bergstrom (2008) has been used to find clusters and inter-cluster structure in networks, employing an information flow based perspective on grouping. Since the links in this study represent student communication, this perspective seems appropriate. Also, Infomap has been shown to perform well on directed networks compared to other grouping algorithms Lancichinetti and Fortunato (2009), and changes of Infomap groupings of different networks with overlapping nodes can easily be visualized with alluvial diagrams Rosvall and Bergstrom (2010). Thus, we might expect Infomap to help find relevant groups of students interacting with each other.
Such groupings allow us to investigate how students structure themselves during their first months at university. To quantify how students structure themselves in groups we employ a measure of segregation based on Kullback-Leibler divergence Niven (2005). This measure is applied to each group to see how these groups were segregated compared to the cohort’s distribution of grade, gender, and class number. Further, by giving each group’s segregation a weight proportional to the number of students in it, the segregation for the whole network can be calculated. Thus, the segregation is a measure of how each group and the whole network is structured according to a given attribute, compared with the cohort’s distribution.
After explaining the background for data collection (Section II), we present empirical networks of self-reported interactions among the students in an introductory physics course at the University of Copenhagen (Section III). Here we find that link patterns change from week to week but that many links are reestablished later on. Further, in Section IV an alluvial diagram shows how students jump between groups but that groups seem to stabilize at the end of the measurement. Finally, the segregation measure is developed in Section V, and in Section VI used with groups found with Infomap to show that students do not structure themselves according to grade but primarily according to their laboratory exercise groups, and somewhat according to gender. This is followed by a conclusion in Section VII.
II Background
II.1 Cohort and context
Students were allotted time during the obligatory weekly laboratory exercises to fill out online self-report surveys. Typically, students would fill out the survey at some time during the lab exercise, although some chose to fill it out at home. They were encouraged to fill out the survey at the beginning of a lab class, but some fitted in the survey when a natural break came in their lab activities. Students were told that their answers would be confidential and could not be used by their instructors/lecturers to identify individuals. Partcipation was not mandatory, although students were encouraged repeatedly to to take part in the study. The students in the course attend four hours of (non required) lecture per week. The students are assigned to sections, of which there are seven, and have the opportunity to attend four hours of problem solving sessions . Due to budgetary and space constraints, it is not possible to have the required laboratory exercises concurrently, so these are spread throughout the week. The same sections are also used in the introductory math course taken by these students. Given this, students who attend all sessions on offer will spend at least 24 hours a week together, with roughly 15 hours of this spent in small (less than 30) sections of students.
We can, therefore, assume that a student answered the survey at the same time of week from one week to another. That is, if student answers the survey on a Tuesday afternoon one week, chances are that student answers the survey on the following Tuesday again. However, students were allowed to switch lab exercise hours, if for some reason they were not able to make it to the scheduled one. Typically, 3 or 4 students per week attended another section. Thus, there is some fuzziness with regards to when student answers are recorded.
The measurements were done during a course in introductory mechanics and special relativity at a large Danish University. Students are primarily ethnic Danes. The majority (roughly 85%) of students are physics majors who have just started their studies. Some major in other disciplines (for example mathematics), but are allowed to choose this physics course as part of their study plans.
II.2 Description of survey and data collection
The online survey was divided into two parts each week; an academic part and a social part. The academic part consisted of 9 interaction categories, while the social part consisted of 3 interaction categories. The categories were developed through a mixed methods pilot project prior to data collection Bruun (2012), and in this study we only examine the category pertaining to communication concerning problem solving. A weekly format was chosen based on Eagle et al. (2009) who found the greatest correspondence between self reported networks and digitally measured proximity networks if the interactions were reported within a week. While more finely grained temporal data would be interesting, conversations with a number of students indicate that asking for answers more often than once per week would lead to survey fatigue and significantly lower participation.
Students were given a login to a learning management system, where they could take the survey each week. For each interaction category, students marked each of the students they remembered having had interactions with. Names of possible students (all students enrolled in the course) were given in a rosterMarsden (2011). The researcher was present throughout most data collection sessions, and students were invited to ask if they had doubts on how to answer the survey. The researcher emphasized repeatedly that they should mention only the people they remembered, that their answers where anonymous, and that there was no implicit ranking of their friends.
III Resulting networks
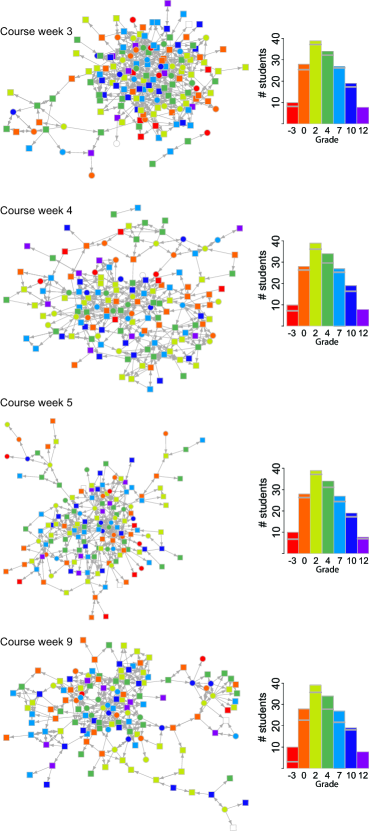
The introductory course has a duration of nine weeks, but there are only seven networks, four of which are displayed in Figure 2. Due to initial confusion about how to respond, many students did not answer the first two surveys, so the first two weeks’ data were combined. Further, due to a technical error, course week 6 data were not recorded. The networks do not seem to indicate much segregation according to the final grade earned in the course. The non-passing students (red and orange nodes) seem to move from being well integrated in the network to the periphery in week 5 and most red nodes are gone in week 9. This may be explained by the structure of the course, where students are continuously solving problems and getting grades. Thus, students who do poorly might simply have left the course. On the other hand, they might be pursuing the course without participating in the survey or being named by others.
Turning to the structure of the networks, they evolve from a compact to a more stringy nature. This may signify students’ tendency to form groups which are connected by bridges Wasserman and Faust (1994); Scott and Carrington (2011) as proposed by social network analysis. However, there may also be effects of survey participation since the number of students naming at least one other student is 124, 115, 98, and 83 for the four networks. This decline in participation could be due to student fatigue with respect to the survey Pustejovsky and Spillane (2009), an increased workload on the students towards the end of the course, student drop out, or to a combination of the three.
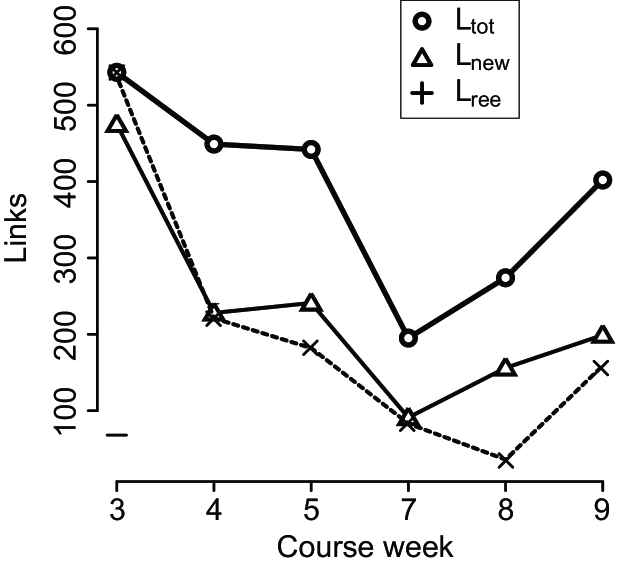
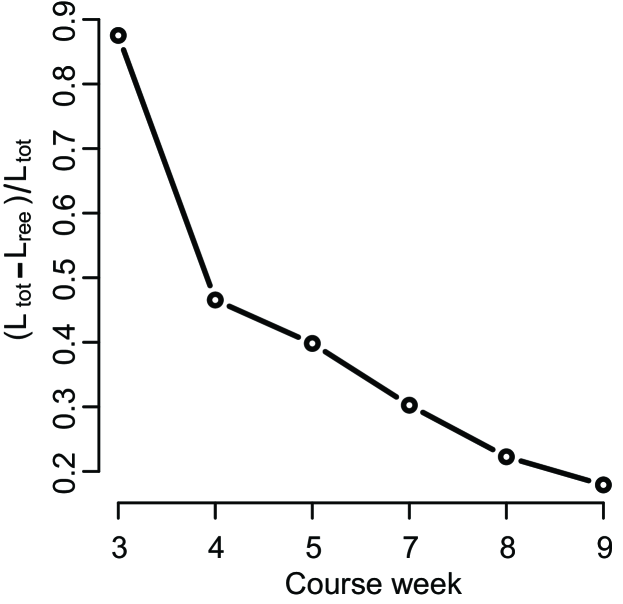
Figure 3 (a) show how the total number of links, change from week to week. The dip in course week 7 corresponds to the traditional Fall Break in most Danish educational institutions. However, it is peculiar, since this is an intensive course with no scheduled fall break. However, this would explain both the dip and the slow recovery in course week 8: In week 7 a larger number of students would be absent thus not answering the survey. In week 8 few people would list having had physics interactions with these students.
There are a considerable number of new links, , each week compared with the preceding week. Roughly half of the links each week are new compared to the preceding week. However, the number of re-established links, , comprise a larger and larger fraction of the total. For a given week, the number of re-established links is the number of links in the network which are present in at least one of the preceding weeks’ networks. Together, the variations in and may be used to form a hypothesis about how bonds are created during the early stages of this particular student network’s history: students try working with a lot of different collaborators. As they do this, they find out who they want to work with and return to them again. This is supported by Figure 3 (b), where the fraction of completely new links, , is shown to decrease over time. The number of unique links for all weeks is 1214, which is roughly 5% of the total number of possible links ( in a directed network with 140-160 nodes (). This implies that the decrease in completely new links is not due to a saturation of the network links.
IV Group flow
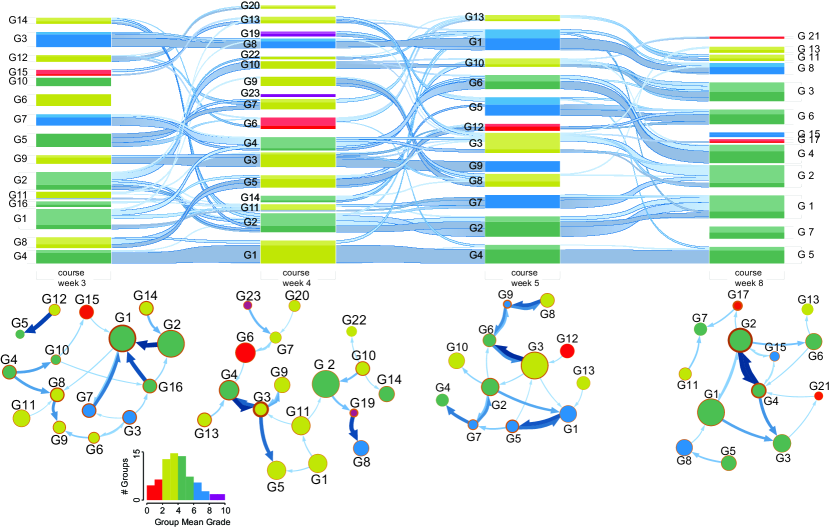
Figure 4 shows the alluvial diagram Rosvall and Bergstrom (2010) for student groups in the four networks displayed in Figure 2. The height of each is box proportional to the accumulated PageRank Brin and Page (1998) of the group. The color of the boxes mark what range the group mean grade falls in. Though there does not seem to be a connection between group mean grade and accumulated PageRank, the group mean grades seem to become more homogeneously distributed among the groups in the diagram in course week 9 compared with the preceding weeks.
The stream lines between each column indicates shifts in PageRank from one week to the other. Some groups seem stable throughout the course, but many changes happen between weeks. However, there are fewer stream lines between week 5 and 9 (38) than between the other weeks (46 and 51 respectively), which indicates that groups seem to stabilize somewhat over time. However, on a week to week basis groups seem to change a lot, especially in the beginning of the course.
Most boxes have a light and dark shade. The light shade indicates the accumulated PageRank of the students which are not significantly (90% confidence) attached to the group in question as found by a bootstrapping procedure Rosvall and Bergstrom (2010). This indicates that the students, which these light shaded boxes represent could not be reliably assigned to the group in question in a "bootstrap world" of resampled network.
Network maps are also shown in Figure 4. These map show groups of students as nodes with sizes proportional to the number of students in each group. They are again color coded according to the mean grade of the group, showing that there does not seem to be a clear cut relation between the number of people in the group and the group mean grade.
The arrows indicate probability flow, which we can relate to how many students in one group name students in another group. Since these namings indicate communication about problem solving, these arrows might indicate which groups are important for how problem solving knowledge is spread in the network. As such, they might provide an indication of which students need and which students can give help in an introductory physics course.
PageRank is an interesting measure for many networks, but here we can note that it would probably be more interesting if the stream lines and height of boxes represented actual students. Then we would be able to see more clearly which students move, what their attributes are, and how this affects group composition. We would also be able to see clearly, which students are difficult to assign into groups. Thus, in future work, it might be beneficial to change the interpretation of sizes in the alluvial diagram.
V Student segregation
To quantify how students with different attributes segregate, assume an attribute with possible values. For example, gender would have . A grouping algorithm now creates a grouping with different groups. Choosing a node at random in the network, the probability of choosing a female is . However, groups potentially have other distributions of males and females, so in the group, . In an information theoretical approach Niven (2005), the surprisal 111This is actually our cross-surprisal, that is the information gained relative to the information we had prior to investigating the grouping. is . For the whole group, our expectation of surprisal for the group is . This is an instance of Kullback-Leibler divergence Niven (2005). Treating the groups as independent sub-systems, the total weighted segregation for this particular grouping is .
In general, an attribute may have more possible values. If a student may only take one of these values, probability distributions and can be defined so that:
| (1) |
where is the total number of students in the grouping. The range of can be estimated as follows: If for all in all groups , . For perfect segregation, where for each group for the of the categories the segregation is 222. Adding groups with same yields . Finally use . .
Here, the segregations according to different attributes are calculated: Gender (), grade (), and lab class (). To see how different the segregations are from a random distribution of gender, grade, or lab class, the attributes are resampled, while keeping the module structure . It corresponds to changing the distribution, , in each group at random, while keeping the prior distribution, . This resampling is done a number of times (here, and each time , is calculated. Finally, the Z-score, , is calculated. Thus, the results will show the deviation from random variations.
VI Segregation results
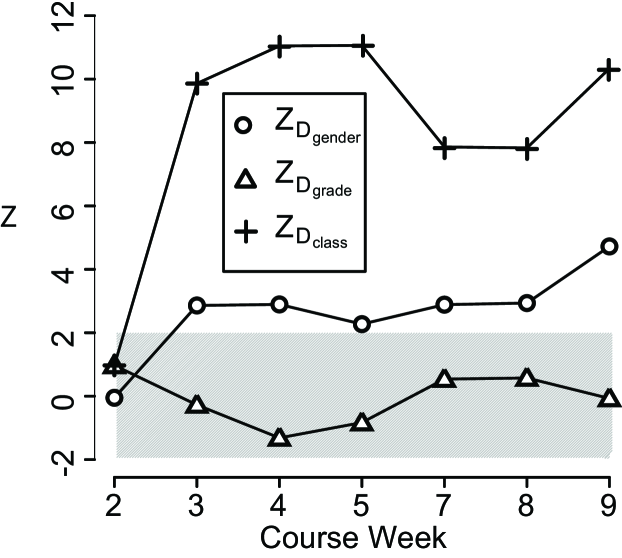
The results of the calculations for the whole network segregation from week to week during the course are shown in Figure5 (a). The expected distribution is calculated from the student present in the network. The first week shows neither significant segregation nor non-segregation. During the following weeks, students segregate significantly according to lab classes and to a lesser degree according to gender.
While there is significant segregation according to gender and lab class , students do not segregate or mix near perfectly. If students segregated perfectly, calculations show that the Z-scores would be around 20 for gender and around 40 for grade and lab class. If they did not segregate at all, that is if corresponding to perfect mixing, the Z-scores would be around -2 for gender and -4 for grade and lab class. Thus, groups do not consist for example of students from only one lab class but of clusters of students from different classes.
VII Conclusions
This study examined the early stages of network formation based on student reports of who they remember having communicated with about problem solving in physics. Seven networks made from weekly reports these types of communication in an introductory physics course were analyzed. In these networks less and less low performing students are represented, but the remaining students do not to segregate according to end-of-course grade.
The link analysis showed that roughly half of the links in a week were new compared with the preceding week. However, as the weeks go by, students communicate with former communication partners, which is indicated by the relative decrease in total links. Group flow patterns were were examined. Stream lines in alluvial diagrams show that while some groups seem stable throughout the different weeks, students seem to flow extensively between groups. Also, the alluvial diagram revealed that many students could not be significantly clustered together in groups. Finally, student segregation was analyzed using a divergence measure, called the segregation, which was applied to groups found with the Infomap grouping algorithm. This analysis showed that students segregate significantly compared to according to lab class number and to lesser extent gender, but not according to grade. It was also shown how individual groups found by Infomap could be analyzed.
The overall picture painted by these analyses is that students try out many different possibilities for collaboration in the first weeks but gradually settle to communicate with the same people. Some find study partners based on lab/problem solving classes and to some extent gender, with whom they continuously collaborate or reconnect with during the course. However, it is generally difficult for infomap to find assign these students to only one group. Further research could use the results from the link analysis to constrain models of network development. Another direction would be to further investigate Infomap groupings. Since Infomap yields information about which alternative groups it could find using bootstrap worlds, these groups could also be investigated with the segregation measure. As a final note, these results also have value for physics education research.
Acknowledgements.
We gratefully acknowledge the physics students who answered the survey. Without their help, there would be no network data. We also thank Professor Kim Sneppen for useful suggestions and discussions.References
- Barabási and Albert (1999) A. Barabási and R. Albert, Science 286, 509 (1999).
- Liben-Nowell (2005) D. Liben-Nowell, An Algorithmic Approach to Social Networks, Ph.D. thesis, Massachusetts Institute of Technology (2005).
- Caldarelli et al. (2002) G. Caldarelli, A. Capocci, P. De Los Rios, and M. Muñoz, Physical review letters 89, 258702 (2002).
- Kim et al. (2005) B. Kim, A. Trusina, P. Minnhagen, and K. Sneppen, The European Physical Journal B-Condensed Matter and Complex Systems 43, 369 (2005).
- Rosvall and Sneppen (2006) M. Rosvall and K. Sneppen, EPL (Europhysics Letters) 74, 1109 (2006).
- Kossinets and Watts (2006) G. Kossinets and D. J. Watts, Science 311, 88 (2006).
- Liljeros et al. (2001) F. Liljeros, C. R. Edling, L. A. N. Amaral, H. E. Stanley, and Y. Åberg, Nature 411, 907 (2001).
- Eagle et al. (2009) N. Eagle, A. Pentland, and D. Lazer, Proceedings of the National Academy of Science 106, 15727 (2009).
- Marsden (2011) P. V. Marsden, in The sage handbook of Social Network Analysis, edited by J. Scott and P. J. Carrington (Sage Publications, 2011) Chap. 25, pp. 370–388.
- Pustejovsky and Spillane (2009) J. Pustejovsky and J. Spillane, Social networks 31, 221 (2009).
- Bruun and Brewe (2013) J. Bruun and E. Brewe, Phys. Rev. ST Phys. Educ. Res. 9, 020109 (2013).
- Christakis and Fowler (2007) N. Christakis and J. Fowler, New England Journal of Medicine 357, 370 (2007).
- Lancichinetti and Fortunato (2009) A. Lancichinetti and S. Fortunato, Physical Review E 80, 056117 (2009).
- Rosvall and Bergstrom (2008) M. Rosvall and C. Bergstrom, Proceedings of the National Academy of Sciences 105, 1118 (2008).
- Rosvall and Bergstrom (2010) M. Rosvall and C. T. Bergstrom, PLoS ONE 5, e8694 (2010).
- Niven (2005) R. Niven, Arxiv preprint cond-mat/0512017 (2005).
- Bruun (2012) J. Bruun, Networks in physics education research: A Theoretical, Methodological, and Didactical Explorative Study, Ph.D. thesis, University of Copenhagen (2012).
- Wasserman and Faust (1994) S. Wasserman and K. Faust, Social network analysis: Methods and applications (1994).
- Scott and Carrington (2011) J. Scott and P. Carrington, The SAGE handbook of social network analysis (Sage Publications Ltd, 2011).
- Brin and Page (1998) S. Brin and L. Page, Computer networks and ISDN systems 30, 107 (1998).