Astronomical Society of JapanA Study of Selection Methods for H Emitting Galaxies at \Received2013/08/19
cosmology: large-scale structure of universe — cosmology: observations — techniques: photometric
A Study of Selection Methods for H Emitting Galaxies at for the Subaru/FMOS Galaxy Redshift Survey for Cosmology (FastSound)
Abstract
The efficient selection of high-redshift emission galaxies is important for future large galaxy redshift surveys for cosmology. Here we describe the target selection methods for the FastSound project, a redshift survey for H emitting galaxies at – using Subaru/FMOS to measure the linear growth rate via Redshift Space Distortion (RSD) and constrain the theory of gravity. To select target galaxies in the deg2 FMOS field-of-view from photometric data of CFHTLS-Wide (), we test several different methods based on color-color diagrams or photometric redshift estimates from spectral energy distribution (SED) fitting. We also test the improvement in selection efficiency that can be achieved by adding near-infrared data from the UKIDSS DXS (). The success rates of H detection with FMOS averaged over two observed fields using these methods are (color-color, optical), (color-color, optical+NIR), (photo-, optical), and (photo-, optical+NIR). Selection from photometric redshifts tends to give a better efficiency than color-based methods, although there is no significant improvement by adding band data within the statistical scatter. We also investigate the main limiting factors for the success rate, by using the sample of the HiZELS H emitters that were selected by narrow-band imaging. Although the number density of total H emitters having higher H fluxes than the FMOS sensitivity is comparable with the FMOS fiber density, the limited accuracy of photometric redshift and H flux estimations have comparable effects on the success rate of obtained from SED fitting.
1 Introduction
Recent cosmological observations, including distance measurements of Type Ia supernovae, temperature fluctuations of the Cosmic Microwave Background (CMB), and large galaxy redshift surveys, have revealed that the expansion of the Universe is accelerating. This phenonemon cannot be explained by conventional physics (see e.g., [Peebles & Ratra (2003)]; [Frieman, Turner, & Huterer (2008)]; [Weinberg et al. (2012)] for recent reviews). This acceleration may be caused by the existence of an unknown form of energy (so-called “dark energy”) coming into the energy-momentum tensor in the Einstein’s field equation. Another possibility is that the general relativity is not the correct theory of gravity on cosmological scales.
Observations of the large scale structure of the universe as traced by large spectroscopic galaxy survey are now attracting significant attention as a probe to investigate the nature of dark energy. For example, the baryon acoustic oscillation (BAO) signature found in the clustering pattern can be used as a standard ruler to measure the geometry of the universe and then to constrain the equation of state of the dark energy ([Cole et al. (2005)]; [Eisenstein et al. (2005)]; [Blake et al. (2011b)]; [Beutler et al. (2011)]; [Anderson et al. (2012)]). Galaxy redshift surveys also provide a useful test of the gravity theory on cosmological scales ([Hawkins et al. (2003)]; [Guzzo et al. (2008)]; [Blake et al. (2011a)]; [Samushia et al. (2012)]; [Reid et al. (2012)]; [Beutler et al. (2012)]; [de la Torre et al. (2013)]), because the amplitude of the redshift space distortion (RSD) induced by peculiar motions is related to the structure growth rate ([Kaiser (1987)]; [Hamilton (1998)]).
The FastSound project111http://www.kusastro.kyoto-u.ac.jp/Fastsound/ is a redshift survey of H emitting galaxies at , aiming at the first significant detection of RSD beyond . The survey utilizes the Fiber Multi-Object Spectrograph (FMOS, [Kimura et al. (2010)]) on the 8.3m Subaru Telescope, which can observe 400 simultaneous near-infrared spectra from within a 30 arcmin diameter field-of-view (FoV). The survey started in March 2012, and will collect in total galaxy redshifts in four fields with a total survey area of in two years. The main science goal is to measure the growth rate , where is the evolution of the growth factor with cosmic scale factor and is the total amplitude of matter fluctuations. The estimated accuracy of the RSD measurement is ,222http://www.subarutelescope.org/Science/SACM/Senryaku/FMOS_Cosmology_proposal.pdf which would give a stronger constraint on the theory of gravity than currently available from other RSD surveys at .
A key requirement for the FastSound survey design is to determine how to select the target galaxies efficiently from photometric data. To finalize the target selection method for FastSound, we carried out test observations using FMOS in September/October, 2011, where we tested several selection methods, e.g., color-based selections versus photometric-redshift-based selections, and pure optical-band selections versus adding near-infrared bands. The aim of this paper is to report the results of this pilot study. Though the objective here is mainly for the FastSound project, the results will also be useful for efficient selection of emission-line galaxies or star-forming galaxies at high redshifts, which can aid the design of even larger future cosmological surveys. We will also examine the factors limiting the selection efficiency by comparing our results with the statistics of emission line galaxies detected by narrow-band imaging from the HiZELS survey ([Geach et al. (2008)]; [Sobral et al. (2013)]).
This paper is organized as follows. In §2, we describe the photometric data used to select targets, the methods of estimating photometric redshifts and H fluxes, and the selection methods tested. In §3, the data reduction is presented briefly, followed by the description of the automated emission line detection method used. The main results are presented in §4, and we summarize our results in §5. Throughout this paper, all magnitudes are given in the AB system, and a standard cosmology of is adopted.
2 Target Selection for FMOS Observation
2.1 Input Photometric Galaxy Catalogues for Selection
For the FastSound project, we must efficiently select target galaxies which are detectable by FMOS in an exposure time of 30 min (H emission line fluxes of at –) in a survey area of . We adopted the Canada-France-Hawaii Telescope Legacy Survey (CFHTLS) Wide as the primary photometric data set for the target selection. We used the MAG_AUTO magnitudes of , and filters of the -selected merged catalogue in the CFHTLS-Wide W1 and W4 fields generated by Gwyn (2012) for these test observations. The approximate limiting magnitudes are , , , , and respectively ( completeness level for point sources).
In of the CFHTLS W1 field and of the W4 field, near-infrared band data are also available from the UKIDSS deep Extragalactic Survey (UKIDSS DXS: Lawrence et al. (2007)) DR8, whose limiting magnitude is (, point-source), and we use these data to test the usefulness of adding NIR data to the selection criteria. The Galactic extinction was corrected using the maps of Schlegel et al. (1998).
2.2 Color-based Selection
(80mm,80mm)figure1a.eps \FigureFile(80mm,80mm)figure1b.eps
(80mm,80mm)figure2.eps
The first simple method that we test is a selection by galaxy colors. We empirically determined the color selection criteria to select galaxies whose H fluxes are expected to be strong, based on H flux estimates from SED fittings and photometric redshift calculations using deep optical+NIR photometry of galaxies in the Subaru deep Field and the Subaru XMM-Newton deep Field (Sumiyoshi et al. 2009). For this observational study we test the following color selection criteria. In the case of selection using only optical photometry of CFHTLS wide, we adopt: , , . These conditions are shown in color-color diagrams of Figure 1. In addition to these color conditions, we also adopt a magnitude range of , which is empirically determined from past FMOS observations.2 In this figure the galaxies are color-coded according to photometric redshifts described in §2.3. Approximately one third of galaxies with – that we want to observe are populated in the regions of the above conditions, while more than 90% of the galaxies outside this redshift range are rejected. We varied the magnitude thresholds of in a range of – so that target galaxies are available for a FoV (see Table 2 for values in each field).
The photo- distribution of color-selected galaxies is displayed in Figure 2. The distribution of all galaxies found in the primary catalog is overlaid. The distribution of selected galaxies indeed has its peak at around , though there still remain low-redshift galaxies that would be a contamination in our target sample.
For the test of color selection using the NIR band, we further added a condition of , to account for the redshifted Å break falling between and . However, we found that this condition was too strong to retain targets in the FMOS FoV for the W4 field, and hence the condition was relaxed to (see §3).
2.3 Selection by Photometric Redshifts and H Flux Estimation
The second method we tested is based on photometric redshift estimates and H flux estimates from SED fitting. For galaxies brighter than , the CFHTLS T0006 official photometric redshifts are available (Ilbert et al. (2006), Coupon et al. (2009)), and we use these. The redshift accuracy is around at , at , and at . However, no photometric redshift estimate is provided for galaxies fainter than due to the poor reliability estimates of the photometry. Here, since we wish to increase the chance of observing galaxies, we computed photometric redshifts for galaxies at by ourselves using the public code LePhare (Arnouts et al. (1999), Ilbert et al. (2006)) according to the description of Coupon et al. (2009). When a galaxy is not detected in one of the band filters, the band was simply not used in the photo- calculation.
Photometric zero-point calibration using galaxies with known spectroscopic redshifts is important for the accuracy of photometric redshift calculation. Since the spectroscopic data of the VVDS (VIMOS-VLT Deep Survey: Le Fèvre et al. (2005); Garilli et al. (2008))333http://cesam.oamp.fr/vvdspub/ deep and wide survey data are available on the area of CFHTLS W1 and W4 respectively, we used them to perform the zero-point calibration of CFHTLS wide photometry, although they are outside the redshift range of our survey. The VVDS survey depths are for VVDS deep and for VVDS wide. We used galaxies with flags of 2–4 ( 80–99% secure redshifts), (one secure spectral feature in emission), –, or (similar to 2–4, 9 but flags for broad line AGNs) for both VVDS deep and wide to assure secure redshift determination. Galaxies from VVDS deep and wide public data with magnitudes brighter than are matched with CFHTLS W1 and CFHTLS W4, respectively, and used for the derivation of photometric calibrations. The sample sizes of VVDS-CFHTLS are (CFHTLS W1) and (W4), and the redshift medians are and , respectively.
These photometric redshifts are based on empirical SED templates of Ell, Sbc, Scd, Irr (CWW; Coleman et al. (1980)), interpolated SEDs from CWW, and two starbursts from Kinney et al. (1996). H fluxes cannot be estimated simply from these results, because the empirical templates do not include any details on the physical galaxy properties such as stellar mass or star formation rate. Therefore we further performed fitting with theoretical SED templates from PEGASE2 (Fioc & Rocca-Volmerange (1997)), Scalo IMF (Scalo (1986)) and solar abundance, fixing the redshifts at those estimated using the empirical SED templates. We use models of exponentially declining star formation histories with the exponential time scales ranging – Gyr, and a constant SFR model. The dust extinction is taken into account assuming the Calzetti law (Calzetti et al. 2000) in the range of –. Then we calculate the intrinsic H flux from SFR by the conversion factor which is based on Kennicutt (1998) and of which the offset is calibrated using SDSS galaxies (Brinchmann et al. (2004), Sumiyoshi et al. (2009)). Finally, the observable H flux is calculated taking into account extinction using the value obtained from the SED fit. Here, we followed the prescription of Cid Fernandes et al. (2005) to take into account that the extinction of H flux (from hot ionized gas region) is generally higher than that of stellar radiation estimated from SED fittings.
For the photo- selection using optical bands, first we selected target galaxies at , and . The constraints on magnitude and color are added empirically, since we learned from the past FMOS observations that bluer galaxies have higher probability of detectable emission lines, and that galaxies fainter than are not usually detected at our survey limits. The dependence of the selection efficiency on the threshold will be discussed in §4.1.
Then we select galaxies with bright estimated H fluxes, with a flux threshold determined to keep target galaxies for one FMOS field. The typical threshold flux is (see Table 2 for the values in each field).
In the case of photo- selection using NIR band, we repeated the same procedures as above, except that we calculated photo-’s for all the galaxies because the CFHTLS official photometric redshifts are based only on the optical bands. It should be noted that only about 70% of all the CFHTLS Wide galaxies are detected in the UKIDSS band, and the fraction in the galaxies selected as the FMOS target is also similar. Photo-’s of the galaxies not detected in are calculated only with the optical bands, and this may limit the improvement of the line detection rate by adding a NIR band. We will also test the effect of including the band on the target selection efficiency in §4.1.
Finally, it should also be noted that our target selection does not include particular conditions to remove AGNs. Therefore we expect a contamination of AGNs in our sample, but examination of line widths of detected galaxies by our FMOS observation indicates that the fraction is not large.
| Field | RA(J2000) | DEC(J2000) | selection | band | mean E(B-V) |
|---|---|---|---|---|---|
| W1_001 | 02:25:51.85 | 04:27:00.0 | color | optical | 0.026 |
| W1_002 | 02:27:35.77 | 04:27:00.0 | color | optical+NIR | 0.027 |
| W1_003 | 02:05:10.00 | 04:49:30.0 | photo- | optical | 0.027 |
| W1_004 | 02:26:44.00 | 04:49:30.0 | photo- | optical+NIR | 0.027 |
| W4_001 | 22:14:03.96 | 01:40:30.0 | color | optical | 0.038 |
| W4_002 | 22:14:55.92 | 01:18:00.0 | color | optical+NIR | 0.041 |
| W4_003 | 22:15:54.00 | 01:40:30.0 | photo- | optical | 0.044 |
| W4_004 | 22:16:40.00 | 01:18:00.0 | photo- | optical+NIR | 0.046 |
3 FMOS Observation
We observed four FMOS fields for each of CFHTLS W1 (hereafter we call them W1_001–004) and W4 (W4_001–004). The four different combinations of the used photometric bands (optical only or optical+NIR) and selection methods (color or photometric redshift) are applied to the four fields in each of the two CFHTLS wide fields. The field locations and corresponding selection parameters are summarized in Table 1.
3.1 Observation and Data Reduction
The observations were carried out with Subaru/FMOS on the nights of September 22–25th, 2011. We used the normal beam-switching mode (NBS mode) of FMOS, with the total exposure time of min in one FoV for each of the object and sky frames. In the NBS mode, the object frame is taken using all 400 fibers for targets, followed by the sky frame. We chose this mode because the fiber allocation is geometrically less complicated than the cross beam switching (CBS), where 400 fibers are split into 200 targets and 200 sky regions, and sky subtraction is done by another frame exchanging target and sky fibers.444http://www.naoj.org/Observing/Instruments/FMOS/
FMOS has two different spectral resolution modes, and the FastSound project uses the high-resolution (HR) mode () since the throughput in HR mode is higher than in the low-resolultion (LR) mode by a factor of about two due to loses in the low resolution (LR) mode arising from the additional Volume-Phase Holographic grating used to decrease spectral resolution (Tamura et al. (2012)). However, in this observing run, the HR mode was not available for IRS1 due to a mechanism failure, and hence the IRS1 observation was done with the LR mode covering m–m (). For this reason, we only present the results from IRS2 in this paper, i.e., galaxies in one FoV. The exposure time was set to be three times longer than that for FastSound project, because the background of IRS2 was times higher than usual.
For IRS2, the wavelength coverage of the HR mode was set to be at the blue-end of band, m–m (corresponding to H at –), and the pixel scale was . This range was chosen to be optimal, considering the balance between the maximal scientific value of FastSound (i.e., higher redshifts) and a sufficient number of emission line galaxies detectable by FMOS, based on the results of previous preliminary observations. The obtained data were reduced with the FMOS data reduction pipeline (FIBRE-pac: Iwamuro et al. 2012).
3.2 Emission Line Detection
Emission lines were searched for by automated emission line detection software developed by the FastSound group (Tonegawa et al. 2013, in preparation), and here we briefly summarize the software algorithm. First we subtract the continuum component from each spectrum in 2D images by polynomial fits. Then the 2D images of the spectra are convolved with 2D Gaussian kernel, with standard deviations of in the wavelength direction (corresponding to a quadratic sum of the FMOS HR mode resolution and a typical velocity dispersion 175 km/s FWHM of H lines detected by FMOS at ) and for the direction perpendicular to wavelength (corresponding to the instrumental image quality). The line flux is calculated by fitting the kernel shape, and corresponding statistical noise is also calculated from the noise map produced by FIBRE-pac. A key feature is that we artificially amplify the noise level in the regions corresponding to the OH-suppression masks to effectively reduce the signal-to-noise () ratio of the OH-airglow emission regions, where the large scatter of causes false detections.
The algorithm then searches for local peaks along the wavelength direction, and selects the local peaks having values larger than a given threshold as the emission line candidates. Finally, spurious detections are removed by using information from the bad pixel and noise maps. We examined the performance of the line detection software by applying it to the inverted image produced by exchanging the object and sky frames, where all the detections must be spurious. We find that practically all emission lines are real above the threshold value of that was adopted in the sample presented in this work. (Details will be reported in Tonegawa et al. 2013, in preparation.) Examples of emission line candidates detected by the software are shown in Figure 3.
Since H is the strongest line in star-forming galaxies in the interested wavelength, the majority ( 90%) of the detected emission lines are expected to be H (Glazebrook et al. (2004), Yabe et al. (2012)). In the following we present the success rate of emission line detection, without discriminating between H and other lines. We will discuss the contamination fraction of other lines later in §4.3 using the HiZELS sample.
We measure redshifts and H fluxes by fitting a Gaussian profile. The effect of fiber losses are estimated from the relation between the covering fraction (of light falling within the diameter fiber aperture) and half-light radius of galaxies used in Yabe et al. (2012). This estimate was made for FMOS fields in which the NIR data was available (i.e., W1_002, W1_004, W4_002, W4_004), and the half-light radius was estimated from the intrinsic radius of UKIDSS DXS galaxies in -band filter and the typical seeing size of our observation ( for W1 and for W4, FWHM). The intrinsic radius was estimated by subtracting WFCAM seeing ( FWHM) from the observed size (mean of the major and minor axis sizes) in quadrature. The median of covering fraction are for W1 and for W4, respectively, and all line fluxes of detected objects are uniformly corrected by these values.
(80mm,80mm)figure3a.eps \FigureFile(80mm,80mm)figure3b.eps \FigureFile(80mm,80mm)figure3c.eps \FigureFile(80mm,80mm)figure3d.eps
4 Results and Discussion
| FoV | Method | Band | Target | Emitters | SR () | threshold | threshold [erg/cm2/s] |
| all observed objects | |||||||
| W1_001 | color | opt | – | ||||
| W1_002 | color | opt+NIR | – | ||||
| W1_003 | photo-z | opt | – | ||||
| W1_004 | photo-z | opt+NIR | – | ||||
| W4_001 | color | opt | – | ||||
| W4_002 | color | opt+NIR | – | ||||
| W4_003 | photo-z | opt | – | ||||
| W4_004 | photo-z | opt+NIR | – | ||||
| uniform threshold of (for color-selection) | |||||||
| W1_001 | color | opt | – | ||||
| W1_002 | color | opt+NIR | – | ||||
| W4_001 | color | opt | – | ||||
| W4_002 | color | opt+NIR | – | ||||
| uniform threshold of (for photoz-selection) | |||||||
| W1_003 | photo-z | opt | – | ||||
| W1_004 | photo-z | opt+NIR | – | ||||
| W4_003 | photo-z | opt | – | ||||
| W4_004 | photo-z | opt+NIR | – | ||||
4.1 Statistics of Line Detection
The statistic that we are primarily interested in is the emission line detection rate among the galaxies observed by FMOS (hereafter the ”success rate” or ”SR”), for various selection methods. This statistics is summarized in Table 2 for each of eight FMOS FoVs observed. The typical success rate is –, and a general tendency of higher detection rate by the photo- selections, relative to the color selections, can be seen. On the other hand, we can see no clear increase of the success rate, within the statistical uncertainties, due to adding NIR data. An increase of the success rate with added NIR data can be seen for the case of color selection in the W1 field, but it cannot be seen in the W4 field or in the cases of photo- selections. It was expected that NIR data would be useful because of the inclusion of redshifted 4000Å breaks in photo- calculations, but this effect may not be large for blue, star-forming galaxies having rather weak breaks.
The thresholds of (color selection) or (photo- selection) are different for different fields, to keep 400 objects in each FMOS FoV. In order to examine whether the lower success rate (such as W4_002) is a result of a fainter mag or threshold in a field, we limit the statistics by taking the tightest ones of or uniformly for all fields, which is also summerized in Table 2. The success rates are almost unchanged, showing that the lower success rates are not caused by taking fainter targets. Also, even if we limit the condition of W4_002 () to that of W1_002 (), the success rate of W4_002 remains constant (). A more strict color selection of instead of for the photo- selections increases the overall success rate from to , though the target number density drops to per FoV.
We tested whether the success rate increases when -band data are included. All of the fields of W1_004 and W4_004 (NIR, photo- selection) are covered also by the band, and about 60% of CFHTLS Wide galaxies are detected both in the and band. We then repeated the same target selection procedures given by §2.3 but with the band newly added. Note that a complete test of adding is impossible because the FMOS observation is not available for galaxies that were not selected as targets by the photo- selection, though some of them would have been selected if we used also the band. Therefore we simply examine the line detection rate in the FMOS-observed galaxies that are also selected by the criteria including . The success rate averaged over the W1 and W4 fields then changes from 15.2% to 15.6%, i.e., almost no improvement. It should be noted that these statistics are based on all the FMOS-observed targets including those undetected in or . If we examine the galaxies detected in NIR bands, the success rate becomes 16.7% (optical+ selection, detected in ) and 20.1% (optical+ selection, detected both in and ), and hence we see a modest improvement.
4.2 Spectroscopic versus photometric estimates of redshift and H flux
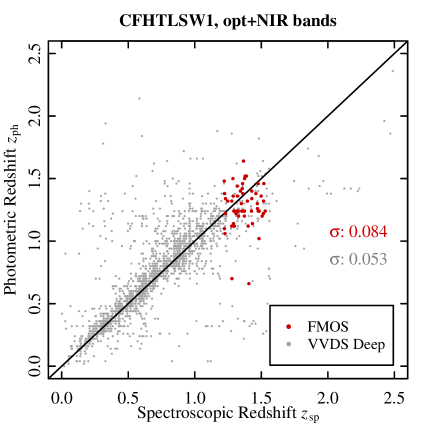
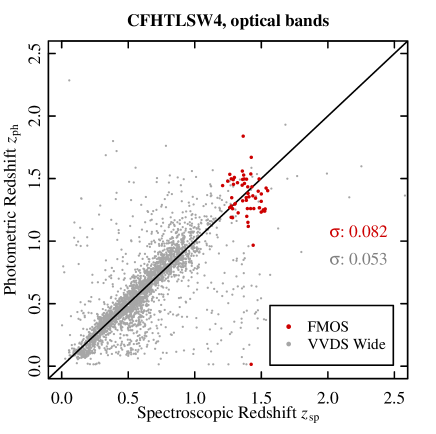
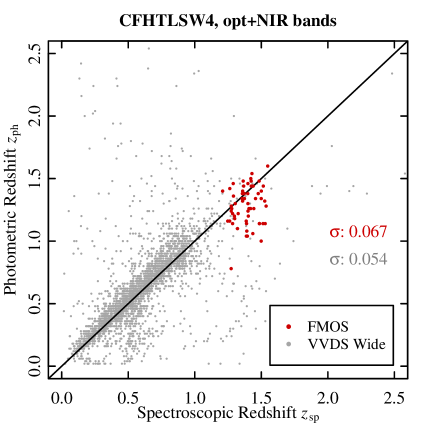
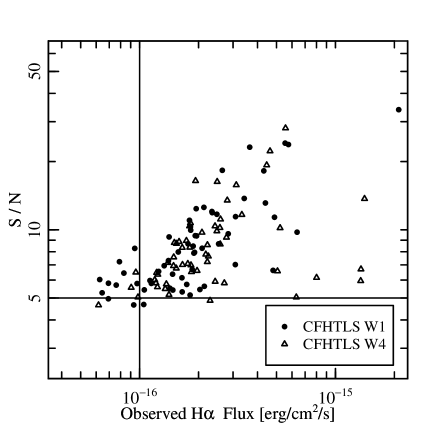
The observed spectroscopic redshifts are compared with photometric redshifts in Figure 4. For comparison, the VVDS data used for the photometric calibration of the redshift estimation are also plotted in gray dots. for galaxies observed by FMOS is larger () than that for VVDS galaxies (). Note that for FMOS galaxies is underestimated due to the selection effect (i.e., we select target galaxies within the limited range of ). It should be noted that in our samples, adding NIR data does not improve the redshift estimation nor decrease the number of outliers, as discussed above. A comparison between the line and the observed H flux is displayed in Figure 5. The H flux corresponding to is .
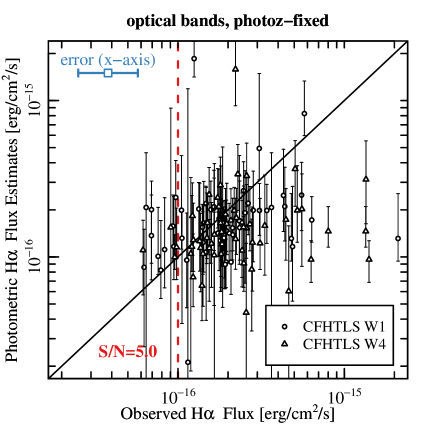
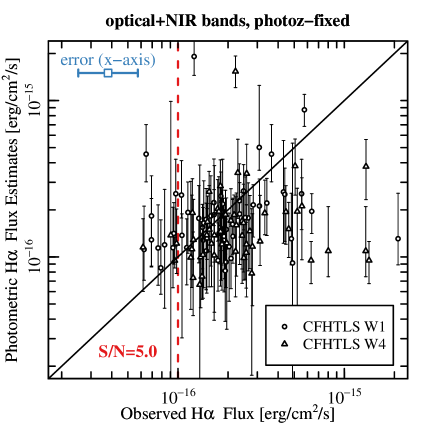
The observed H flux versus the estimated H flux from SED fittings is shown in Figure 6, which shows a large scatter between the observed and estimated H fluxes. We examined the effects of fiber loss variations for individual galaxy sizes () and by the positional error of fiber allocation (typically less than 10%, Yabe et al. 2012), and found that these are not large enough to account for the scatter. Therefore this is most likely to be caused by the uncertainties in the photometric H flux estimates. The observed fluxes tends to be larger than that of estimated fluxes, especially for those having large observed fluxes. This is likely because of the selection effect around the FMOS detection limit; most of galaxies are around the selection threshold of the estimated flux, and some of them having large observed fluxes have high probabilies of being detected.
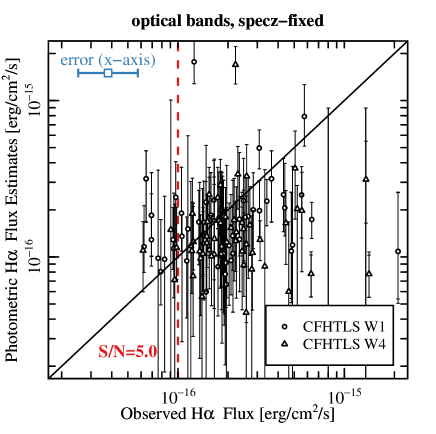
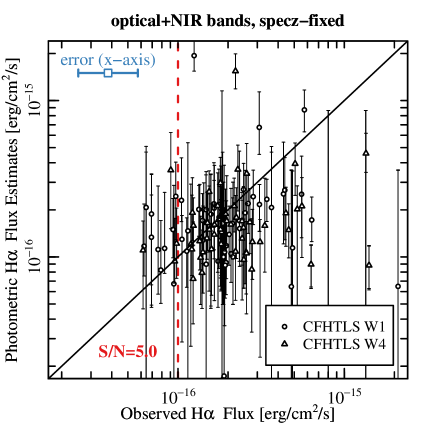
In right panels of Figure 6 we also plot the H fluxes estimated by fixing redshifts in the SED fitting at the measured spectroscopic values, rather than at the photometric redshifts. There is still a large scatter, indicating that the theoretical SED fitting has a large uncertainty, even if we use the correct redshifts. Note that we are observing in a relatively narrow redshift range with FMOS for H (–), and the selected targets have photo- values in –. Therefore photo- and spec- cannot differ by large factors, and the lack of significant improvement from using spec- should not be surprising.

4.3 Comparison with the HiZELS Data
Here we examine our selection processes, with the aim of determining which of the processes are mainly limiting the success rate of emission line detection. We use data for emission line galaxies detected by the NBH narrow-band filter of the High Redshift(Z) Emission Line Survey (HiZELS: Geach et al. (2008); Sobral et al. (2009)), corresponding to H at . Although the redshift interval corresponding to the narrow band filter is small (), the redshift is within the FastSound spectroscopic coverage, and all the H emitter brighter than the detection limit are included in the HiZELS sample. Therefore we can estimate how many H emitters are missed by considering the effects of the FastSound target selection criteria for the HiZELS galaxies. Note that this is entirely a calculation and we do not have FMOS observations of HiZELS targets.
We use the HiZELS catalogue in a region where the UKIDSS UDS, SXDS, and CFHTLS W1 data are available, since the color and photo- information from SXDS and the HiZELS NB921 narrow-band imaging data in SXDS are crucial to classify HiZELS NBH emitters into H and others (Sobral et al. (2013)). There are NBH emitters having counterparts in the SXDS and CFHTLS W1 catalogues, while there are galaxies in the same region in the CFHTLS wide catalogue. The NBH line flux limit is (), which is close to the FMOS line detection limit.
Among the objects, objects are identified to be H emitters at by the [OII]+H double-line selection using the HiZELS NB921 and HiZELS NBH data. Since the NB921 observation is deep enough to detect galaxies with small emission line ratios of [OII]/H, more than of H emitters can be selected by this criteria (Sobral et al. (2012)). Considering the FMOS redshift coverage (OH mask regions removed) that is times wider than the HiZELS NBH width and the area of FMOS FoV (), we expect H emitters per FMOS FoV, which is close to the number of FMOS fibers, indicating that we need an almost perfect target selection method in order to achieve line detection efficiency.
NBH emitting objects that were not detected in NB921 should be emission lines other than H, and these are useful to estimate the contamination rate of non-H emitters in the target selection of FastSound. Here we classify these into the following two categories. One is the non-H lines that are close to H, such as [NII] and [SII] . Although H emissions of these objects are outside the NBH filter window, the redshift is almost the same as H emitters, and hence they can be detected as H emitters by FastSound. Therefore these should not be included in the contamination rate estimate. Note that we do not have to count these as H emitters either, since this population should be effectively included in the above expected number of 375 H emitters in the FastSound redshift range. The other category is the lines whose redshifts are completely different, such as H, [OIII] , and [SIII] , which would cause a redshift mis-identification and lead to a systematic error in .
We classify the non-H objects into these two categories accodring to whether they satisfy photo- and color selection criteria for H identification of the NBH emitters adopted by the HiZELS team (Sobral et al. (2013)). Since the color/photo- criteria does not discriminate between H and the close lines, the objects without NB921 emission but satisfying color/photo- criteria are considered to be the former category. There are and objects in the two categories, respectively, and we use only the latter for the non-H contamination rate estimate for FastSound. Note that the actual contamination rate may be smaller than this estimate, because we can identify H+[OIII] double-emitters and remove them in the actural FMOS spectra.
4.3.1 Color-based Selection
| Selection | HiZELS H | HiZELS non-H | CFHTLS | Success Rate |
|---|---|---|---|---|
| without selection | 114 (375) | 54 (178) | 56,576 (17,063) | 1.7% |
| 1a (color) | 21 (69) | 7 (23) | 4,742 (1,430) | 3.8% |
| 2a (1a + mag) | 18 (59) | 2 (6.6) | 1,179 (356) | 13.1% |
| 3a (2a + mag) | 17 (55) | 1 (3.3) | 1,100 (332) | 13.3% |
| Selection | HiZELS H | HiZELS non-H | CFHTLS | Success Rate |
|---|---|---|---|---|
| without selection | 114 (375) | 54 (178) | 56,576 (17,063) | 1.7% |
| 1b () | 42 (138) | 11 (36) | 11,993 (3,560) | 3.0% |
| 2b (1b + H flux) | 22 (72) | 4 (13) | 1,943 (586) | 9.7% |
| 3b (2b + color) | 21 (69) | 4 (13) | 1,599 (482) | 11.3% |
| 4b (3b + magnitude) | 16 (53) | 4 (13) | 1,428 (431) | 9.6% |
We first examine the color selection described in §2.2 using optical data, i.e., (1a) the color conditions, (2a) the magnitude condition, and (3a) the magnitude condition. Here we adopt the magnitude threshold of , so that there are target galaxies in one FMOS field. After adopting the selection criteria, target galaxies remain in the region of the HiZELS data set, and there are HiZELS H emitters and non-H object. This means an H detection rate of if the redshift range is scaled to that of FMOS ( times larger), which is roughly consistent with the actual FMOS observation reported in §4.1. In table 3, we also show the change of galaxy numbers by adopting the each step of the target selection of (1a)–(3a). The success rate (i.e., the number of H emitters in selected galaxies) increases by a factor of two using the color condition and three using magnitude conditions, indicating that conditions of color and magnitude are comparably important.
There is only one non-H emitter in the final targets selected, indicating that the contamination of non-H in emission lines of color selection is less than , although the statistical uncertainty is large.
4.3.2 Photo-based Selection
Next we examine the optical photo--based selection, i.e., the conditions on (1b) photometric redshift, (2b) estimated H flux, (3b) color, and (4b) magnitude. For this region we set threshold to be to have an appropriate number of targets () in one FMOS field. After these conditions have been adopted, CFHTLS galaxies and HiZELS H emitters are selected, yielding a success rate of scaled into the FastSound redshift range, which is again roughly consistent with the FMOS observations. The change of the success rate by the each step of the selection (1b)–(4b) is also shown in Table 4. This result indicates that the most efficient selection process is obtained by adopting the H threshold, followed by the selection using photometric redshifts. The empirically introduced conditions of color and magnitude are not very important at least for this sample.
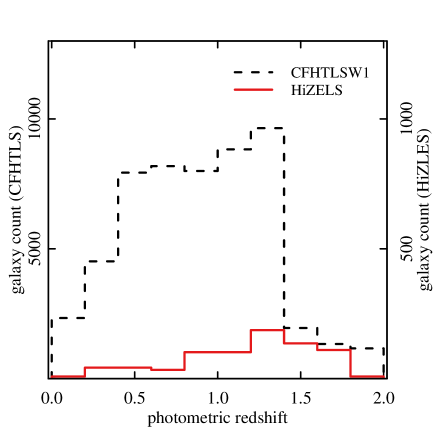
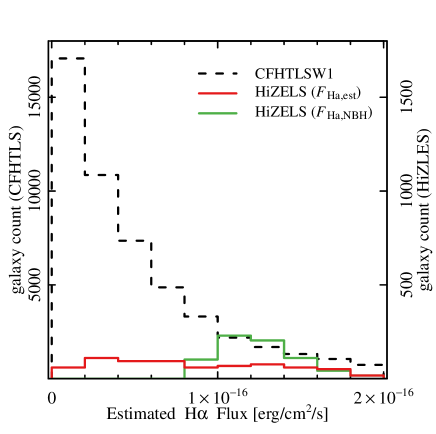
The distribution of photometric redshifts and photo- based estimates of H fluxes for HiZELS H emitters are displayed in Figure 7, in comparison with those for general CFHTLS galaxies. It is indeed seen that the fraction of HiZELS H emitters in general CFHTLS galaxies increases by choosing galaxies at and with strong estimated H fluxes. However, considerable fraction of HiZELS H emitters are rejected by the adopted selection criteria, because of the uncertainties in the estimated redshifts and H fluxes of HiZELS H emitters which are at and brighter than ), as seen in §7. The accuracy of redshift estimation against the correct value (i.e., ) is , which is times worse than those reported for CFHTLS galaxies (Ilbert et al. 2006; Coupon et al. 2009; see also §2.3). This is because the objects at are faint () in the CFHTLS wide catalogue, and because the accuracy is generally worse for blue (H emitting) galaxies than for red galaxies.
The number of non-H emitters in the final selected targets is relatively high: against H emitters, implying a contamination rate of that is considerably higher than that for the color selection in the previous section. However, by examining the colors of the four non-H objects, we found that three of them are close to the border between H and non-H of the HiZELS criteria in the color diagrams, and furthermore we can remove H+[OIII] double-emitters using FMOS spectra, hence the actual contamination may be reduced. A statistically larger sample is required to investigate this issue more quantitatively.
5 Conclusion
In this work we examined several methods to efficiently select H emitting galaxies at – from existing photometric data in a field of square-degree scales, using near-infrared spectroscopic observations from Subaru/FMOS. Although quantitatively this work considers the particular case of the FastSound project (a near-infrared galaxy redshift survey with FMOS), selecting emission line galaxies efficiently at high redshifts is important for future high-precision cosmological surveys that are now widely being discussed.
The main photometric data set that we used is the CFHTLS wide survey, where photometric data are available in four independent fields, over a total of . In order to test the gain from adding near-infrared data, we also added -band data from the UKIDSS/DXS survey. We tested two methods of target galaxy selection: one is based on color-color diagrams, and the other is based on photometric estimates of redshifts and H fluxes from SED fitting methods. Therefore we tested four types of target selections, by combination of (1) color or photo- selections and (2) using optical data only or optical plus NIR band. Eight FMOS fields were observed, corresponding to the four types of target selection in each of the two fields of CFHTLS W1 and W4.
Emission lines are searched for by an automatic detection software from the reduced spectra, and we calculated the success rates of emission line detection () in galaxies observed by FMOS. The results are: (color, opt), (color, opt+NIR), (photo-, opt), and (photo-, opt+NIR) for CFHTLS W1, and (color, opt), (color, opt+NIR), (photo-, opt), and (photo-, opt+NIR) for CFHTLS W4 (summarized in Table 2). Though the sample size is not large enough for robust statistics, we find a tendency for higher success rates by using photo- (–), relative to color selections (). Adding NIR data does not appear to significantly improve the success rate.
We also examined the target selection methods using the HiZELS NBH narrow-band galaxy survey catalogue that corresponds to H at . We classified HiZELS sources into H and non-H lines, and then applied our target selections to them, in order to clarify what is the main factor limiting the success rate, and how many non-H lines are included as a contamination in the FMOS-detected emission lines. We found that in the photo- selection, both the uncertainties of photo- and estimated H flux are contributing to the relatively low success rate.
We would like to thank David Sobral, Philip Best, Ian Smail, and HiZELS team for providing us with the data obtained by the HiZELS project. This work is based on data collected at Subaru Telescope, which is operated by the National Astronomical Observatory of Japan. This work was supported by JSPS KAKENHI Grant Numbers 20040005, 22012005, and 23684007.
References
- Anderson et al. (2012) Anderson, L., et al. 2012, MNRAS, 427, 3435
- Arnouts et al. (1999) Arnouts, S., Cristiani, S., Moscardini, L., Matarrese, S., Lucchin, F., Fontana, A. & Giallongo, E. 1999, MNRAS, 310, 540
- Beutler et al. (2011) Beutler, F., et al. 2011, MNRAS, 416, 3017
- Beutler et al. (2012) Beutler, F., et al. 2012, MNRAS, 423, 3430
- Blake et al. (2011a) Blake, C., et al. 2011, MNRAS, 415, 2876
- Blake et al. (2011b) Blake, C., et al. 2011, MNRAS, 415, 2892
- Brinchmann et al. (2004) Brinchmann, J., Charlot, S., White, S. D. M., et al. 2004, MNRAS, 351, 1151
- Calzetti (2000) Calzetti, D., Armus, L., Bohlin, R. C., Kinney, A. L., Koornneef, J. & Storchi-Bergmann, T. 2000, ApJ, 533, 682
- Cid Fernandes et al. (2005) Cid Fernandes, R., Mateus, A., Sodré, L., Stasińska, G. & Gomes, J. M. 2005, MNRAS, 358, 363
- Cole et al. (2005) Cole, S., et al. 2005, MNRAS, 362, 505
- Coleman et al. (1980) Coleman, G. D., Wu, C.-C., Weedman, D. W. 1980, ApJS, 43, 393
- Coupon et al. (2009) Coupon, J, et al. 2009, A&A, 500, 981
- de la Torre et al. (2013) de la Torre, S., et al. 2013, arXiv:1303.2622
- Eisenstein et al. (2005) Eisenstein, D. J., et al. 2005, ApJ, 633, 560
- Fioc & Rocca-Volmerange (1997) Fioc, M., & Rocca-Volmerange, B. 1997, A&A, 326, 950
- Frieman, Turner, & Huterer (2008) Frieman, J. A., Turner. M. S. & Huterer, D. 2008, ARA&A, 46, 385
- Garilli et al. (2008) Garilli, B., et al. 2008, A&A, 486, 683
- Geach et al. (2008) Geach, J. E., Smail, I., Best, P. N., Kurk, J., Casali, M., Ivison, R. J. & Coppin, K. 2008, MNRAS, 388, 1473
- Glazebrook et al. (2004) Glazebrook, K., Tober, J., Thomson, S., Bland-Hawthorn, J., & Abraham, R. 2004, AJ, 128, 2652
- Guzzo et al. (2008) Guzzo, L., et al. 2008, Nature, 451, 541
- Gwyn (2012) Gwyn, S. D. J 2012, A&A, 143, 38
- Hamilton (1998) Hamilton, A. J. S. 1998, The Evolving Universe, 231, 185
- Hawkins et al. (2003) Hawkins, E., et al. 2003, MNRAS, 346, 78
- Ilbert et al. (2006) Ilbert, O., et al. 2006, A&A, 457, 841
- Iwamuro (2012) Iwamuro, F. 2012, PASJ, 64, 59
- Kaiser (1987) Kaiser, N. 1987, MNRAS, 227, 1
- Kennicutt (1998) Kennicutt, R. C., Jr. 1998, ARA&A, 36, 189
- Kimura et al. (2010) Kimura, M. et al. 2010, PASJ, 62, 1135
- Kinney et al. (1996) Kinney, A. L., Calzetti, D., Bohlin, R. C., McQuade, K., Strochi-Bergmann, T. & Schmitt, H. R. 1996, ApJ, 467, 38
- Lawrence et al. (2007) Lawrence, A., et al. 2007, MNRAS, 379, 1599
- Le Fèvre et al. (2005) Le Fèvre, O., et al. 2005, A&A, 439, 845
- Peebles & Ratra (2003) Peebles, P. J. & Ratra, B. 2003, RvMP, 75, 559
- Reid et al. (2012) Reid, B. A., et al. 2012, MNRAS, 426, 2719
- Scalo (1986) Scalo. J. M. 1986, FCPh, 11, 1
- Sumiyoshi et al. (2009) Sumiyoshi, M. et al. 2009, arXiv:0902.2064
- Samushia et al. (2012) Samushia, L, Percival, W. J & Raccanelli, A 2013, MNRAS, 420, 2102
- Schlegel et al. (1998) Schlegel, D. J., Finkbeiner, D. P & Davis, M. 1998, ApJ, 500, 525
- Sobral et al. (2009) Sobral, D., Best, P. N., Geach, J. E., Smail, I, Kurk, J., Cirasuolo, M., Casali, M., Ivison, R. J., Coppin, K. & Dalton, G. B. 2009, MNRAS, 398, 75
- Sobral et al. (2012) Sobral, D., Best, P. N., Matsuda, Y., Smail, I., Geach, J. E. & Cirasuolo, M 2012, MNRAS, 420, 1926
- Sobral et al. (2013) Sobral, D., Smail, I., Best, P. N., Geach, J. E., Matsuda, Y., Scott, J. P., Cirasuolo, M. & Kurk, J. 2013, MNRAS, 428, 1128
- Tamura et al. (2012) Tamura, N., et al. 2012, Proceedings of SPIE, 8446
- Weinberg et al. (2012) Weinberg, D. H., Mortonson, M. J., Eisenstein, D. J., Hirata, C., Riess, A. G. & Rozo, E 2012, arXiv1201.2434
- Yabe et al. (2012) Yabe, K., et al. 2012, PASJ, 64, 60