On the nature of CP Pup
Abstract
We present new X-ray and optical spectra of the old nova CP Pup (nova Pup 1942) obtained with Chandra and the CTIO 4m telescope. The X-ray spectrum reveals a multi-temperature optically thin plasma reaching a maximum temperature of 36 keV absorbed by local complex neutral material. The time resolved optical spectroscopy confirms the presence of the 1.47 hr period, with cycle-to-cycle amplitude changes, as well as of an additional long term modulation which is suggestive either of a longer period or of non-Keplerian velocities in the emission line regions. These new observational facts add further support to CP Pup as a magnetic cataclysmic variable (mCV). We compare the mCV and the non-mCV scenarios and while we cannot conclude whether CP Pup is a long period system, all observational evidences point at an intermediate polar (IP) type CV.
keywords:
Stars: cataclysmic variables, classical novae; Stars individual: CP Pup1 Introduction
CP Pup exploded in 1942 as one of the brightest and fastest (t3=8 days, Schaefer & Collazzi 2010) of the Galactic classical novae. The luminosity of the post-nova never returned to the pre-outburst quiescent value. The nova remained in a sort of standstill and, according to Schaefer & Collazzi (2010), CP Pup might still be more than five magnitudes brighter than before the outburst. Thanks to its relatively bright “quiescent” magnitude and outburst characteristics, CP Pup has been widely studied as a rather “extreme” example of a nova, one that really helps constrain the parameters used in the classical nova (CN) models. The main findings were: 1) an unstable spectroscopic period of 1.47 hr (Bianchini et al. 1985 and 2012, Duerbeck et al. 1987, O’Donoghue et al. 1989, White et al. 1993); 2) a 2 to 11% longer (and unstable) photometric period (Warner 1985, Diaz & Steiner 1991, Patterson & Warner 1998); 3) an X-ray spectrum similar to those of magnetic CV (mCV, Orio et al. 2009), 4) a modulation of the X-ray flux at the spectroscopic period (Orio et al. 2009, Balman et al. 1995); 5) double humped NIR light curve with period roughly matching the photometric period (Szkody & Feinswog 1988). Taken together, these findings do not deliver a consistent picture of the old-nova (see details in Sect.5), and, in particular, leave unresolved the debate upon the nature of the nova (whether magnetic or non-magnetic) and its mass (too small to be consistent with either classical nova and/or stellar evolution theories).
In this paper we present new Chandra X-ray data and time resolved optical spectroscopy which we collected with the aim of addressing those inconsistencies.
2 Observations and data reduction
2.1 The Chandra observations
In the previous X-ray observation with XMM-Newton (Orio et al. 2009), the upper limit of the RGS grating (0.33–2.4 keV) left an uncertainty concerning the highest plasma temperature in the cooling flow model with which we fitted the hot plasma. This temperature indicates the depth of the gravitational potential well of the white dwarf (WD), and, therefore, a way to measure the WD mass. In order to better constrain the plasma temperature and the WD mass we observed CP Pup with Chandra ACIS-S camera coupled with the High Energy Transmission Grating Spectrometer (HETGS). The HETGS is a system of two sets of gratings, the HEG (high energy grating) and the MEG (medium energy grating). This allows high resolution spectra (with E/E up to 1000) between 0.4 keV and 10.0 keV. CP Pup was observed between September 30 and October 31 2009: the total observing time was 175,780 s, split in 7 exposures because of scheduling constraints. Table 1 reports the log of observations together with the average count rate recorded during each exposure.
| Obs.ID | Date | Start | End | Exposure | HEG | MEG |
|---|---|---|---|---|---|---|
| (s) | counts/s | counts/s | ||||
| 9967 | 2009-09-30 | 15:25 | 21:29 | 19814 | 0.0196 | 0.0356 |
| 11990 | 2009-10-02 | 05:23 | 19:20 | 47263 | 0.0207 | 0.0360 |
| 9966 | 2009-10-11 | 08:30 | 16:01 | 24729 | 0.0198 | 0.0367 |
| 12005 | 2009-10-15 | 09:53 | 19:41 | 32504 | 0.0237 | 0.0430 |
| 12012 | 2009-10-26 | 00:43 | 06:53 | 19715 | 0.0246 | 0.0482 |
| 11991 | 2009-10-28 | 14:44 | 20:52 | 19714 | 0.0252 | 0.0449 |
| 12013 | 2009-10-31 | 06:28 | 09:45 | 9187 | 0.0225 | 0.0445 |
2.2 The CTIO observations
Spectroscopic observations were taken at the CTIO’s 4m telescope equipped with the, now retired, R-C spectrograph. The instrument setup was grating KPGL1-1 at a tilt angle of 57∘ and slit width of 1.2 arcsec which, together, covered the wavelength range 3500–6000 Å at a resolution of 6 Å111This is the measured FWHM of the sky emission line. (i.e. 320 km/s). The exposures time was 60 s and the duty cycle was 1.8 min. A few times during each night the observing sequence was interrupted in order to take a wavelength calibration exposure. CP Pup was observed on Feb 6 and 7 2009 for about 5.9 and 4.7 consecutive hours, respectively. In total we collected 177 spectra during the first night and 125 during the second. The wavelength calibration exposures were used to calculate the dispersion solution of the spectra, however the wavelength “zero-point” was determined using the [O i] sky line at 5577 Å, due to the spectrograph instability. Each spectrum was corrected also for the earth motion, in addition to the instrumental flexure.
The data were reduced following the standard procedure and using the dedicated IRAF packages. All the spectra were flux calibrated using the spectrophotometric standard stars HR4468 & LTT4861 and LTT2415 for the first and the second night of observation, respectively.
3 Analysis of the Chandra data
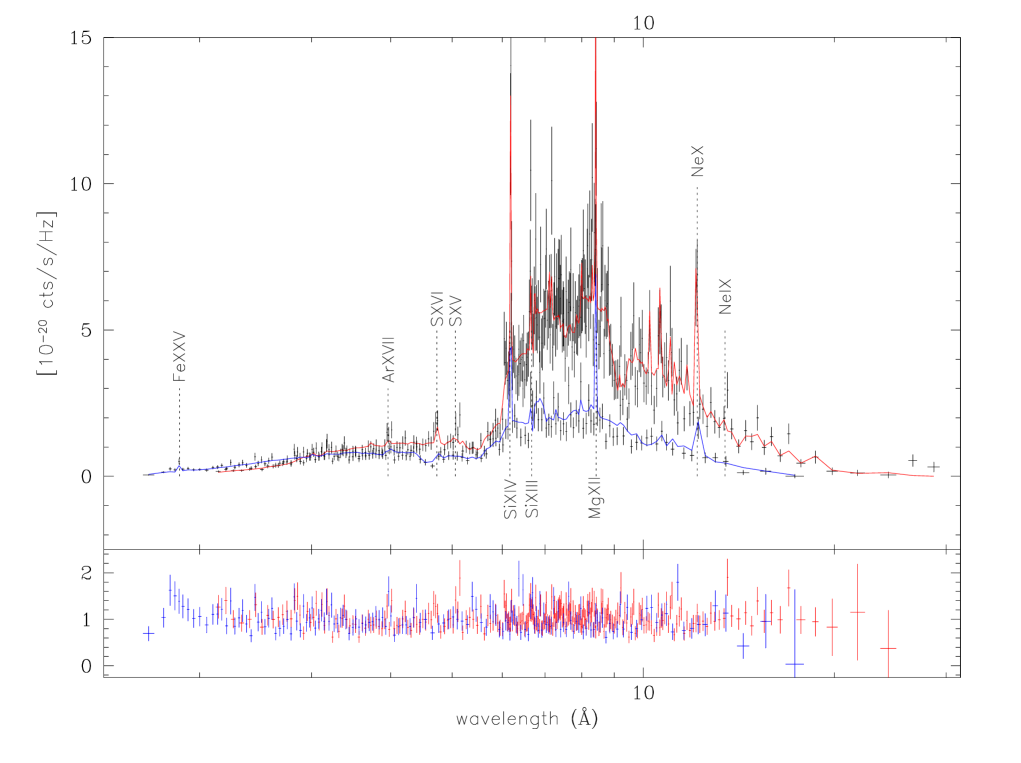
We reprocessed all the HETG data using chandrarepro in the CIAO v4.3 software package. Using the resulting pha2 files, with standard source and background regions, we extracted type I standard pha files by means of the ftool cmppha for the source and the background, and combined the orders into a single MEG file and a single HEG file, each with associated response and background (making use of the tool addascaspec). We then combined these files from the 7 pointings into a single HEG spectrum and a single MEG spectrum. We focused on the ranges 0.4–6 keV (2.07–31.00 Å) for the MEG and 0.7–8 keV (1.55-17.71 Å) for the HEG. As the summed spectra have a modest statistical quality, we produced two different versions of the spectra with different binning, using the ftool grppha. In particular, one was heavily re-binned so that each channel had at least 25 source photons; we fitted these files using statistic, which is well suited to evaluating the goodness of fit. We also used this version to produce the final plots in Fig.1. For the final fitting, done with XSPEC, v12.6, we used a binning by a factor of 2, and the C statistic (Cash, 1979), with the background-subtracted spectra.
The spectra clearly contain K shell emission lines of various species from Fe to O, as expected for X-ray emission from a multi-temperature plasma (Fig. 1). The strongest lines are those of He-like Fe at 1.86 Å, He-like Ar at 3.96 Å, H and He-like S at 4.73 Å, and 5.06 Å, respectively, H and He-like Si at 6.17 Å, and 6.67 Å, respectively, H like Mg at 8.43 Å, and H and He like Ne at 12.16 Å, and 13.47 Å, respectively. Hence, following Mukai et al. (2003), we modeled the spectra using a cooling flow model, and fixed the minimum temperature to the lowest value available in the model, kT=0.0808 keV. This is effectively zero, as cooler plasma does not contribute with significant emission in the HETG band.
In fitting the models with XSPEC, we started by using a phabs (mkcflow+ga) model, with the Gaussian component representing the fluorescent Fe line at 6.4 keV (1.86 Å). However, the fit was poor so that we applied a series of modifications to the model. We first added a partial covering absorber improving the fit significantly. Second, since the line strengths deviated from the predictions of a solar abundance cooling flow model, we used the variable abundance version of the cooling flow model (vmcflow) and allowed the abundances of O, Ne, Mg, Si, S, and Fe to vary (we tied the Ni abundances to Fe). Finally, we applied the gsmooth convolution model to the vmcflow component with its second parameter set to 1.0 (constant velocity width) to broaden the model line widths to match the observations.
Applying the best-fit model from the C statistic fit to the heavily grouped spectra, we obtained a reduced of 1.1048 for 416 degrees of freedom (and 1.0870 for 413 degrees of freedom above 0.5 keV). Many of the fit parameters (27 in total222They include the elemental abundances for 14 atoms, minimum and maximum temperature, column density of the simple and partial absorber, redshift, normalization/ṁ, etc.) are poorly constrained. In particular, we cannot derive detailed elemental abundance but rather get the abundance pattern, which is suggestive of Ne abundance about twice solar (i.e. 2.20.6). We also derive the column density for the simple absorber and the partial covering absorbers: NH=0.16(0.03) cm-2 and 3.0(0.66) cm-2, respectively; with a covering fraction of 45% for the partial covering absorber. We notice that the H column density measured by LAB and GLASS from the 21 cm transition (Kalberla et al. 2005, Kalberla et al. 2010) in the direction of CP Pup is 0.672-0.673 cm-2, i.e. significantly smaller than our total column density estimated by modeling of the Chandra spectra. This is an independent demonstration that we are witnessing local absorption in CP Pup, consistently with a complex local absorber. The model (absorbed) flux is 4.0 erg/cm2/s in the range 2–10 keV and 4.8 erg/cm2/s in the range 0.4–10 keV. This corresponds to 4.5 erg/cm2/s and 6.9 erg/cm2/s, respectively, once corrected for absorption, and to a luminosity of 1.4e33 erg/s (2-10 keV) and 2.1e33 erg/s (0.4-10 keV) for an assumed distance of 1.6 kpc (Williams 1982). For the same distance, the normalization constant in the cooling flow model indicates an accretion rate of 4.3 M⊙/yr (best fit) and a 90% confidence range 3.3-7.3 M⊙/yr. The strong lines appear broadened at the 200 km/s level. Finally, we also derive our main parameter of interest, the maximum temperature, which we use to constrain the WD mass and for which we obtain kTmax=36.5 keV, with a 90% confidence range of 20.2–55.7 keV.
The presence of the complex absorber is the hallmark of magnetic CV’s (Ramsay et al. 2008). In addition, the excess of counts below 0.5 keV could indicate a soft component arising from the heated white dwarf (WD) surface. Hence, we computed the WD mass assuming that CP Pup is indeed a magnetic CV and obtained M1=0.80 M⊙. Note that for maximum temperatures as high as 36 keV, small changes in kTmax only lead to subtle difference in the continuum in the HETG range, so we must assume that we modeled the complex absorber sufficiently accurately. However, the best handle in the HETG data for kTmax is the emission line strength. Plasmas with kT higher than 20 keV adds continuum flux but little line emission in the HETG band. Thus our constraint comes from the observed line equivalent width, and the large error range is partly due to the fact that we allowed the abundances of several elements to vary.
Finally we have analyzed the X-ray data searching for possible extended emissions originating from the nova shell similarly to, for example, GK Per (Balman 2005). We were unable to detect any X-ray extended emission and our surface brightness profile computed on the spectra perfectly matches the simulated PSF, once the constant background level has been taken into account.


4 Data analysis: the optical spectra
We measured the wavelength of the strongest emission lines in each spectrum, i.e. the Balmer lines H and H as well as the He ii 4686 and C iii(1). Given the low resolution and the signal-to-noise ratio (SNR) of the spectra we could not distinguish a broad and a narrow component of the emission lines (e.g. Bianchini et al. 2012, O’Donoghue et al. 1989) and fit each emission line with a single Gaussian profile, tracking just the dominant component. We note however, that the line profile, particularly in the case of the C iii and He ii emissions, occasionally deviates from Gaussian profile both because of intrinsic variations and poor SNR. Fig.2 (left panel) shows the average of two spectra taken at the end of the first night; while the figure’s inset, compares the profile of the H emission (solid line) with that of the sky line O i 5577 (dashed line). The right panel of Fig.2, instead, shows the variability displayed by the C iii and the He ii emission lines.
The radial velocity (RV) curve of each line is plot in Fig. 3. It shows that:
-
1.
there is an overall drift during the first night and an offset of the average radial velocity between the two nights.
-
2.
the amplitude of the 1.47 hr period may vary from cycle to cycle.
-
3.
there is a large scatter of the data points with occasionally deviating points which only in part can be explained by poor SNR and/or fitting.
Point (i) and, in particular, the trend of the first night suggest a variability on timescale longer than our observing run. A Fourier analysis combining the whole data set of two nights gives a power spectrum that peaks at the well known period at 16.25 cycles/day (1.47 hr), as well as a substantial power at low frequencies around 2.38 cycles/day (corresponding to 10.1 hr). A formal fit to the H radial velocity curve gives 9.8 hr (with the uncertainty of 1 d, including all the aliases), which has to be regarded as a lower limit to a possible periodic variation. Although there is certain evidence of long term variability, we are unable to establish whether it is periodic or not due to the time gap between the two nights and the time coverage of our observing run.
Points (ii) and (iii) suggest that the line forming region might be varying in location, geometry and/or optical depth.
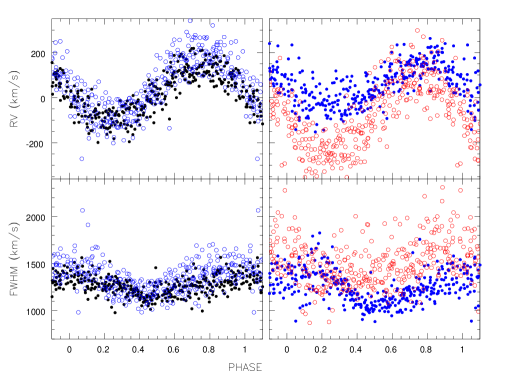
Phasing the spectra on the ephemeris: T0=2452868.582093+0.0614466 HJD, which we derived from the best fit for the H RV curve, we observe that (see Fig.4 top panels) different ions have different K-amplitudes, different average-RV and same red-to-blue crossing phase, suggesting a structured line forming region. The line dispersion velocity (FWHM) is fairly large in the range 1000-2000 km/s and modulated across the high frequency period (see Fig.4, bottom panels). The modulation varies in amplitude and shape with the ions, again consistently with a structured line emitting region and possible optical depth effects.
We remark that we did not observe modulations of the lines equivalent width (EW), nor correlation between, e.g., the He ii and the H EWs. This possibly indicates that the line strength is larger when a more collimated area is into view and/or the presence of more than one line forming region. We also note that the C iii velocities and variable profile are suggestive of a significant contribution from the N iii4640 line of 25%. The lack of significant modulation of its FWHM might indicate that the N iii fractional contribution is phase dependent.
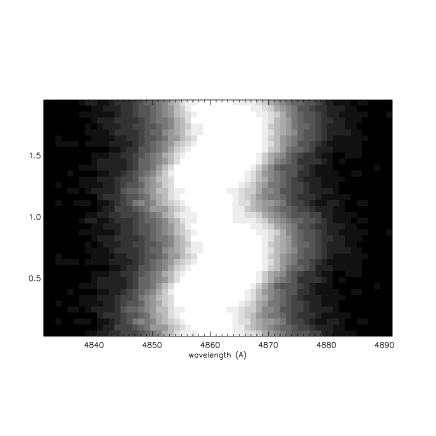
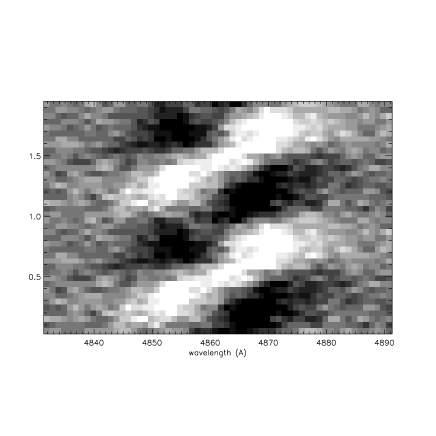
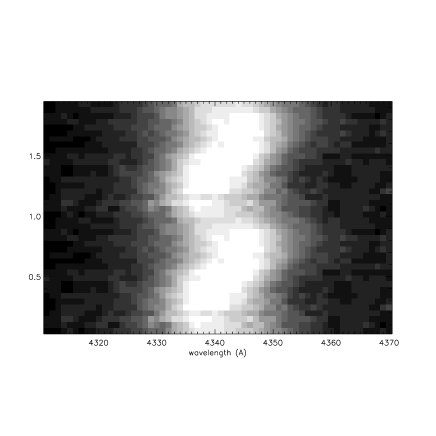
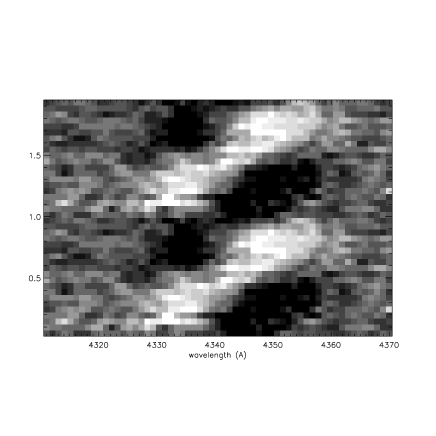
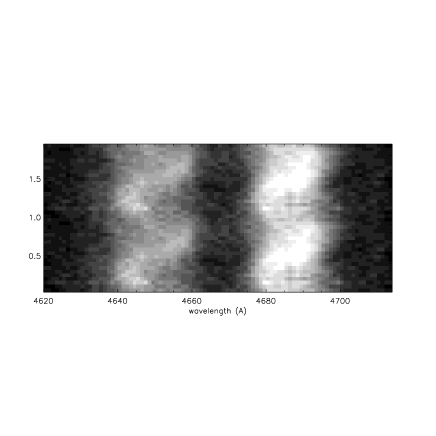
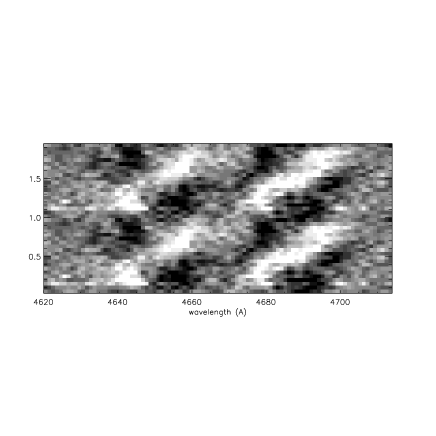
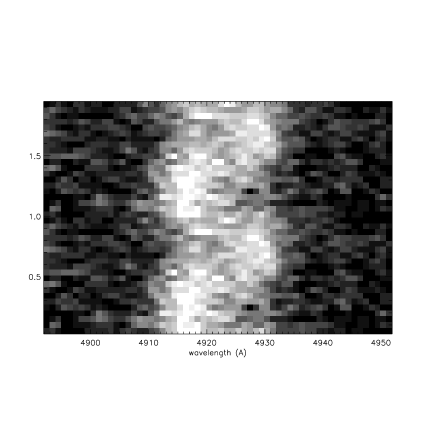
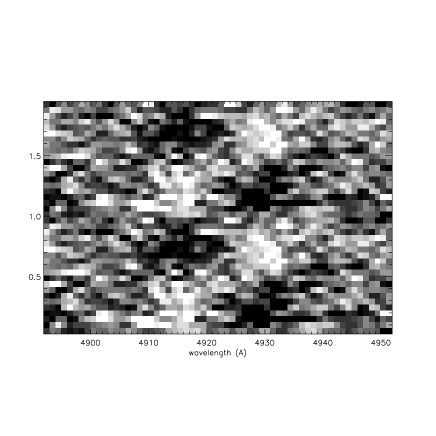
Finally we plot in Fig. 5 the trailed spectra of the various emission lines folded on the 1.47 hr period. In addition to the “standard” trailed spectra we produced “difference trailed spectra” by subtracting CP Pup average spectrum to each spectral bin. Difference trailed spectra enhance the line asymmetries and their motion. The trailed spectra reveal a “helix” pattern of the emission lines across the 1.47 hr period which became suggestive, again, of a structured or a multicomponent line forming region particularly in the case of the He ii line.
5 Discussion
In Section 1 we mentioned that the observations collected at all wavelength (X to NIR) for the quiescent CP Pup provide inconsistent results. On one side the X-ray observations always favored a magnetic nature of the nova: the X-ray flux is modulated at the high frequency period (Balman et al. 1995, Orio et al. 2009) suggesting that it corresponds to the WD spin period. In addition, the observed X-ray spectrum is best modeled by high temperature optically thin plasma that is commonly found in magnetic systems. On the other hand, polarimetry observations (Cropper 1986) did not reveal polarized light in CP Pup disfavoring the polar interpretation, though not the IP scenario. However, Cropper’s (1986) observations cannot be conclusive due to their short time coverage (18 min). Time resolved optical observations (Bianchini et al. 1985, 2012, Warner 1985, Duerbeck et al. 1987, O’Donoghue et al. 1989, Barrera & Vogt 1989, Diaz & Steiner 1991, White et al. 1993, Patterson & Warner 1998) detected unstable periods 2 hr. In particular, spectroscopic periods in the range 0.06115-0.06148 days, were interpreted as the binary orbital period, while photometric periods in the range 0.06138-0.0614 days were interpreted as super-humps, as commonly observed in short-orbital period systems accreting at high rates (Patterson & Warner 1998). In view of these periods CP Pup was recognized as the first CN below the period gap. However, the WD mass value determined from optical RV curves is uncomfortably low, in the range 0.02M0.6 M⊙ depending on the author and the adopted orbital inclination (White et al. 1993, O’Donoghue et al. 1989, Duerbeck et al. 1987, Barrera & Vogt 1989, Bianchini et al. 2012). Only Bianchini et al. (2012) were able to force an analytical solution with M1 M⊙ by including a peculiar hot spot contribution to the line flux. However, no past, nor present observations are consistent with the configuration of accretion disk + hot spot. WD masses 0.6 M⊙ are hardly compatible with the classical nova (CN) theory and, in particular, with the fast super-Eddington outbursts of the type displayed by CP Pup. These outbursts require more massive WDs, typically0.8-1.0 M⊙ (e.g. Starrfield et al. 2012a, 2012b, and reference therein). Finally the NIR J-band light curve shows a double humped modulation at about the photometric/spectroscopic period, which, if interpreted as ellipsoidal variations, implies a secondary star that is not compatible with a short orbital period system below the period gap and at the distance333Calculated from the nebular parallax (Williams 1982). of 1.6 kpc of the nova. CP Pup NIR magnitudes are also incompatible with the binary evolutionary phase at the measured distance, being far too bright.
Our new Chandra and CTIO observations support the magnetic nature of CP Pup. The Chandra data show evidence of a multi-temperature plasma which is absorbed by dense material partially covering the X-ray source and temperatures up to kT=36.5 keV. High plasma temperatures and complex local absorbing medium are characteristic of mCVs (Ramsay et al. 2008). Non-mCVs do not suffer strong local absorptions except for high orbital inclination systems (e.g. the eclipsing system V893 Sco, Mukai et al. 2009). Note that only the Chandra HETG has the sensitivity, band-pass and spectral resolution that allow to assess the presence of a complex absorber. Note also that the WD mass can be derived from the maximum plasma temperature, kT keV, either regarding it as shock temperature onto a magnetized WD (i.e. free-fall), or as a temperature produced by accretion from a disk onto a non-magnetized WD (i.e. Keplerian velocities). In the latter case the kTmax temperature would be reached by a more massive WD: M M⊙ (as opposite to the M M⊙ in the magnetic WD hypothesis). Both values, together with their uncertainties fall within the typical CV primary masses (Zorotovic et al. 2011) and point to a higher WD mass than previously estimated which is more consistent with the CN theory.
Our sequence of optical spectra imposes some strong constraint on the location and geometry of the line forming region suggesting a composite line forming region with a temperature gradient off the orbital plane. In addition, the observed -drift implies either that the RV are affected by non orbital mechanisms, or the existence of a longer period (yet to be confirmed). Note that the -drift is not just a one night occurrence as it appear also in the re-examination of the older data sets (Bianchini et al. 1985, 2012). It is intriguing to notice, however, that we mostly detect positive drifts. Whether this is due to our specific sampling or is intrinsic to the line emitting source cannot be concluded at this stage, nor we can say whether the phenomenon is strictly periodical. Anyway, the lines must form in the binary accretion component. They cannot, for example, form on the irradiated face of the secondary star for their FWHM are too large to be consistent with such a hypothesis and the emitting secondary cannot explain the -drift. In addition, the broad and narrow components identified by O’Donogue et al. (1989) and Bianchini et al. (2012) and which we do not resolve, appear to be in phase arguing, too, against secondary star irradiation. The accretion component can either be an accretion disk in a non-mCV or the magnetically funneled gas in an mCV. Below we discuss the two scenarios separately in the attempt to identify which one apply to CP Pup.
non-mCV
The classic disk + hot-spot configuration explains the different velocities from the different lines, but not their matching phases, nor the -drift. The hot-spot typically shows temperature gradients along the stream trajectory on the orbital plane imposing significant phase offsets among different lines (e.g. Mason et al. 2000 and reference therein), contrarily to CP Pup observations. It is possible to observe different velocities for a same line at different epochs. This is explained with long term variation of the geometry and/or velocity field of the line forming region, possibly associated to changes in the mass transfer rate. However, “real time variations” as those observed in CP Pup, if due to sudden mass transfer rate changes, should be associated to significant line intensity and profile variations as observed during flares or episodes of intermittent mass transfer (e.g. Mason et al. 2007, Rodriguez-Gil et al. 2012). We observe only small scale variations which are consistent with the period modulation and the night conditions. An eccentric and precessing accretion disk could explain the -drift and, in fact, produce a sinusoidal modulation of the velocity. The precessing disk would be consistent with Patterson & Warner (1998) super-hump proposal to explain the light curve modulations, though their instabilities (the “anomalous super-hump”, as defined by Patterson & Warner 1998), remain quite unexplained. We note that this model is no longer valid should future observations prove that the modulation follow a “sawtooth” pattern instead of a sinusoidal one. The exact location of the line forming region on the disk + hot-spot, however, remain unclear as there is no obvious configuration for having smaller K-amplitude in case of higher ionization potential ions. The observed FWHM are quite large for a low orbital inclination system and are hard to explain as are their modulation. Our trailed spectra do not match the pattern displayed by disk + hot-spot or hot-spot emission.
mCV
First of all, the presence of strong He ii emission lines is a strong indicator of the magnetic nature of the CV (van Paradijs & Verbunt 1984). Second, in a mCV the bulk of the line emitting region is located in the magnetically confined accretion flow toward the WD magnetic poles (Schwope et al. 2000). This configuration naturally imposes an off-orbital-plane/vertical structure characterized by temperature and velocity gradients and non-Keplerian velocities. The various emission lines are displaced along the curtain and therefore their RV curves have matching phases but different velocities. The higher ionization potential energy transitions form closer to the magnetic pole and the K-amplitude distribution results from a projection effect. Similarly the line FWHMs and their modulation are imposed by the velocity field along the magnetic field lines and its projection on the line of sight and consistent with those expected in IP (Warner 1995 and reference therein, Ferrario et al. 1993). The helix pattern shown by the trailed spectra suggest multiple components of the type observed in mCV and IP in particular (see e.g. Hellier 1999). Finally, the velocity drift suggests two different possible scenarios:
1) the modulation is sinusoidal and induced by the orbital motion of the WD around the binary center of mass. I.e. the 1.47 hr period is the WD spin and the true orbital period is several hours long (similarly to RXJ154814.5-452845, see, e.g. de Martino et al. 2006) and has yet to be determined; while the photometric period is a beat.
2) the modulation is asymmetric and sawtooth-like and the line emitting region is affected by cyclical disturbances.
We note at this point that neither the WD spin, nor the binary orbital period are expected to be unstable. However, they can appear as such if their probe is unstable.
The accretion curtain (or threading region) is fixed in the binary frame if the system is synchronous; it is not otherwise. The curtain will have constant geometry and emissivity if it is fed by a symmetric accretion disk/ring, but will vary in case of asymmetries within the disk (either because the disk is missing or because the accretion stream is deeply penetrating into it). Hence the observer will view a line emitting region which is modulated with the WD spin and its beat.
We note to this regard that different accretion geometries are possible in IPs, depending on the magnetic field strength and the ratio between the spin and the orbital period (Warner 1995 and reference therein, Norton et al. 2004).
We also note that the magnetic system BY Cam shares a number of similarities with CP Pup. It has a record of multiple and non repeatable periods with no optical nor polarimetry observations matching either the spin or the orbital period and depending on the sampling (e.g. Silber et al. 1997 and reference therein, Mouchet et al. 1997). Both light and RV curves show a phase shift and an abrupt reset to 0 which has been explained with the change in the magnetic geometry seen by the accretion stream as the WD rotates relative to the secondary and the switching of accreting magnetic pole444Mouchet et al. (1997) invoke a precessing WD, but in facts this is unnecessary. At the same time a similar effect could be obtained without invoking the change of accreting pole but the reconnection of the magnetic field line from the opposite side once the WD magnetic pole has swept over 180o with respect to the L1 point.. It is not difficult to imagine that similar configuration could cause a drift in velocity beside the phase.
Independently on the value of the orbital period, the double humped NIR modulation might be explained with irradiation (of the secondary star or the accretion component, e.g. Penning 1985) by two accreting magnetic poles. Note that CP Pup is a low orbital inclination binary, hence, we might very well miss the direct view of the lower magnetic pole (or see its periodic eclipse while the upper pole is always visible), but still see its effects on the secondary (/accretion component). Strictly speaking the double humped modulation in this case should result in uneven maxima, however this is hard to say from Szkody & Feinswog (1988) plot due to the paucity of data points and the lack of error bars. Most important those data cannot be conclusive on irradiation (nor on ellipsoidal variations), for their low amplitude modulation might be not significant and their phasing with respect to optical photometry is unknown. Note also that lack of detection of secondary star features does not argue against CP Pup as a possible long orbital period system. On one hand, the system spectroscopic observations have always been limited to the He ii – H wavelength range, which is devoid of secondary star absorptions, and to low spectral resolutions, which smear out any possible weak absorption feature. Our CTIO spectra do not have the sufficient spectral resolution and SNR, too. On the other hand, the chance for detecting the secondary depends also on the temperature and size of the various emission sources into play and it might well be that the whole accretion component completely outshine a relatively cold secondary star.
In summary, while we cannot be conclusive on the strictly-periodic vs semi-periodic nature of the observed -drift and its modulation, comparing the existing observational characteristics of CP Pup within the mCV and non-mCV scenarios, the nova IP nature best fit them all by far. This is shown in Table 2 where we list CP Pup observational facts and how each scenario succeed or fail in explaining those consistently.
For completeness we should also consider that the possible existence of a longer period could imply that CP Pup is in fact a triple system, i.e. a CV below the period gap “orbiting around” a third body. In this case the hypothesis of an eccentric orbit around the third body would be needed if the asymmetry of the long term RV modulation with slow/long-lasting velocity increase and short/rapid velocity decreases, is confirmed. This scenario however is somewhat cumbersome and ad hoc and would open questions about its probability and stability. It would probably requires formation within a globular cluster with subsequent ejection, an evolutionary scenario which, beside being very unlikely, needs detailed simulation (see, e.g. Anosova 1996, Brasser 2002) that are not possible with the current set of information in hand. Hence we do not pursue this scenario any longer and note that 1) the only CV that has been suggested to be part of a triple system is FS Aur with a period around the third body of few hundreds of days (Chavez et al. 2012); 2) placing a non-mCV in a triple system we will face the same contradictions and problem we are discussing for the isolated non-mCV.
| observation | non-mCV | mCV/IP | mCV/IP |
| short period | long orbital period | short orbital period | |
| strong He ii4686 | [N]: quiescent (low ) non-mCV typically do not show He ii emission | [Y]: strong He ii emission line is a characteristic of mCVs | [Y]: strong He ii emission line is a characteristic of mCVs |
| long term trend | [Y]: the drift in is induced by a precessing eccentric disk. | [Y]: the observed changes in the velocity corresponds to the true (still undetermined) orbital period of CP Pup; the 1.4 hr period is the WD spin. | [Y]: the drift is induced by the varying geometry of the magnetic field lines as seen by the accretion stream due to the WD rotation. |
| NIR light curve | [N]: ellipsoidal variations due to the elongated secondary star. Ellipsoidal variations are inconsistent with both the distance and the evolutionary phase of the binary. | [Y]: the spinning WD magnetic poles outshine twice per WD rotation the secondary star (/accretion component) which reflects and reprocesses the X-ray similarly to DQ Her. | [Y]: as for the long orbital period mCV scenario. |
| Difference between spectroscopic and photometric period (by a few %) | [Y]: the photometric period is the super-hump period, while the spectroscopic period is the orbital one. | [Y]: beat between spin and orbital period. | [Y]: phase jitter and unstable periods as observed in BY Cam. |
| dynamical WD mass | [N]: the primary masses derived from dynamical solutions assuming that the optical emission lines trace the binary orbital period are always too low to be consistent with stellar evolutionary theory and/or the CN outburst theory. | [Y]: reasonable masses could be found with the longer orbital period. | [Y]: the emission line region simply does not trace the orbital motion of the binary and cannot be used for the computation of dynamical masses. |
| X-ray spectrum | [N]: the observed spectral energy distribution and high temperature match typical values of mCVs. | [Y]: the spectral characteristic are those of an mCV | [Y]: as for the long orbital period mCV scenario. |
| presence of complex absorber in the high energy X-ray | [N]: this is not typical of non-mCV and, in particular, low orbital inclination non-mCVs | [Y]: this is an hallmark of mCVs | [Y]: this is an hallmark of mCVs |
| X-ray light curve | [N]: in non-mCV disk systems the X-ray emission is from the boundary layer which is supposedly symmetric producing no modulations. | [Y]: the X-ray modulation is consistent with mCVs. The modulation result from the occultation of one magnetic pole. | [Y]: as for the long orbital period scenario. |
| modulation of the high frequency period (both photometric and spectroscopic) | []: anomalous super-humps | [Y]: phase jitter and period instability induced by asynchronism between the WD spin and the orbital period, similarly to BY Cam. | [Y]: as for the long orbital period scenario. |
| modulated amplitude (spectroscopic and photometric) | []: anomalous super-humps | [Y]: variable magnetic field geometry as viewed from the secondary star and the accretion disk, due to the WD rotation and chaotic accretion. | [Y]: as for the long orbital period scenario. |
| undetected circular polarization | [Y]: non-mCV do not show polarized light | [Y]: IP polarization is typically masked by the disk/accretion component emission† | [Y]: as for the long orbital period scenario. |
| undetected secondary star features | [Y]: the secondary is a cool late type main sequence star as expected for short orbital period systems. Note that this is “self-contradictory” with the explanation provided for the non-mCV scenario on the NIR light curve point. | []: the secondary star should be relatively large and possibly competing in size (but not in temperature) with the accretion component. It should be searched for at NIR wavelengths. | [Y]: as for the non-mCV scenario. |
† Note that the non-detection of polarized light favor the IP scenario more than the asynchronous polar one.
‡ Note that a long orbital period does not automatically implies that the secondary is visible in the R, I or NIR bands: high mass transfer rate and large/luminous accretion disk can mask the secondary star absorptions.
6 Summary and conclusions
In this paper we presented and analyzed Chandra/HETG X-ray spectra and high cadence, time resolved optical spectra obtained with the Blanco telescope at CTIO. The two data sets together produce interesting results, demonstrating that CP Pup is very likely to be an IP system. The X-ray spectral characteristics are consistent with those of known IP’s. Assuming that CP Pup hosts a magnetic WD we fitted the X-ray spectrum with a cooling-flow model and a complex absorber, and from the best fit we derived a mass of 0.8 M⊙ for the WD, which is in reasonable agreement with the typical WD masses in CV and with the prediction from the CN outburst theory. The IP hypothesis thus solves the problem of the non-realistic low mass derived assuming that accretion occurs only through a disk.
Although in Orio et al. (2009) some of us derived an upper limit of 1.6 10-10 M⊙ year-1 for the mass accretion rate onto the CP Pup WD, the Chandra HETG spectrum indicates an upper limit of 3.3 10-10 M⊙ year-1 within a 90% confidence level, which may be too high to develop a very luminous TNR (Yaron et al. 2005) and leaves open the possibility of a variable before and after the outburst.
Like the X-ray data, also the sequence of optical spectra, the emission line characteristics and their radial velocities are much better explained with the IP scenario rather than with a non-mCV. We also observed a drift of the system velocity, which is either suggestive the presence of a cyclical non Keplerian mechanism or of a longer period. We speculate that this “hidden” period may be the true orbital one, rather than the spectroscopic period that may be associated with the WD rotation. While with the current set of data in hand we cannot be conclusive about the origin of the observed velocity drift, we conclude that we found very strong evidence that CP Pup is an IP.
New optical observations are needed in order to solve the pending issues. High-cadence time resolved spectroscopy for several consecutive nights would allow to determine the period and the morphology of the velocity modulation. The number of nights we requested at the Blanco was 3, but we lost one due to weather, and it turns out that a run consisting of more nights (4) is necessary. A simultaneous runs of broad band, multicolor photometry done with another telescope should allow to assess correlations between light and RV curves, to observe whether the continuum and the line emission originate in the same region, and determine how many different sources of optical exist. High resolution spectra are desirable to properly identify and trace the various emitting components. A long monitoring photometric program should be undertaken to best identify the beat periods into play. While we are aware that for this ideal dataset many nights of observations with telescopes of different sizes and characteristics would be necessary, we do think that CP Pup is such an emblematic object for the nova theory that obtaining these results would be very rewarding for a full understanding of novae.
Acknowledgments
AB thanks the Space Telescope Science Institute (STScI) for the kind hospitality in June 2012, when this work started. EM is grateful to Steven Shore for the always stimulating conversations. The authors are thankful to the anonymous referee for having raised important points.
References
- (1) Anosova, J., 1996, Ap&SS, 238, 223
- (2) Balman, S., Orio, M., & Oegelman, H., 1995, ApJ, 449, L47
- (3) Barrera, L.H., & Vogt, N., 1989, RMxA.19, 99
- (4) Bianchini, A., Friedjung, M., & Sabbadin, F., 1985, Inf. Bull. Variable Stars, 2650
- (5) Bianchini, A.; Saygac, T.; Orio, M.; Della Valle, M.; Williams, R., 2012, A&A, 539, 94
- (6) Brasser, R., 2002, MNRAS, 332, 723
- (7) Cash., W.; 1979, ApJ, 228, 939
- (8) Chavez, C.E., Tovmassian, G., Aguilar, L. A., Zharikov, S., Henden, A.A., 2012, A&A, 538, 122
- (9) Cropper, M., 1986, MNRAS, 222, 225
- (10) de Martino, D., Bonnet-Bidaud, J.M., Mouchet, M., Gaensicke, B.T., Halberl, F., Motch, C., 2006, A&A, 449, 1151
- (11) Diaz, M. P., & Steiner, J. E., 1991, PASP, 103, 964
- (12) Duerbeck, H. W., Seitter, W. C., & Duemmler, R., 1987, MNRAS, 229, 653
- (13) Ferrario, L., Wickramasinghe, D. T., & King, A. R., 1993, MNRAS, 260, 149
- (14) Hellier, C., 1999, ApJ, 519, 324
- (15) Kalberla, P.M.W., Burton, W.B., Hartmann, Dap, Arnal, E.M., Bajaja, E., Morras, R., Pöppel, W.G.L., 2005, A&A, 440, 775
- (16) Kalberla, P.M.W., McClure-Griffiths, N.M., Pisano, D. J. Calabretta, M. R., Ford, H. Alyson, Lockman, Felix J., Staveley-Smith, L., Kerp, J., Winkel, B., Murphy, T., Newton-McGee, K., 2010, A&A, 512, A14
- (17) Mason, E., Skidmore, W., Howell, S.B., Ciardi, D.R., Littlefair, S., Dhillon, V.S., 2000, MNRAS, 318, 440
- (18) Mason, E., Wickramasinghe, D., Howell, S.B., Szkody, P., 2007, A&A, 467, 277
- (19) Mouchet, M., Bonnet-Bidaud, J.M., Somov, N.N., Somova, T.A., 1997, A&A, 324, 109
- (20) Mukai, K.; Kinkhabwala, A.; Peterson, J. R.; Kahn, S. M.; Paerels, F., 2003, ApJ, 586L, 77
- (21) Mukai, K.; Zietsman, E.; Still, M., 2009, ApJ, 707, 652
- (22) Norton, A.J., Haswell, C.A., Wynn, G.A., 2004, ApJ, 614, 349
- (23) O’Donoghue, D., Warner, B., Wargau, W., Grauer, A.D.,1989, MNRAS, 240, 41
- (24) Orio, M., Mukai, K., Bianchini, A., de Martino, D., Howell, S.B., 2009, ApJ, 690, 1753
- (25) Penning, W. R., 1985, ApJ, 289, 300
- (26) Patterson, J., & Warner, B., 1998, PASP, 110, 1026
- (27) Paradijs, D., & Kovetz, A., 1995, ApJ, 445, 789
- (28) Ramsay, G.; Wheatley, P.J.; Norton, A.J.; Hakala, P.; Baskill, D., 2008, MNRAS, 387, 1157
- (29) Rodríguez-Gil, P., Schmidtobreick, L., Long, K.S., Gaensicke, B.T., Torres, M.A.P., Rubio-Díez, M.M., Santander-García, M., 2012, MNRAS, 422, 2332
- (30) Schaefer, B. E., & Collazzi, A. C., 2010, AJ, 139, 1831
- (31) Schwope, A.D., Catalan, M.S., Beuermann, K., Matzner, A., Smith, R.C., Steeghs, D., 2000, MNRAS, 313, 533
- (32) Silber, A.D., Szkody, P., Hoard, D.W., Hammergren, M., Morgan, J., Fierce, E., Olsen, K., Mason, P.A., Rolleston, R., Routsalainen, R., Pavlenko, E., Shakhovskoy, N.M., Shugarov, S., Andronov, I.L., Kolesnikov, S.V., Naylor, T., Schmidt, E., 1997, MNRAS, 290, 25
- (33) Szkody, P., & Feinswog, L., 1988, ApJ, 334, 422
- (34) Starrfield, S., Iliadis, C., Timmes, F.X., Hix, W.R., Arnett, W.D., Meakin, C., Sparks, W.M., 2012a, BASI, 40, 419
- (35) Starrfield, S., Timmes, F.X., Hix, W.R., Iliadis, C., Arnett, W.D., Meakin, C., Sparks, W.M., 2012b, IAUS, 281, 166
- (36) van Paradijs, J., Verbunt, F., 1984, AIPC, 115, 49
- (37) Warner, B., 1985, MNRAS, 217, 1P
- (38) Warner, B., 1995, Cataclysmic Variable Stars (Cambridge: Cambridge Univ. Press)
- (39) White, J. C., Honeycutt, R.K., & Horne, K., 1993, ApJ, 412, 278
- (40) Williams, R. E., 1982, ApJ, 261, 170
- (41) Yaron, O., Prialnik, D., Shara, M.M., Kovetz, A., 2005, ApJ, 623, 398
- (42) Zorotovic, M.; Schreiber, M. R.; Gänsicke, B. T., 2011, A&A, 536, 42