Single top quark production in the -channel at 14 TeV and 33 TeV
Abstract
We study -channel single top quark production at future LHC runs at 14 TeV with 300 fb-1 and 3000 fb-1 as well as at a future 33 TeV proton-proton collider in the context of the Snowmass 2013 study. The single top final state has a lepton and neutrino from the top quark decay plus two jets, one of which is required to be -tagged. We show that it is possible to isolate large samples of single top events and that the cross-section can be measured with a precision of 5% or better.
pacs:
14.65.Ha, 12.15.-yI Introduction
The Large Hadron Collider (LHC) is the highest-energy particle accelerator ever built, probing physics at the TeV scale. The Higgs boson discovery Aad et al. (2012); Chatrchyan et al. (2012) was the first, but more discoveries are likely at the LHC which covers the energy range where new physics is anticipated.
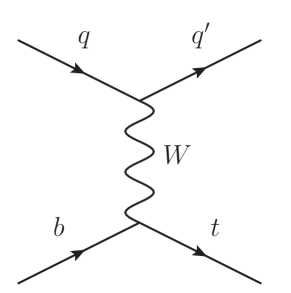
Single top quarks are produced in the Standard Model (SM) through three different mechanisms: the -channel exchange of a boson, the corresponding Feynman diagram is shown in Fig. 1, the associated production of an on-shell boson and a top-quark, and the -channel production and decay of a virtual boson.
The single top quark discovery has been reported by the Tevatron experiments Tevatron Electroweak Working Group (2009); Aaltonen et al. (2009); Abazov et al. (2009), based on a combination of -channel and -channel processes in 2009. The -channel process has been observed at the Tevatron CDF Collaboration (2012); D0 Collaboration (2011) and at the 7 TeV LHC by ATLAS ATLAS Collaboration (2012) and CMS CMS Collaboration (2012, 2013a). The current precision of the -channel cross-section measurements at 8 TeV performed by ATLAS ATLAS Collaboration (2013) and CMS CMS Collaboration (2013b) is about 15. Work is in progress to update these results with the full 2012 8 TeV dataset.
In this paper we explore the precision with which it will be possible to measure the single top quark production cross-section in the -channel for three different scenarios: 300 fb-1 of 14 TeV data with an average pileup of 50 events, also known as the Phase-1 running of the LHC upgrade; 3000 fb-1 of 14 TeV data with an average pileup of 140 events, also known as Phase-2 running or the high-luminosity LHC (HL-LHC); and 3000 fb-1 of 33 TeV data with an average pileup of 140 events, also known as the high-energy LHC (HE-LHC). For each scenario we use the appropriate Snowmass detector model. The analysis is performed using a simple cut-based approach to extract the -channel signal. It is tuned to get at least a signal to background ratio of five in order to obtain a clean sample of -channel single-top events.
II Signal and Background modeling
The signal -channel events are generated with Madgraph5 Alwall et al. (2011); MadAnalysis 5 - A package for event file analysis (2013), with Pythia8 Sjöstrand et al. (2001); Pythia/pgs package for MadGraph (2011) for parton showering and Delphes De Favereau J., Delaere C., Demin P., Giammanco A., Lemaître V., Mertens A., Selvaggi M. (2013) for modeling of the Snowmass LHC detector Snowmass Energy Frontier twiki page (2013). We consider inclusive -channel events and and no attempt is made to separate top from antitop.
Background samples for W//Z+Jets, diboson, , and single top are used from the official Snowmass webpage Snowmass Energy Frontier twiki page (2013). These samples are generated in bins of , each with its own cross-section. Normalizations are made according to the cross-sections provided by the Snowmass site for the background samples and according to the leading order cross-sections provided by MadGraph for the signal samples. The total cross-section for the signal and backgrounds at 14 TeV and 33 TeV are listed in Table 1 and 2, respectively.
| Sample | Cross-Section [pb] |
|---|---|
| t-channel | 30.2 |
| +jets | 238400 |
| 578.5 | |
| Diboson | 289.8 |
| 72.1 |
| Sample | Cross-Section [pb] |
|---|---|
| t-channel | 493.5 |
| +jets | 674860.6 |
| 4014.8 | |
| Diboson | 894.0 |
| 492.6 |
III Analysis
For this analysis a cut-and-count method is used. To account for differences in generation, select the relevant event signature, and to provide object definitions the following basic event selection is applied, on which subsequent steps are based:
| One lepton (electron or muon) with | ||||
| Two jets with | ||||
| One b-jet with | ||||
| Missing energy |
where and correspond to the transverse momentum and pseudorapidity of the lepton, respectively, and and are the transverse momentum and pseudorapidity of each jet. For 33 TeV 50 GeV and 75 GeV are used.
The first line in tables 3, 4 and 5 give the expected event yields for the signal and backgrounds with basic event selection for the different scenarios. At this stage the ratio of the signal contribution over the total background is about 0.13, with being the dominant background contribution.
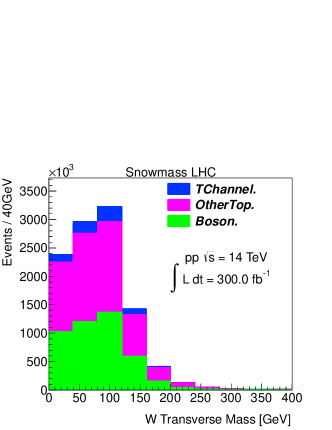
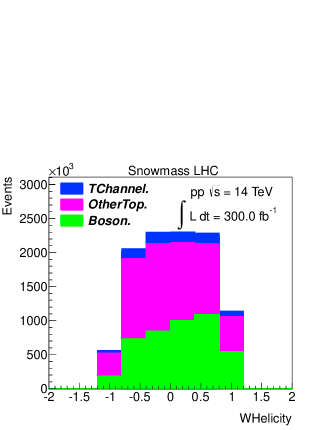
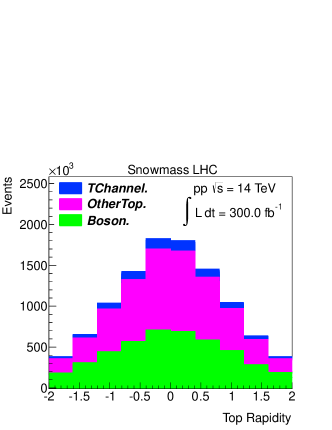
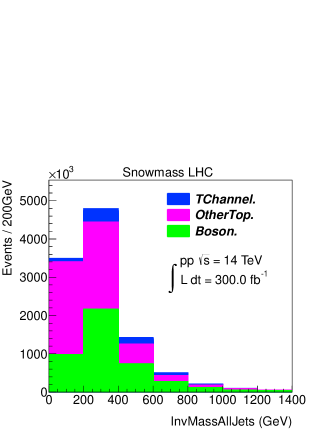
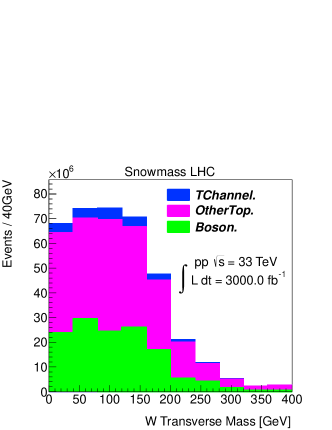
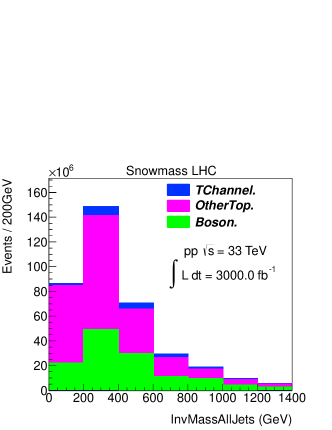
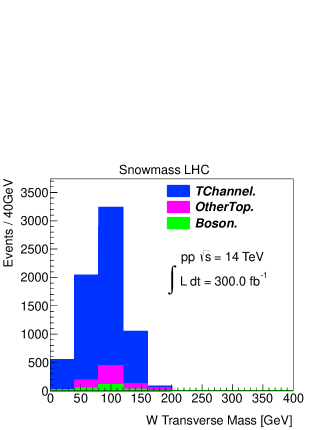
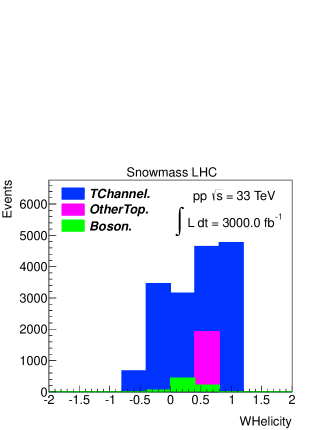
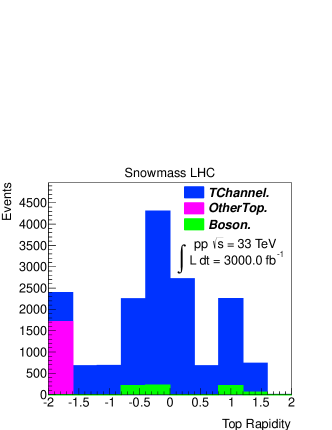
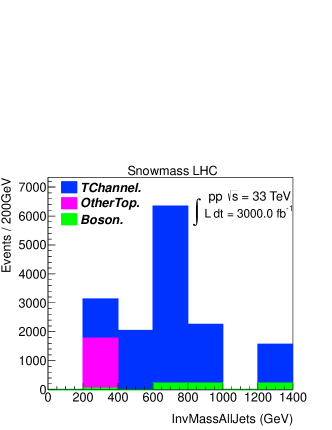
Figure 2 shows some kinematic distributions after the preselection cuts are applied. The contributions are broken into the -channel single top signal events, other top events that correspond with and , and other backgrounds that come from +jets and diboson events (labeled as Boson on the plots). The expected events are normalized using the 14 TeV reference cross-sections and the integrated luminosity of 300 fb-1. The distributions for 33 TeV are shown in Figure 3.
IV Event selection
To improve signal to background ratio events are required to pass the following selection cuts for 300 fb-1 at 50 pile up:
| Leading non--jet | ||||
| Top Mass | ||||
| Top PT | ||||
| Top Polarization Optimal Basis | ||||
| Scalar |
For the 3000 fb-1 scenario at 14 TeV, the same selection cuts are used except the cut, which is loosened to .
In the case of 33 TeV, the preselection is slightly modified increasing the lepton cut from 40 to 50 GeV and increasing the jet cut from 70 to 75 GeV. Moreover the final selection includes modifications of the same cuts as well as the addition of leading non--jet GeV. The cut has been loosened to 550 GeV, the top polarization cut is tightened to 0.2, and the top cut has been tightened to 100 GeV. These differences select a kinematic region with the highest signal to background ratio while maintaining sensable cuts based on expected -channel kinematics.
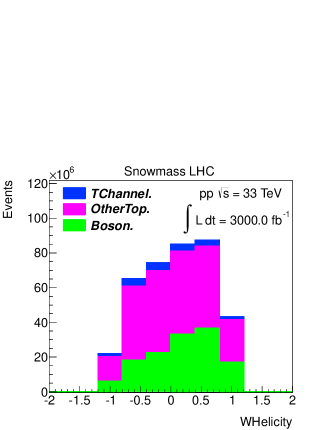
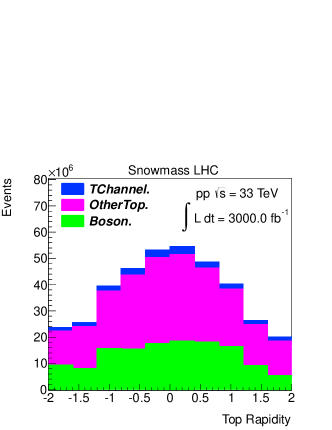
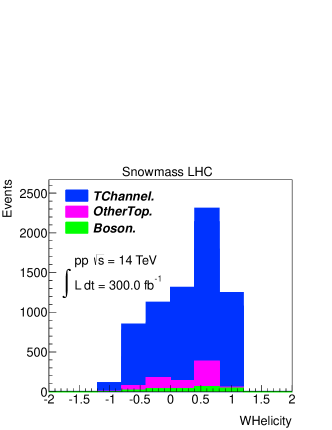
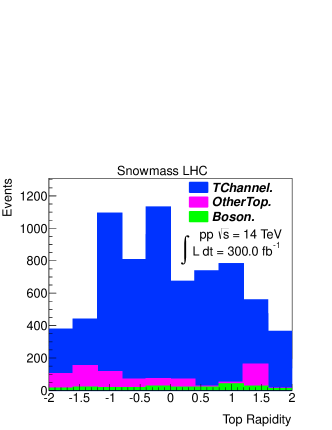
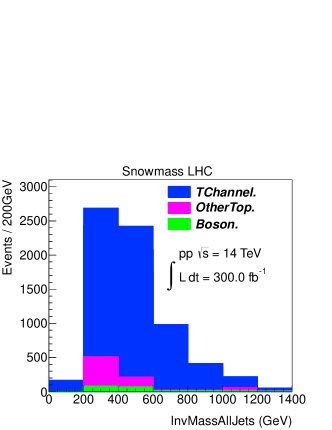
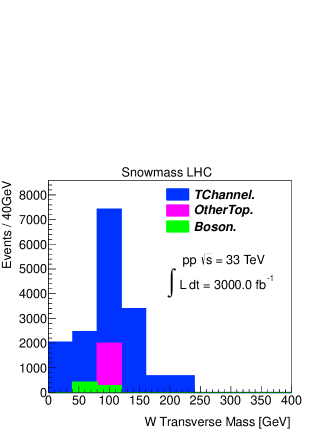
Figures 4 and 5 show the effect of the cuts for the 300 fb-1 14 TeV sample. For each histogram, all cuts are applied except on the variable shown. Figures 6 and 7 show the same for 33 TeV.
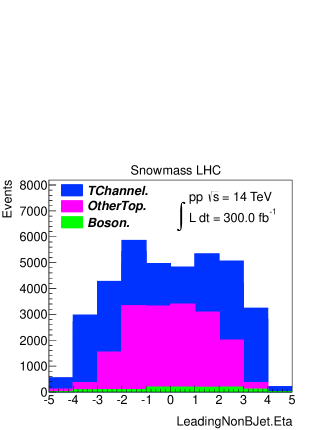
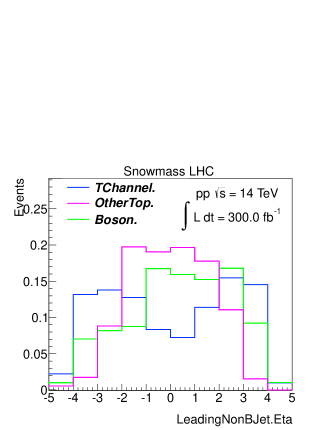
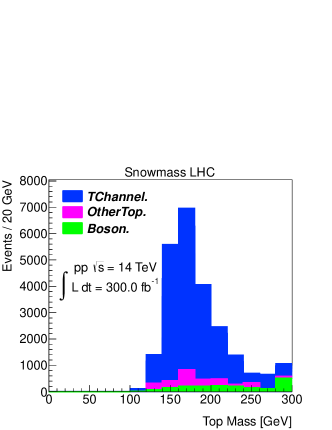
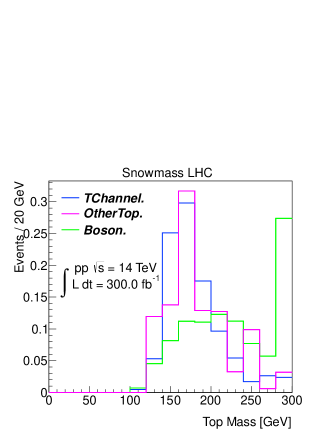
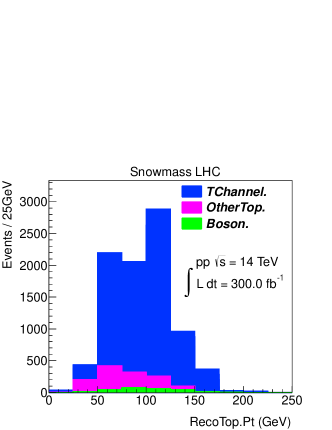
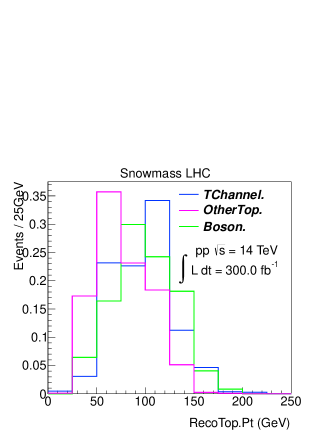
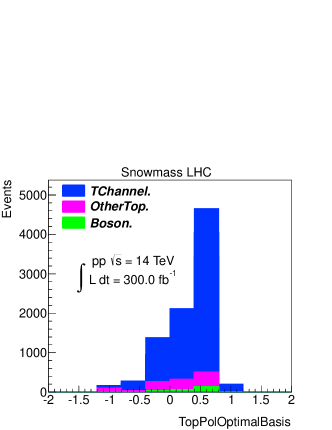
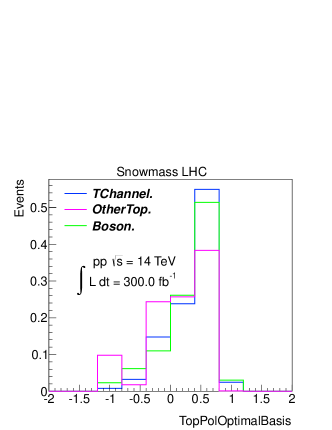
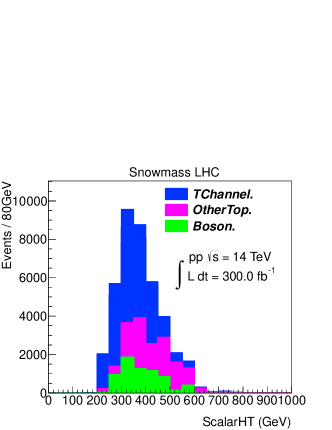
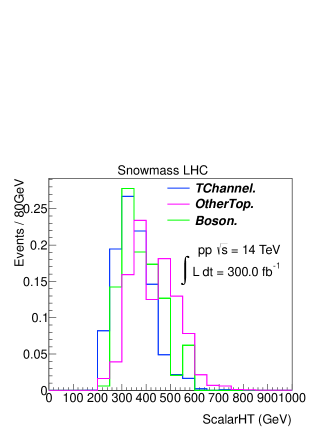
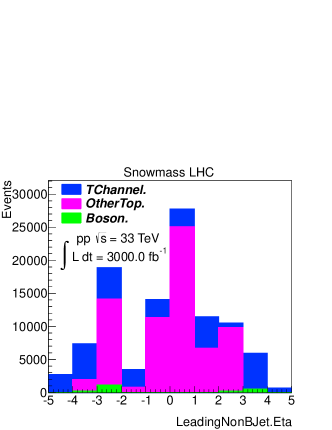
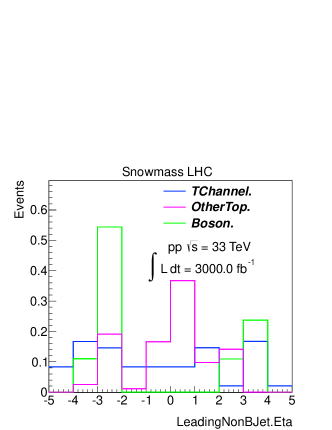
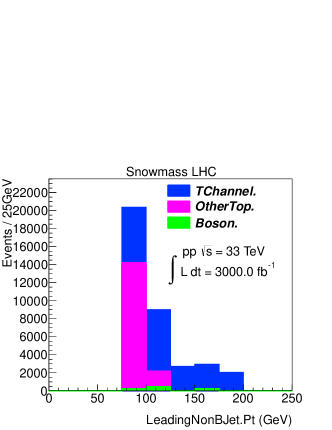
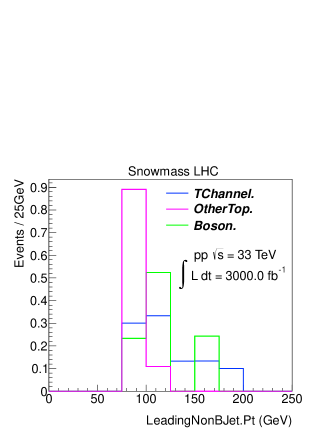
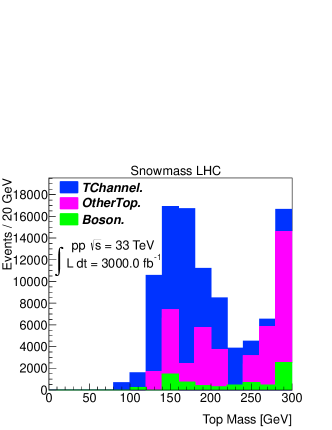
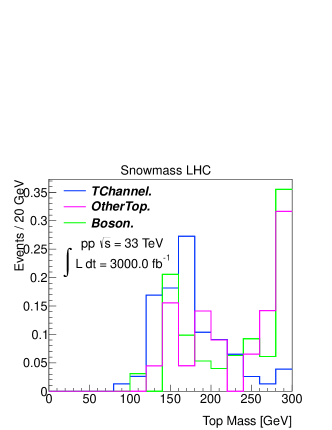
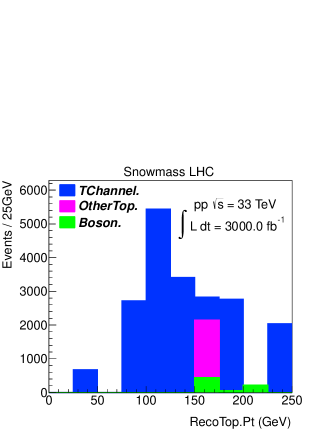
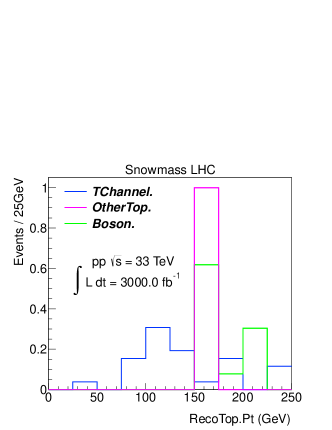
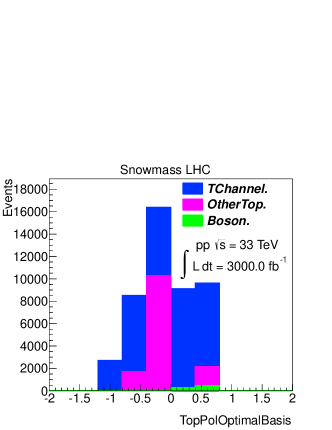
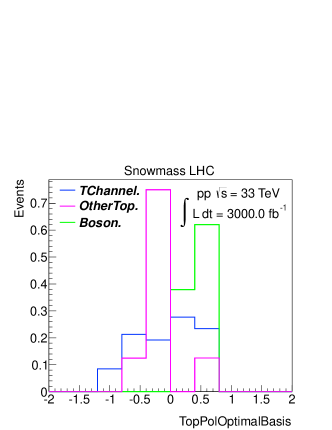
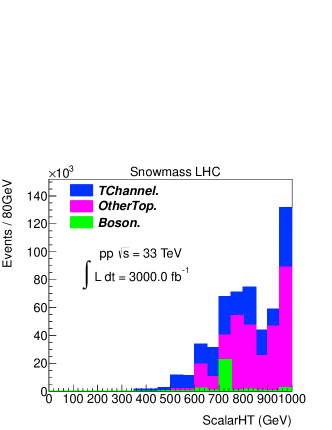
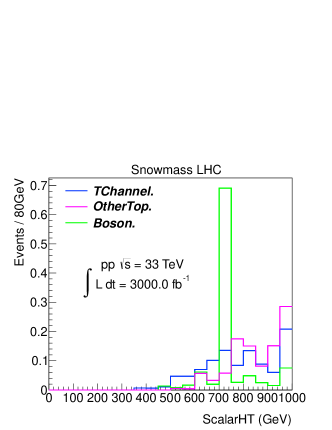
AT 14 TeV it is clearly visible that the most powerful variables to cut on are the leading non--jet and , whereas the top mass, and polarization only add some additional discrimination. At 33 TeV, the distributions are broader and the available statistics are lower, but the leading non--jet and are powerful variables again, whereas now the separation power of is limited.
Tables 3, 4 and 5 show the number of events passing each cut for 50 pile up at 14 TeV, 140 pile up at 14 TeV, and 140 pile up at 33 TeV respectively. The signal contribution over the total background after all cuts is about 7.3 for 50 pile up at 14 TeV, 8.2 for 140 pile up at 14 TeV, and 5.9 for 140 pile up at 33 TeV. The number of expected -channel signal events is 6000, 9000, and 14000, respectively. These are large, clean event samples suitable for further single top studies.
| Event Yield | Signal | diboson | Total Background | |||
|---|---|---|---|---|---|---|
| no cuts | 1.81e+07 | 2.10e+07 | 2.14e+08 | 1.09e+08 | 3.62e+07 | 3.80e+08 |
| preselection | 746000 | 439000 | 5.01e+06 | 122000 | 102000 | 5.67e+06 |
| Leading non--jet | 159000 | 13900 | 187000 | 3850 | 20200 | 226000 |
| Top mas window | 33600 | 1460 | 25700 | 105 | 1060 | 28300 |
| Top | 29300 | 1270 | 22100 | 97.8 | 964 | 24400 |
| Top Polarization | 22100 | 700 | 10600 | 74.3 | 769 | 12100 |
| 6120 | 57.4 | 570 | 12.5 | 197 | 836 |
| Event Yield | Signal | diboson | Total Background | |||
| no cuts | 1.81e+08 | 2.10e+08 | 2.13e+09 | 1.09e+09 | 3.62e+08 | 3.79e+09 |
| preselection | 7.46e+06 | 4.23e+06 | 4.96e+07 | 1.22e+06 | 1.04e+06 | 5.61e+07 |
| Leading non--jet | 1.68e+06 | 189000 | 2.57e+06 | 52800 | 201000 | 3.01e+06 |
| Top mas window | 306000 | 17400 | 274000 | 2580 | 9970 | 304000 |
| Top | 263000 | 14300 | 229000 | 2530 | 8870 | 255000 |
| Top Polarization | 189000 | 8180 | 125000 | 481 | 6980 | 140000 |
| 9380 | 115 | 672 | 0.0 | 345 | 1130 |
| Event Yield | Signal | diboson | Total Background | |||
| no cuts | 2.52e+09 | 9.88e+08 | 1.13e+10 | 2.70e+09 | 8.28e+08 | 1.59e+10 |
| preselection | 1.66e+07 | 1.25e+07 | 1.60e+08 | 4.30e+06 | 2.04e+06 | 1.79e+08 |
| Leading non--jet | 5.25e+06 | 1.51e+06 | 1.98e+07 | 458000 | 585000 | 2.23e+07 |
| Leading non--jet | 3.74e+06 | 557000 | 8.13e+06 | 190000 | 426000 | 9.30e+06 |
| top mas window | 666000 | 47000 | 1.00e+06 | 10000 | 16800 | 1.07e+06 |
| top Pt | 595000 | 33000 | 842000 | 9200 | 14300 | 898000 |
| Top Polarization | 184000 | 8700 | 237000 | 2250 | 7970 | 256000 |
| 14200 | 0.0 | 1710 | 54.0 | 650 | 2410 |
A -channel cross-section measurement can be extracted in a simple analysis by assuming that the background is estimated with a large systematic uncertainty of 30% that accounts for both detector modeling (including jet energy scale and pileup and -tagging) and theory uncertainties. No systematic uncertainty is assigned to the signal. The resulting signal uncertainty is then added in quadrature with the statistical uncertainty to give the total expected uncertainty shown in Table 6.
| Collider | statistical | systematic | total |
|---|---|---|---|
| uncertainty [%] | uncertainty [%] | uncertainty [%] | |
| 300fb-1, 14 TeV | 1.4 | 4.1 | 4.3 |
| 3000fb-1, 14 TeV | 1.1 | 3.6 | 3.8 |
| 3000fb-1, 33 TeV | 0.9 | 5.1 | 5.2 |
Even though the relative background uncertainty is large, the signal cross-section can still be measured with high precision because the selected sample consist almost entirely of -channel signal events. The signal precision improves at the high-luminosity LHC due to the larger event sample.
Figures 8 and 9 show kinematic distributions after all cuts for 300 fb-1 at 14 TeV and 3000 fb-1 33 TeV, respectively.
V Conclusions
We have presented the -channel single top quark production cross-section measurement for three scenarios, studied within the context of the Snowmass energy frontier group: 300 fb-1 of 14 TeV data with an average pileup of 50 events, 3000 fb-1 of 14 TeV data with an average pileup of 140 events, and 3000 fb-1 of 33 TeV data. For each the appropriate Snowmass detector models are used. The -channel events are selected in the lepton+jets top quark decay mode. The background consists mainly of +jets and top quark pair events. The -channel signal is isolated through a series of cuts, resulting in large, pure event samples. The expected -channel cross-section precision is about 5% or better.
Acknowledgements.
We acknowledge the support of the entire Snowmass effort, in particular the samples provided by the energy frontier. This work was supported in part by the U.S. National Science Foundation under Grants No. PHY-0952729 and PHY-1068318.References
- Aad et al. (2012) G. Aad et al. (ATLAS Collaboration), Phys.Lett. B716, 1 (2012), eprint 1207.7214.
- Chatrchyan et al. (2012) S. Chatrchyan et al. (CMS Collaboration), Phys.Lett. B716, 30 (2012), eprint 1207.7235.
- Tevatron Electroweak Working Group (2009) Tevatron Electroweak Working Group (CDF Collaboration, D0 Collaboration) (2009), eprint 0908.2171.
- Aaltonen et al. (2009) T. Aaltonen et al. (CDF Collaboration), Phys. Rev. Lett. 103, 092002 (2009), eprint 0903.0885.
- Abazov et al. (2009) V. M. Abazov et al. (D0 Collaboration), Phys. Rev. Lett. 103, 092001 (2009), eprint 0903.0850.
- CDF Collaboration (2012) CDF Collaboration, CDF/PUB/TOP/PUBLIC/10793 (2012), URL http://www-cdf.fnal.gov/physics/new/top/confNotes/cdf10793_Si%ngleTop_7.5_public.pdf.
- D0 Collaboration (2011) D0 Collaboration, Phys.Lett. B705, 313 (2011), eprint 1105.2788.
- ATLAS Collaboration (2012) ATLAS Collaboration (2012), eprint 1205.3130.
- CMS Collaboration (2012) CMS Collaboration (2012), eprint 1209.4533.
- CMS Collaboration (2013a) CMS Collaboration, CMS-PAS-TOP-12-38 (2013a).
- ATLAS Collaboration (2013) ATLAS Collaboration, ATLAS-CONF-2012-132 (2013).
- CMS Collaboration (2013b) CMS Collaboration, CMS-PAS-TOP-12-011 (2013b).
- Alwall et al. (2011) J. Alwall, M. Herquet, F. Maltoni, O. Mattelaer, and T. Stelzer, JHEP 1106, 128 (2011), eprint 1106.0522.
- MadAnalysis 5 - A package for event file analysis (2013) MadAnalysis 5 - A package for event file analysis, madanalysis.irmp.ucl.ac.be (2013).
- Sjöstrand et al. (2001) T. Sjöstrand et al., Computer Phys. Commun. 135, 238 (2001), eprint hep-ph/0010017.
- Pythia/pgs package for MadGraph (2011) Pythia/pgs package for MadGraph, launchpad.net/pythia-pgs-for-mg (2011).
- De Favereau J., Delaere C., Demin P., Giammanco A., Lemaître V., Mertens A., Selvaggi M. (2013) De Favereau J., Delaere C., Demin P., Giammanco A., Lemaître V., Mertens A., Selvaggi M. (2013), eprint 1307.6346.
- Snowmass Energy Frontier twiki page (2013) Snowmass Energy Frontier twiki page (2013), eprint http://www.snowmass2013.org/tiki-index.php?page=Energy+Frontier.