Self-organization in Pd/W(110): interplay between surface structure and stress
Abstract
It has recently been shown that submonolayer Pd on W(110) forms highly-ordered linear mesoscopic stripes at high temperatures. The stripes display an internal Pd superstructure with a nano-scale periodicity along the direction perpendicular to the periodicity of the stripes. The same type of superstructure is also observed in a wide range of temperatures below the stripe formation temperature. We present a combined experimental and theoretical study of this superstructure of Pd on W(110) and investigate its influence on the appearance of the linear mesoscopic stripes. By means of low-energy electron diffraction and low-energy-electron microscopy we show that it has a far more peculiar dependence on temperature and coverage than expected from a regular surface reconstruction. Using density-functional theory, we model the Pd superstructures as periodic vacancy-line type of configurations and investigate their energetics and elastic properties. From our calculated surface stresses and anisotropies for the vacancy-line type of configurations, and based on the continuum elasticity theory, we demonstrate quantitatively that the vacancy-line type of structure is a prerequisite for the formation of the linear mesoscopic stripes. Moreover, we show that the physics driving the formation of the internal superstructure is very similar to the one at play in forming the mesoscopic stripes themselves.
pacs:
68.43.Bc, 68.43.Fq, 61.05.jh, 68.37.Nq, 65.40.gp, 68.35.Gy, 81.16.Rf, 64.75.Yz1 Introduction
Recently, a novel mesoscopic striped phase of Pd/W(110) was observed above 1000 K [1], for submonolayer Pd coverages. It is long known that spontaneously formed periodic patterns can be stabilized at the mesoscopic scale via an energy balance due to long-ranged strain fields and short-ranged atomic bonds at the interface of two subdomains, [2] as has been demonstrated in many examples so far [3, 4, 5, 6, 7, 1]. In general, the inherent stress at surfaces of crystalline materials is an important driving factor in deciding the structural properties at length scales spanning from atomic to macroscopic distances [8, 9, 10, 11]. A recent investigation of the two-component Pd-O adsorbate stripes on W(110) [4] demonstrated how stripes of various shape and orientation can be obtained by altering the oxygen concentration and the resulting surface stress differences between the two adsorbate phases.
Interestingly, the Pd stripes in the Pd-O-covered W(110) display also themselves an internal nano-scale superstructure [4]. This structure is of the same type as displayed by submonolayer Pd on W(110) [4, 12], which has been previously described as one-dimensional pseudomorphism at room temperature [12]. Also for the Pd/W(110) stripes the same type of internal structure can be deduced, based on the similarity of the low-energy electron diffraction (LEED) patterns of the Pd/W(110) mesoscopic stripes [1] and the submonolayer Pd on W(110) superstructure [12]. Based on these two independent findings [1, 12], it can be inferred that the periodicities of the mesoscopic linear stripes and their internal superstructure are along two perpendicular directions, which is a peculiar feature. Moreover, it can be expected that the internal superstructure has an important, if not decisive, role in the linear mesoscopic stripe creation, as the existence of such stripes is conditioned by a limited range of surface stress differences between the two phases on the surface [13].
Overall, there have been only a few structural studies of ultrathin Pd films on W(110) [1, 12, 14, 15, 16]. For submonolayer to monolayer Pd coverages, this includes a combined LEED and Auger electron spectroscopy study [12], a core-level photoemission study [15] and spectromicroscopic studies of the mesoscopic structures based on low-energy electron microscopy (LEEM) [1, 16] and x-ray photoelectron microscopy (XPEEM) [16]. In their extensive work, Schlenk and Bauer [12] reported a periodic superstructure along for submonolayer Pd on W(110) annealed at temperatures above 450 K. The superstructure LEED spots observed in this study remained independent of coverage up to about 0.9 monolayer (ML), above which it transformed into a pseudomorphic (PS) layer. However, further details on the nature of this one-dimensional pseudomorphism of submonolayer Pd on W(110) are still missing. The questions in this regard become yet more interesting considering the lack of similar superstructures in submonolayer Pd films on related bcc(110) surfaces of Ta and Nb [17].
In this paper, we present a combined experimental and theoretical study of the Pd/W(110) periodic superstructure, and investigate theoretically the influence of this structure on the formation of the linear mesoscopic stripes. We first study the structure of Pd on W(110) as a function of coverage and temperature using LEED and LEEM. Our LEED measurements reveal, in particular, a striking continuous evolution of the Pd superstructure period, as a function of temperature, with an extrapolated inverse-period trend leading to the PS structure at 0 K. In order to understand the presence and nature of the superstructure, we then investigate, by means of ab initio density-functional theory (DFT) calculations, the equilibrium atomic structure and energetics of selected adlayer Pd configurations on W(110) compatible with the LEED characterization. The calculations consider the PS structure along with periodic vacancy-line type of superstructures. Among all configurations theoretically considered, the PS one is singled out as the lowest-energy state at 0 K, although the vacancy-line structures lie very close in energy. The differences are within the thermal energy for the temperatures at which the vacancy-line structures are observed. The experimental observation of the formation of the Pd superstructure, instead of the PS layer, at high temperature is explained qualitatively to be due to vacancy formation and vacancy-vacancy interactions becoming more pronounced at elevated temperature. Finally, by means of DFT we also examine the influence of the vacancy lines on the Pd/W(110) surface stress and demonstrate that the presence of the vacancy lines of nano-scale periodicity is a prerequisite for the formation of the observed Pd linear mesoscopic stripes. We note that our experimental findings on Pd/W(110) are similar to the observations on submonolayer Au/W(110) [18], which point to the generality of the forces at play in the formation of the superstructure, as we will discuss in the following.
The paper is organized as follows: in Section II we describe the experimental and theoretical methods. In Section III, we present our LEED results on Pd/W(110) as a function of Pd coverage and temperature. Section IV containts our results for the atomic structure and energetics of the PS and vacancy-line superstructures, as well as a discussion on the origins of the latter type of structures. While the results in section IV are mainly based on DFT calculations, we also report there LEEM and LEED data for the PS Pd/W(110) structure confirming the theoretical Pd adsorption site. Section V, based entirely on theory, includes our DFT results on the influence of the vacancy lines on the Pd/W(110) surface stress, and a discussion of the resulting dependence of the mesoscopic stripe pattern on the vacancy-line period of the superstructure. The Conclusions are then given in Section VI.
2 Methods
2.1 Experiment
The LEED and LEEM measurements were performed using the SPELEEM (Spectroscopic PhotoEmission and Low Energy Electron Microscope) at the Nanospectroscopy beamline (Elettra, Italy) [19]. LEEM operates by imaging elastically-backscattered electrons. Along with the usual contrast mechanisms [20], the ability to filter electrons at the diffraction plane allows to apply dark-field methods to LEEM. The spatial resolution in imaging is 12 nm.
In the micro-diffraction mode, the instrument is capable of acquiring LEED patterns from a 2 m-sized region. The transfer width of the microscope is about 10 nm, which defines the angular resolution. The distortion of the diffraction pattern is corrected by an offline analysis, allowing a precise determination of the distances in k-space.
The W(110) substrate was cleaned by the standard procedure of exposing it to mbar of molecular oxygen at 1100∘ C, and subsequent flashes to high temperature to remove oxygen. Pd was deposited from a target heated by electron bombardment. The rate calibration was done by following the changes in electron reflectivity.
2.2 Theory
We have performed DFT pseudopotential calculations in a plane-wave basis, using the PWscf code, a part of the Quantum espresso distribution [21]. The Perdew-Zunger parametrization [22] of the local-density approximation (LDA) has been adopted for exchange and correlation. To simulate different surface adlayer configurations, we used a supercell approach. An asymmetric slab with 1 Pd layer on 5 layers of W substrate (bottom 2 W layers were fixed) and 9 vacuum layers was constructed, both for relaxations and for subsequent stress calculations. The only exception related to the substrate thickness are the calculations of the pseudomorphic structure, which were performed on a 15-layer asymmetric slab, with 2 bottom W layers fixed.
Vanderbilt ultra-soft pseudopotentials [23] were generated from the atomic configuration of Pd and from configuration of W. The core-cutoff radii for Pd were: a.u. and a.u., and for W: , a.u. Our kinetic energy cutoff was 35 Ry for the wave functions and 350 Ry for the charge density. A k-point Monkhorst-Pack mesh [24] centered at was used for the W(110) surface unit cell. The analogues of that mesh with constant k-point density were used for the supercells of different dimensions. The theoretical W lattice constant, Å was used in the calculations (the experimental value is 3.16 Å). Total energy differences were converged to better than 0.5 meV per 6-layer slab (1 Pd + 5 W layers) with W surface unit cell lateral extent, while the forces were converged to better than 3.5 mRy/Å.
The surface stress was computed using the analytical expression derived by Nielsen and Martin [25], based on the Hellmann-Feynman theorem. The surface stress uncertainty was estimated to be 0.36 N/m on the basis of convergence tests regarding the kinetic-energy and wave-function-cutoffs, the number of k-points and the number of vacuum layers [26].
In order to obtain surface stress values for Pd-terminated surface from our assymetric slabs (with Pd on top and frozen W on the bottom), we subtracted the reference surface stress of the frozen W surface from the stress obtained for the assymetric slab. We checked the accuracy of this procedure by evaluation of surface stress from a symmetric slab (11 layers) and an assymetric (6 layers) slab calculation. The differences were within the estimated uncertainty, giving a confirmation of the validity of our calculational approach. We also checked the convergence of surface stress with respect to the slab thickness, as it is shown in Supplementary data. By increasing the number of vaccum layers, we also checked that the presence of an electric field, due to different terminations of our slab, has no significant influence on the surface stress results.
For comparison, we also performed stress calculations for the Pd(111) surface. The theoretical lattice constant of bulk Pd is Å (experimentally, it is 3.89 Å). In fact, the PS configuration of the Pd overlayer on W(110) can be viewed as a Pd(111) monolayer oriented with its inplane axis parallel to the W[001] surface axis, and expanded by 14.4% along the W[001] direction and contracted by 6.6% along the W axis, with respect to the bulk Pd(111) layer (the corresponding experimental values are % and %). For the Pd(111) surface calculations, we used a symmetric slab of 11 Pd layers (with the 4 outer layers on each side relaxed) and the same plane-wave cutoffs and k-point grid as for the W surface.
3 LEED Results on Pd/W(110)
We monitored the evolution of the Pd mismatch to the underlying W lattice, via the extra Pd diffraction spots separated along from those of the substrate (see inset in figure 1). For all temperatures considered, the spot profiles were well described by gaussians used in finding the peak positions. Moreover, the sharp spots confirm the presence of a long-range ordered superstructure. Figure 1 displays the evolution of the superstructure period as a function of Pd coverage, along with the corresponding changes in the intensity ratio between the superstructure and substrate spots acquired at a fixed temperature of 750 K. The real-space superstructure period is obtained by taking the inverse of the diffraction spot separation.
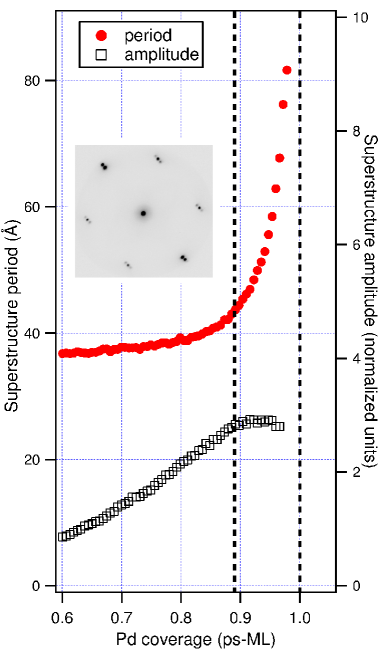
The coverage dependence of the period shows two important characteristics. Firstly, the period is almost the same for all coverages below about 0.89 ML at this temperature, consistent with the past measurements [12]. The Pd extra spots are separated from those of the underlying tungsten by a constant momentum transfer for all diffraction orders.
The second feature is the continuous transition of the Pd lattice towards the pseudomorphic structure above 0.89 ML. The coverage at which the transition starts is marked by the first vertical dashed line in figure 1. Attributing this coverage ( ML[27]) to the superstructure layer covering the whole surface, we can deduce that there are two Pd vacancies per superstructure period (about 45 Å). Note that, at different temperatures, this transition, although not a sharp one, systematically shifts in coverage according to the dependence of period on temperature, further supporting the assignment of two vacancies per period. Also importantly, the transition to the pseudomorphic structure as a function of coverage takes place without an accompanying broadening of the diffraction peaks. This would indicate a continuous increase in the period of the defect line structure due to the additional material.
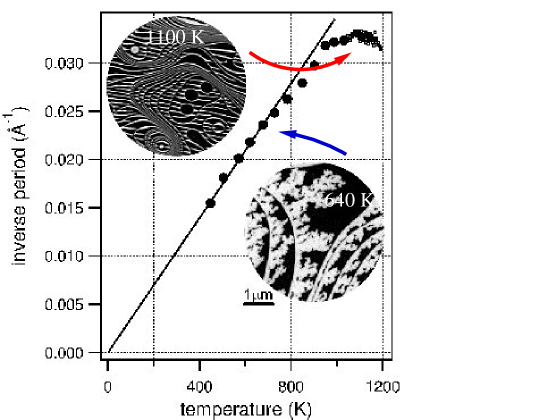
The distinction of Pd superstructure from a regular reconstruction is underlined by its temperature dependence. We observe that the inverse period continuously decreases for decreasing temperatures, going from 0.032 to 0.015 Å-1 as the temperature changes from 900 K to 400 K as seen in figure 2. The tendency of the inverse period towards zero with decreasing temperature is consistent with the pseudomorphic structure as the limiting case at 0 K. The superstructure spot shows a nearly constant full-width at half maximum in the range 400 to 900 K as shown in the Supplementary Information. Furthermore, below 400 K, the width increases sharply and the Pd spot cannot be identified reliably. We attribute this to a kinetic limitation, as the period gets longer whereas the diffusion is hindered at lower temperatures. Above 900 K, the spot again broadens considerably, and the structure period remains nearly constant. This roughly coincides with the experimental onset of stress-induced mesoscopic stripe formation [1], as also monitored here by LEEM (see insets in figure 2). A similar change in the behaviour of spot profiles at about 900 K is observed in Au/W(110) and is attributed to a lattice solid-liquid transition [18].
4 Pd-adlayer atomic structure and energetics
4.1 Pseudomorphic structure: theoretical and experimental results
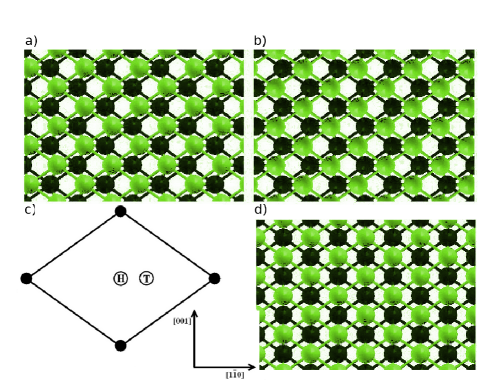
We have investigated the atomic structure of the pseudomorphic Pd/W(110) layer using DFT calculations. Figures 3(a) and (b) describe the atomically-relaxed configurations. Although previous density-functional calculations generally assumed the centro-symmetric “hollow” (H) adsorption site for Pd on (110) bcc metal surfaces [28, 29], we find that the preferred adsorption site is very close to the three-fold coordinated (T) adsorption site, shown in figure 3(c). The actual adsorption site is displaced by 0.5 Å from the H site in the direction of the T site, and is only 0.05 Å away from the T site, in figure 3(c). Breaking of the mirror symmetry signifies the existence of two domains degenerate in energy, those with left (L) and right (R) adsorption sites, relative to the H site, as shown in figure 3(a) and (b). The lateral displacements, with respect to the atomic positions in the continuation of the ideal W bcc lattice, as well as the interlayer distances of the adsorbate layer and of the three upper W layers are given in Table 1. The atoms of the upper W layer (and of the two layers below) are only slightly displaced from the bulk positions as can be seen in Table 1. The energy difference between the H-site configuration (figure 3(d)) and ground state for the Pd PS layer (figures 3(a) and (b)) is 67 meV per Pd atom [30].
| Layer | (Å) | (%) |
|---|---|---|
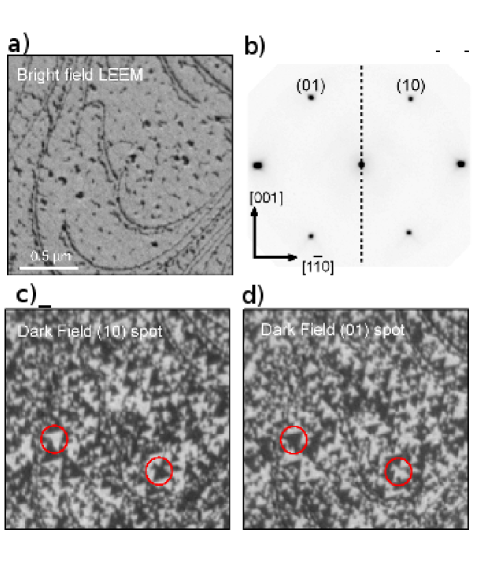
The breaking of the mirror symmetry is directly confirmed by LEEM measurements displayed in figure 4. The LEEM image obtained from the specularly-reflected electrons (i.e., bright-field LEEM) shows, in figure 4(a), the pseudomorphic Pd monolayer along with small islands of larger thickness. The coverage was chosen on purpose to be slightly above 1 PS-ML, in order to avoid the complicated superstructures below monolayer coverage.
The LEED pattern in figure 4(b) confirms that the Pd layer has the same in-plane symmetry and period as the W(110) surface. However, the dark field images in figures 4(c) and (d) reveal the presence of two domains. The dark-field images are acquired by using a filter at the diffraction plane in order to image with only those electrons belonging to a particular diffraction spot. The two panels displayed in figure 4 are acquired using the integral spots connected by a mirror reflection about the [] axis. The presence of complementary domains reflects the absence of the corresponding mirror symmetry.
4.2 Vacancy-line structure: DFT results
For coverages below 1 ML, the superstructure observed in LEED indicates a smaller density of Pd atoms along [10] than in the pseudomorphic structure. In our DFT simulations, atomic relaxations systematically indicate the spontaneous creation of a vacancy line when the number of Pd atoms is less than the number of registry positions. This is found for various initial configurations, including starting from a homogenous distribution of Pd atoms, with interatomic Pd distances along [10] larger than the W-W distance in that direction. Therefore, we have modeled the observed superstructure with periodic vacancy lines pointing along the [001] direction. We note that we also compared the formation energy of vacancy lines along [001] and along [10], using a small test structure with a period of 6 W surface unit cells i.e., 5 Pd atoms per 6 adsorption sites (assuming one adsorption site per W surface unit cell). The vacancy formation energy along [10] is larger by 75 meV/vacancy than along [001], which is in agreement with the experimentally observed direction for the vacancy lines, and gives the energy scale corresponding to the anisotropy of this superstructure.
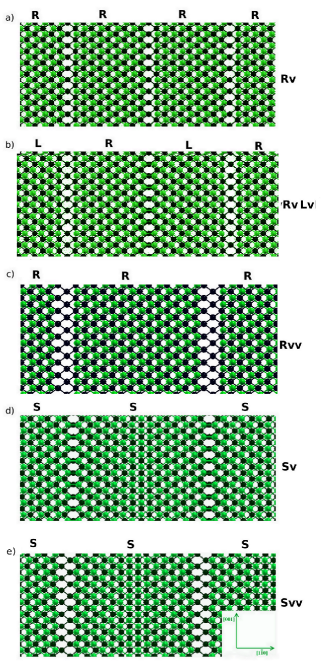
Figure 5 illustrates the types of vacancy-line structures, with vacancy lines along [001], which we considered. They are labeled according to their periodic sequence, along [10], of Pd domains and vacancy lines (such as Rv, RvLv, etc.), where “R” (“L”) refers to a Pd domain with preferred R- (L-) three-fold sites and “v” stands for the vacancy line. As indicated in figure 5, we considered single (“v”) and double (“vv”) vacancy lines, and also symmetric (“S”) Pd domains. The period and Pd coverage of the superstructure are specified with the notation , where is the supercell period (number of W atoms) along [10] and is the number of Pd atoms per period, yielding the superstructure nominal coverage: . We consider up to two vacancies per period and, for simplicity (symmetry), R and L domains of the same size in a given superstructure. For simplicity, we consider only straight vacancy lines, neglecting roughening effects [31].
As mentioned earlier, the LEED data displayed in figure 1 indicate two Pd vacancies per superstructure period. Therefore, we principally focused on structures with , which are made of either a double-vacancy line, or two single-vacancy lines that separate alternating L and R domains. For the sake of comparison, however, we also included in our study single-vacancy configurations with , for even , which correspond to the same coverage as the configurations.
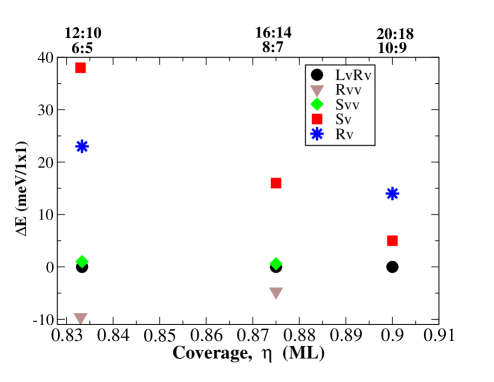
We considered three different coverages between 0.8 and 0.9 ML and several different configurations for each of these coverages. The relative total energies of these various configurations (with relaxed atomic structure) at each coverage are displayed in figure 6, as a function of coverage. Two of these coverages, namely the ones related to the 20:18 and 16:14 configurations, are compatible with experiment, as shown in figure 2, at temperatures of 650 K and 850 K, respectively. For the highest coverage, fewer theoretical configurations were considered, as the relaxations for the supercell size become computationally very heavy. Inspection of figure 6 indicates that, consistent with the LEED measurements (showing two vacancies per period) the structures with one vacancy per period (Sv, Rv) are systematically highest in energy. We also observe that the double-vacancy structure (Rvv) is the lowest in energy for the two lowest coverages considered. In view of the trend, in figure 6, of decreasing energy differences (approaching zero) with increasing coverage (to 1 ML), one may also expect the Rvv configuration to be slightly lower in energy than the RvLv and Svv configurations at the third coverage (0.9 ML). However, it should be noted that the energy differences between the Rvv, RvLv and Svv are very small, namely within 5 meV per Pd atom for the second coverage in figure 6, i.e., for the period of 16 W [10] lattice spacings (the period observed at about 850 K, in figure 2). Hence, although the Rvv structure is theoretically slightly lower in energy, all three structures are essentially degeneratre within kT, at the high temperature (T = 850 K) at which they are observed (and we expect to be same for the third period corresponding to and T = 650 K) [32].
The relaxed atomic configurations reported in figure 5 disclose the tendency of the Pd atoms to “slide” on the tungsten surface along the [10] axis, leading to Pd adsorption sites which gradually change throughout the R, L, and S structures in between two grain boundaries. To describe the magnitude of these variations of the Pd overlayer and their spatial distribution, we plot in figure 7 the optimized Pd interatomic spacings in the [10] direction, , (a) and Pd atomic positions, , perpendicular to the W(110) surface (b) for RvLv structures with periodicities 12, 16, and 20. (The Rv, Rvv, Sv and Svv structures are considered in the Supplementary data).
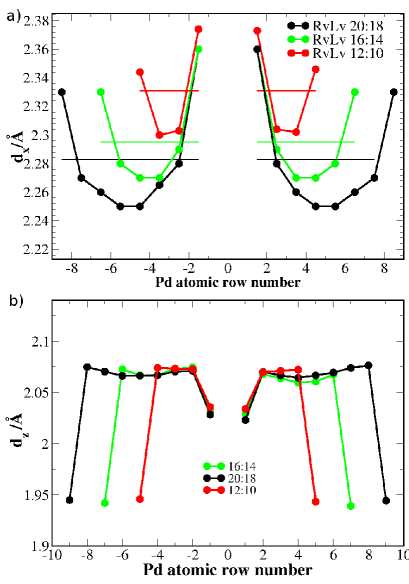
The positions are measured relative to the outermost W atom within the Pd-covered region of the surface. “Atom row number” describes the atomic row position within the surface structure in the [10] direction; the zero is located at the center of the narrow vacancy-line between the R and L adsorption sites (i.e., the central vacancy in figure 5(b)). We see, from figure 7(b), that large relaxations in the vertical direction occur only at the edges of the Pd domains, and that the central part of the Pd domains does not have significant variations along the direction. The main relaxation is in (figure 7(a)) and is a systematic “stretching” of the Pd domains in the [] direction along which vacancy lines are introduced. The largest expansion takes place around the vacancy lines, while the least stretched are the central parts of the Pd domains. Figure 7(a) also shows that the average Pd-Pd distance (stretching) increases with decreasing size of the Pd domains. Such a stretching of the Pd domains is a general feature we find for all superstructures considered with [001]-vacancy lines (see Supplementary data). The Pd(111) layer is indeed compressed ( % lattice mismatch, see Section IIB) along the [10] axis in the PS configurations, and tends to relax the associated strain in the presence of vacancy lines. Such vacancy lines may thus be viewed as analogous to dislocation lines at fully developed interfaces.
We also note that, in the specific case of the Rv and RvLv structures which are rather similar (figures. 5(a) and (b)), the relaxation of the Pd is important to explain the lower energy of the structure with two vacancies per period (RvLv) with respect to the structure with one vacancy per period (Rv). Due to an increased number of degrees of freedom of the RvLv structure, the Pd in that structure is able to stretch more towards the vacancy line at the center of figure 5(b), with a significant related decrease in energy compared to the Rv structure [33]. We stress, however, that the analysis is different when comparing the stability of the double-vacancy-line structures (such as Rvv) and single vacancy-line per period structures (such as Rv), which have completely different Pd domain sizes (at constant ). An intrinsic stability of the double-vacancy line appears to dominate the energy trend in that case.
4.3 DFT surface energies: PS vs. vacancy-line structures
To determine the relative stability of the different single-phase surface structures with different nominal coverages (), in figure 8(a) we compare the surface formation energies, relative to the clean W(11) surface, of the PS configuration, two RvLv configurations and one Lv configuration, as a function of Pd chemical potential.
The formation energy, , shown in figure 8(a), is defined as [34]:
| (1) |
where stands for the energy of the Pd/W slab (5 layers W + 1 adsorbate Pd layer), for the energy of the 5-layer W slab, for the Pd chemical potential, and for the number of adsorbate atoms and vacancy lines ( or ) respectively, in the surface unit cell of the vacancy-line structure. The superscripts denote the sizes of the respective surface cells. In figure 8(a), is normalized to the number of W surface unit cells () within the (super)structure.
As seen in figure 8(a), the PS configuration is the ground state for all Pd chemical potentials considered. Vacancy configurations are ordered in by increasing nominal coverage , so that, for the same type of vacancy, the structures with longer periods are lower in energy. This indicates that the differences in figure 8(a) are dominated by the energy cost of the creation of a vacancy line. The particular type of the vacancy line has a smaller influence on the energy (e.g., 10:9Rv vs 20:18RvLv). The symmetric configurations are not included in the figure, as their dependence on Pd chemical potential is identical to that of the Rv-type (RvLv-type for the double vacancy) structures, with a rigid shift in energy displayed in figure 6.
To address the energy changes of the surface as a function of Pd coverage, it is useful to evaluate the internal surface energy per Pd atom, , of the different single-phase Pd/W(110) structures relative to the uncovered W surface:
| (2) |
It allows one to describe the physical situations in which only a part of the whole W surface is covered by a uniform distribution of Pd (in a given structure). The energy change of the whole W surface as a function of Pd coverage may then be evaluated as a weighted average of the Pd-covered regions as:
| (3) |
In figure 8(b), we display the surface energy variations, as a function of Pd coverage, for the different Pd/W(110) structures, relative to the PS structure. The energy is normalized to the total number of W unit cells on the surface (counting also the uncovered W). As superstructures have a lower Pd density compared to the pseudomorphic structures, they cover a larger area (greater “areal coverage”) for a given submonolayer coverage of Pd, with respect to the PS configuration. This brings about a gain in energy, because the uncovered tungsten surface is energetically less favorable compared to all the Pd adlayer structures considered, as seen in figure 8(a). A superstructure with a unit cell covers times more area compared to the pseudomorphic layer. Therefore, in order not to include adatoms on top of the first Pd overlayer, we limited ourselves to coverages up to the nominal coverage of each structure, (i.e., up to 0.9 ML for 10:9Rv and 20:18RvLv and up to 0.83 ML for 12:10RvLv). Here, once again, the PS configuration has the lowest internal energy and the structures are ordered in by their dislocation density for each vacancy type.
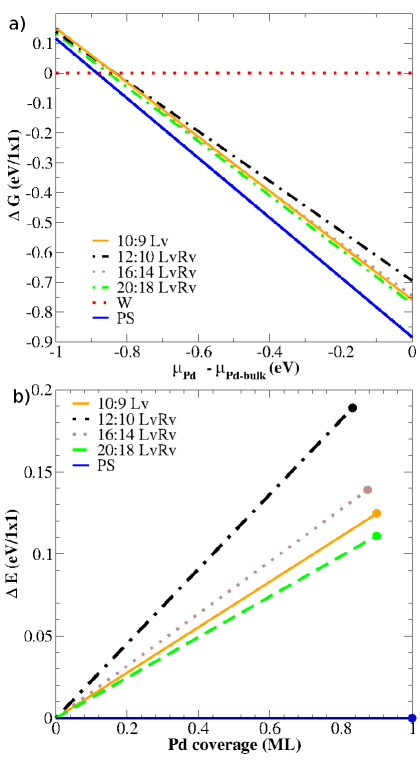
The weighted-area approach used for the in figure 8(b) assumes large continuous areas covered or uncovered by the Pd adlayer, as no effect of boundary energy (Pd step energy on W(110)) is taken into account. For easier comparison, the corresponding differences in internal energy between the vacany-line and the PS structure are reported in table 2. As can be seen from figure 8(b) and table 2, energy differences are smaller compared to figure 8(a), but the structures are ordered energetically in the same way with the PS being the lowest energy state.
| Superstructure | (meV/Pd atom) |
|---|---|
Therefore, on the basis of figure 8(a) ( as a function of Pd chemical potential) and figure 8(b) ( as a function of Pd coverage), the ground state of Pd/W(110) at K is the PS configuration, even for submonolayer coverages. This is consistent with the observation that the experimental period increases continuously with decreasing temperature, and tends to the PS structure when extrapolating the trend to 0 K. Our calculations are also in agreement with Bauer and van der Merwe [35], who predicted that at 1 ML coverage, Pd/W(110) should be pseudomorphic. However, the experimental findings, reported in figures 1 and 2, show that at elevated temperatures and at submonolayer coverages the loosely-packed vacancy-line structures prevail over the dense pseudomorphic one. Although our DFT calculations clearly address only the internal energy (and not the free energy at finite temperature), also these experimental findings may be rationalized, in part, based on our DFT results. The increase of temperature, in general, is expected to enhance the vacancy creation, which is a prerequisite for the vacancy-line structures. Furthermore, we see from Table 2, that the internal surface energy difference between, e.g., 20:18 RvLv and PS is rather small (24 meV/Pd atom), it is less than (56 meV) at 650 K, the temperature at which a configuration with such a period and coverage was detected. Therefore, it is reasonable to expect, based on the energy differences, that temperature will influence the type of surface atomic structure established, by making possible the formation of such vacancy-line structures. In addition, it can be also expected, purely on the basis of energy comparison among the various vacancy-line structures, that, as temperature increases, also the structures with gradually decreasing periods can be formed.
4.4 Origins of the vacancy-line structures
So far, we have not yet discussed how the vacancy-line structures form. A very important ingredient in deciding the structure is the long-ranged vacancy-vacancy interactions. In reality, the corresponding contribution to the total energy is inherently taken into account in our DFT slab calculations with the relaxed atomic positions. Such interactions were found to be responsible for the formation of periodic vacancy lines in similar adsorbate layers [36, 37]. In the case of Ge/Si(001), it was found, using STM and Monte Carlo simulations, that perpendicular to the vacancy lines their interaction is short-range repulsive and long-range attractive, balancing at , where is the Si lattice spacing [36]. This kind of interaction has a potential to balance the vacancy-creation energy.
However, in our case, at zero temperature, the energy gain due to vacancy-vacancy interactions (estimated as a few tens of meV per supercell, e.g. for the 16:14 structure, based on the relative RvLv energies in Table 2) is expected to be small compared to the vacancy creation energy (of at least a few tenths of an eV per vacancy, based on the absolute energies in Table 2). The importance of temperature is revealed in the comparison of the competing energy scales. Virtually all the elasticity-induced self-organized adlayers reported in literature require elevated temperatures for the formation of the periodic patterns. The underlying reason is the different scaling of the various contributions to the free energy with increasing thermal disorder. The thermal scaling of the free energy parameters of the stripe-forming elastic lattice was given by Menteş et al. near the critical regime for the lattice gas transition [1]. The general argument, in which the interaction energy between the defect lines goes down slower than the defect formation energy with increasing temperature, applies also to the current system with periodic vacancy lines.
5 Surface stress and mesoscopic stripes
5.1 Influence of vacancy lines on surface stress: DFT results
The calculated stresses for PS and various vacancy-line structures are shown in figure 9 as a function of the inverse vacancy-line period. We use here the period as a reference, instead of coverage, as it facilitates following the trends with supercell size for a given type of vacancy. For completeness, we also include single-vacancy-per-period structures, which have thus, for the same inverse period, a different coverage from the other structures.
We note that in terms of the sign of the absolute surface stress, all the structures are in tension in both crystallographic directions. Tensile stress indicates that the stress relaxation would cause contraction of the interatomic distances. In the PS structure, on the basis of the bulk inplane lattice mismatch between Pd and W along the W[001] and directions %, %, ( % and % in section II.B), one would expect a strong compressive change of stress along [001] with respect to the stress of W(110) and a tensile change along [10]. Instead, from our calculations, it follows that in both directions the change with respect to W(110) is compressive, and of almost equal magnitude for the PS structure. (For further discussion see Supplementary Data). It is a direct indication that the lattice mismatch cannot explain even qualitatively the behavior of the surface stress of this monolayer adsorbate system. This result is consistent with other studies of surface stress of monolayer adsorbates like, for example, Fe/W(110) and Ni/W(110) [38, 39, 40, 11].
From figure 9 we see that the stress is increasing (it becomes more tensile) in both directions, upon addition of vacancy lines. Indeed, a more tensile stress can be expected as a consequence of stretching (introduction of vacancy). This clearly demonstrates that the appearance of the vacancy-line structures is not driven by a reduction of surface stress, a finding similar to the previous results on the missing-row reconstruction at the (110) surface of fcc transition metals [41].
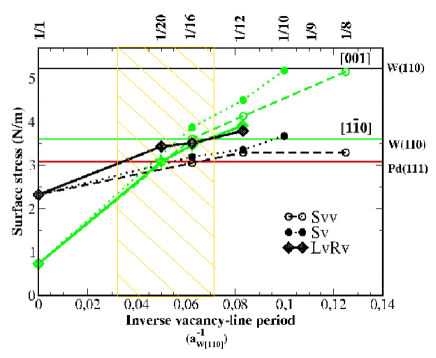
Importantly, we observe that the stresses for the RvLv and the Svv and Sv structures do not differ significantly for a given period (see 1/16 and 1/12 inverse periods), especially for the cases with same Pd coverage. The lines connecting points have similar slopes and they seem more or less only off-set by a constant value, comparable to the numerical accuracy.
Moreover, we note that the stress changes more along [10], than along [001]. This is to be expected as the defect (and change in strain) is introduced along [10]. As the inverse defect period increases, so does the effect of the vacancy on the stress, because the Pd stretching increases (see figure 7). The change along [001] can be analysed in terms of Poisson ratio, which states that for a positive Poisson ratio [42] stretching of an elastic layer material along one direction would result in contraction of the layer along the perpendicular direction. A tendency to contract along [001] would thus increase the tensile stress along that direction.
In addition, we observe that the stress is less anisotropic for vacancy-line structures with periods within the experimental range, than for the PS configuration. We also note that the surface tension, defined as , is significantly closer to the Pd(111) value for inverse periods of 20, 16 and 12, than it is for the PS configuration. Interestingly, it appears that the surface stress of superstructures in the experimentally relevant range of inverse periods is close to the isotropic surface stress of Pd(111) (3.08 N/m in our calculations, see in figure 9).
5.2 Conditions for the appearance of linear mesoscopic stripes
Results from figure 9 show that the surface stresses of the vacancy-line configurations with periods compatible with the experimental range differ significantly from that of the PS structure. According to the continuum model [13], the parameter that determines the type of adsorbate stripe pattern is the ratio of the stress changes between the two adsorbate phases along the two crystallographic directions. The stress-change at the boundary of the alternating regions within the stripe phase (i.e., Pd covered and uncovered regions on W(110)) is given by , where x indicates the direction, either [] or []. The ratio is compared to the critical ratio [13], where is the W Poisson ratio (yielding ). The ratio gives stripes with no preferred orientation (isotropic pattern of worm-like stripes), yields instead linear []-oriented stripes, whereas results in a herringbone-like structure and yields [001]-oriented stripes. Inspection of the data presented in figure 9 shows that the pseudomorphic Pd layer would result in a ratio , i.e., an isotropic pattern with worm-like stripes, which is not observed. Instead, the vacancy-line structures with period of 16 unit cells (which roughly corresponds to the period observed experimentally at the temperature of 850 K), yield , which is consistent with the experimentally observed mesoscopic []-linear stripe phase. Note that, using the same formulation and the stress parameters from the simulated vacancy-line structure and for the O/W surface [43], the creation of the experimentally-observed []-oriented Pd-O stripes on W(110) has been quantitatively explained [4].
Interestingly, from figure 9 it can be deduced that all the superstructure periods in the experimentally observed range do satisfy the above criterium for []-oriented Pd stripes, first with positive values for the periodicity of 20 unit cells, and then with vanishing (period of 16 unit cells), while becomes negative just out of this interval of experimentally observed periods, for the periodicity of 12 unit cells. Upon further reduction of the period to 10 unit cells, becomes smaller than , leading thus to a herringbone-like structure. These predictions do not depend significantly on the type of double vacancy structure (RvLv or Svv), while they are different for the single-vacancy-per-period configurations.
The preceding discussion reveals that the mesoscopic stripe phases of Pd on W(110) are sensitively dependent on the period of internal vacancy-line structures of the Pd layer. The mechanism which controls the period of the mesoscopic stripes is the temperature-dependent competition between the elastic and short-range atomic interactions [1]. The characteristic length scale of the pattern is determined by , where is the boundary free energy and is the Pd disordering temperature (1200 K) [1]. is the formation energy of the stripe boundary, i.e., Pd step which in our DFT calculations comes at a cost of about eV/Å, and is the elastic energy parameter [44]:
| (4) |
with E the Young’s modulus of the substrate. Taking and GPa for tungsten, and using our calculated N/m for the 16:14 RvLv structure, we find meV/Å, for the mesoscopic stripes along . Therefore, for the mesoscopic stripes the ratio is found to be nearly 40. Thus, at , the characteristic length scale of the stripe period, which is proportional to , is astronomically large using the numbers above. This is in agreement with the experiment, where no pattern is observed at low temperatures. On the other hand, for temperatures nearing the lattice gas transition , the step free energy, , scales towards zero, and it becomes possible to observe the stripe phase with the period in the submicron range.
Although vacancy-line configurations might be viewed as the striped pattern, strictly speaking, the same formulation as for the mesoscopic stripes cannot be applied, as they do not feature a well-defined atomic step or boundary, nor is the description within the continuum model clearly applicable to this system due to the atomic-scale dimensions. However, previously, the same formalism has been applied with some success also to very similar systems [37, 45]. We have obtained a good fit (not shown) of the period vs. temperature (in the range 400-960 K), which yielded the ratio of . This is an order of magnitude less than the ratio for the Pd/W(110) linear stripes [1]. As the defect energy is comparable to the formation energy of the Pd step, the long-range term, regarding the vacancy-vacancy interactions, should be an order of magnitude stronger. This indicates that the period of the vacancy-line structures should be about an order of magnitude smaller than the typical period of the mesoscopic stripes and at temperatures much lower than the lattice gas disordering transition, which is fully consistent with the experimental observations. A more rigorous proof would require a discretized version of the continuum model of elastic interactions [2] with an arbitrary force distribution within the period structure.
Finally, we conclude this section by noting that the vacancy-line order along [10] is a prerequisite for the formation of linear mesoscopic stripes. In particular, in our calculations, only the vacancy-structure periods of 12 unit cells and somewhat larger yield the right ratio of stress differences in the two directions. This is in agreement with the experimental findings which for Pd/W(110) yield a period of 14 unit cells along for the internal structure of Pd mesoscopic linear stripes, while in the case of the Pd-O stripes on W(110) the Pd vacancy-line periods are longer [4].
6 Conclusion
We studied the interplay between the surface structure and stress in Pd/W(110) for submonolayer coverages of Pd. In particular, we have characterized experimentally and theoretically the Pd/W(110) superstructure which, at high temperature (above 900 K), is observed as the internal structure of the Pd mesoscopic stripes. We demonstrated its critical role on the formation of the observed linear mesoscopic stripes.
The structure of Pd/W(110) was investigated using LEED and LEEM, revealing a particular temperature dependence of the periodic superstructure inverse period in the measured range (400 to 1200 K). In order to analyze further the observed superstructures, we performed DFT simulations of the internal-structure configurations. The calculations considered the PS structure along with periodic vacancy-line structures expected in a loosely-packed layer along . Among all the configurations theoretically considered, the PS one was singled out as the lowest energy state at 0 K, which is consistent with the LEED inverse-period trend extrapolated to low temperature. The experimental observation of the periodic superstructure instead of the PS layer at elevated temperatures was explained qualitatively to be due to vacancy formation and vacancy-vacancy interactions becoming more pronounced at increased temperatures. Finally, the calculated surface stresses for the vacancy-line structures were found to significantly differ from the stress of the PS configuration. Among different vacancy-line configurations with the same period in the experimental range, instead, the surface stress remained comparable. On the basis of the continuum model theory and our surface-stress values, we demonstrated that the vacancy-line structure in a certain range of periods is a prerequisite for the formation of the linear mesoscopic stripes, thus resulting in a peculiar arrangement of two mutually perpendicular types of striped periodic orderings at different lenght scales.
References
References
- [1] T. O. Menteş, A. Locatelli, L. Aballe, and E. Bauer. Phys. Rev. Lett., 101:085701, 2008.
- [2] O. L. Alerhand, D. Vanderbilt, R. D. Meade, and J. D. Joannopoulos. Phys. Rev. Lett., 61:1973, 1988.
- [3] J. de la Figuera, F. Léonard, N. C. Bartelt, R. Stumpf, and K. F. McCarty. Phys. Rev. Lett., 100:186102, 2008.
- [4] T. O. Menteş, N. Stojić, A. Locatelli, L. Aballe, N. Binggeli, M. A. Niño, M. Kiskinova, and E. Bauer. EPL, 94:38003, 2011.
- [5] R. van Gastel, R. Plass, N. C. Bartelt, and G. L. Kellogg. Phys. Rev. Lett., 91:055503, 2003.
- [6] K. Kern, H. Niehus, A. Schatz, P. Zeppenfeld, J. Goerge, and G. Comsa. Phys. Rev. Lett., 67:855, 1991.
- [7] H. Ellmer, V. Repain, S. Rousset, B. Croset, M. Sotto, and P. Zeppenfeld. Surf. Sci., 476:95, 2001.
- [8] H. Ibach, Surf. Sci. Rep. 29:195, 1997; ibid. 35:71, 1999.
- [9] P. Müller and A. Saúl. Elastic effects on surface physics. Surf. Sci. Rep., 54(5–8):157 – 258, 2004.
- [10] D. Sander, Z. Tian, and J. Kirschner. J. Phys.: Condens. Matter, 41:775, 2009.
- [11] N. Stojić and N. Binggeli. J. Phys.: Condens. Matter, 24:135001, 2012.
- [12] W. Schlenk and E. Bauer. Surf. Sci., 93:9, 1980.
- [13] Y. F. Gao, W. Lu, and Z. Suo. Acta Mater., 50:2297, 2002.
- [14] B. Santos, J. M. Puerta, J. I. Cerda, T. Herranz, K. F. McCarty, and J. de la Figuera. New J. Phys., 12(2):023023, 2010.
- [15] D. M. Riffe, N. D. Shinn, B. Kim, K. J. Kim, and T.-H. Kang. Surf. Sci., 603:1070, 2009.
- [16] L. Aballe, A. Barinov, A. Locatelli, S. Heun, S. Cherifi, and M. Kiskinova. Appl. Surf. Sci., 238:138, 2004.
- [17] B. Bolding and E. A. Carter. Phys. Rev. B, 44:3251, 1991.
- [18] Nikolai J. Georgiev, ”LEED-Diffractometry of Phase Transitions”, Ph.D. thesis, TU Clausthal (1996).
- [19] A. Locatelli, L. Aballe, T. O. Menteş, M. Kiskinova, and E. Bauer. Surf. Interface Anal., 38:1554, 2006.
- [20] E. Bauer. Surf. Rev. Lett., 5:1275, 1998.
- [21] P. Giannozzi et al. J. Phys.: Condens. Matter, 21:395502, 2009.
- [22] J. P. Perdew and A. Zunger. Phys. Rev. B, 23:5048, 1981.
- [23] D. Vanderbilt. Phys. Rev. B, 41:7892, 1990.
- [24] H. J. Monkhorst and J. D. Pack. Phys. Rev. B, 13:5188, 1976.
- [25] O. H. Nielsen and R. M. Martin. Phys. Rev. Lett., 50:697, 1983.
- [26] T. O. Menteş, N. Stojić, N. Binggeli, M. A. Niño, A. Locatelli, L. Aballe, M. Kiskinova, and E. Bauer. Phys. Rev. B, 77:155414, 2008.
- [27] The onset of the transition towards the pseudomorphic structure is determined by fitting a constant function, in the range of smaller coverages, and the function , for larger coverages, to the period vs coverage curve in figure 1. The constant, parameter and the kink point at which the two ranges of the functions meet are used as free parameters. The latter is taken as the transition coverage.
- [28] Ruqian Wu and A. J. Freeman. Phys. Rev. B, 52:12419–12425, Oct 1995.
- [29] R. Wu, L.-J. Chen, and N. Kioussis. Chem. Phys. Lett., 258:228, 1996.
- [30] The interlayer distances are similar for the H site: % and %.
- [31] B. N. J. Persson. Surf. Sci. Rep., 15:1, 1992.
- [32] We note that in our systems the degrees of freedom of the particles to be considered for the energy normalization when comparing to the thermal energy are those of the Pd atoms (as opposed to those of the vacancy/defect). In fact, all Pd atoms in the unit cell relax differently and participate in the structural rearrangement of the Pd overlayer upon creation of the vacancy lines (see end of Section IV B).
- [33] An estimated energy decrease by 11 meV/(11) is obtained by moving the Pd atoms adjacent to the central vacancy line in figure 7 from the distance found in the Rv 6:5 (Lv 6:5) structure (with relaxed position) to the distance in the RvLv 12:10 structure, with all other atomic positions frozen in the relaxed RvLv 12:10 configuration. The estimate of 11 meV, obtained by considering only the effect of displacement of the Pd atoms adjacent to the central vacancy line, is about half of the total energy difference between the Rv and RvLv structures (23 meV/(1)).
- [34] John E. Northrup, M. C. Schabel, C. J. Karlsson, and R. I. G. Uhrberg. Phys. Rev. B, 44:13799–13802, Dec 1991.
- [35] E. Bauer and Jan H. van der Merwe. Phys. Rev. B, 33(6):3657–3671, Mar 1986.
- [36] X. Chen, F. Wu, Z. Zhang, and M. G. Lagally. Phys. Rev. Lett., 73:850–853, Aug 1994.
- [37] H. J. W. Zandvliet, H. K. Louwsma, P. E. Hegeman, and Bene Poelsema. Phys. Rev. Lett., 75:3890–3893, Nov 1995.
- [38] D. Sander, C. Schmidthals, A. Enders, and J. Kirschner. Phys. Rev. B, 57:1406, 1998.
- [39] D. Sander, A. Enders, and J. Kirschner. Europhys. Lett., 45:208, 1999.
- [40] H. L. Meyerheim, D. Sander, R. Popescu, J. Kirschner, O. Robach, S. Ferrer, and P. Steadman. Phys. Rev. B, 67:155422, 2003.
- [41] S. Olivier, G. Tréglia, A. Saúl, and F. Willaime. Surf. Sci., 600(24):5131 – 5135, 2006.
- [42] Although the exact Poisson ratio is unknown for this surface, we can speculate that it is most likely indeed positive based on the fact that it has a regular atomic structure (most of the systems with negative/anomalous Poisson ratio have complicated structures due to their uniquely oriented molecular orbitals) and on its behavior perpendicular to the surface: we note that the contraction of the Pd adlayer perpendicular to the slab is largest for small periodicities (largest strain) and is decreasing towards larger periodicities and the PS structure, as shown in Fig. S3(a), and as expected for positive Poisson ratio.
- [43] N. Stojić, T. O. Menteş, N. Binggeli, M. A. Niño, A. Locatelli, and E. Bauer. Phys. Rev. B, 81:115437, 2010.
- [44] R. van Gastel, N. C. Bartelt, P. J. Feibelman, F. Léonard, and G. L. Kellogg. Phys. Rev. B, 70:245413, 2004.
- [45] B. Croset, Y. Girard, G. Prévot, M. Sotto, Y. Garreau, R. Pinchaux, and M. Sauvage-Simkin. Measuring surface stress discontinuities in self-organized systems with x rays. Phys. Rev. Lett., 88:056103, Jan 2002.