Evolution of the atomic and molecular gas content of galaxies
Abstract
We study the evolution of atomic and molecular gas in galaxies in semi-analytic models of galaxy formation that include new modeling of the partitioning of cold gas in galactic discs into atomic, molecular, and ionised phases. We adopt two scenarios for the formation of molecules: one pressure-based and one metallicity-based. We find that both recipes successfully reproduce the gas fractions and gas-to-stellar mass ratios of Hi and H2 in local galaxies, as well as the Hi and H2 disc sizes up to . We reach good agreement with the locally observed Hi and H2 mass function, although both recipes slightly overpredict the low-mass end of the Hi mass function. Both of our models predict that the high-mass end of the Hi mass function remains nearly constant at redshifts . The metallicity-based recipe yields a higher cosmic density of cold gas and much lower cosmic H2 fraction over the entire redshift range probed than the pressure based recipe. These strong differences in Hi mass function and cosmic density between the two recipes are driven by low mass galaxies () residing in low mass halos (). Both recipes predict that galaxy gas fractions remain high from and drop rapidly at lower redshift. The galaxy H2 fractions show a similar trend, but drop even more rapidly. We provide predictions for the CO luminosity of galaxies, which will be directly comparable with observations with sub-mm and radio instruments.
keywords:
galaxies: formation - galaxies: evolution - galaxies: ISM - ISM: atoms - ISM: molecules1 Introduction
Attaining an understanding of when, how, and at what rate stars form out of interstellar gas, and of the mechanisms that regulate this process, is of key importance in building up a complete picture of galaxy formation and evolution. Observations across a range of scales have shown that star-formation (SF) is tightly linked to galaxy gas content. Observations in our Milky Way have shown that star formation takes place in dense giant molecular clouds (GMC; e.g., Solomon et al., 1987; McKee & Ostriker, 2007; Bolatto et al., 2008). Early observational work found a correlation between the surface density of the star formation rate (SFR) and the surface density of the total cold gas in galaxies (e.g. Schmidt, 1959; Kennicutt, 1998), while more recent work has emphasized that there is a strong correlation between the SFR density and the density of molecular hydrogen (H2), while the correlation with atomic hydrogen (Hi) is weak or absent (Wong & Blitz, 2002; Bigiel et al., 2008, 2011; Schruba et al., 2011). This work has stimulated a desire to understand and track the Hi and H2 content of galaxies separately in theoretical models.
Observational studies of the Hi and H2 content of nearby galaxies have made great advances in recent years. The local Hi mass function down to masses of , and global Hi density , has been quantified by blind surveys such as ALFALFA (Giovanelli et al., 2005; Martin et al., 2010). The Hi content and its relationship with other galaxy properties (such as stellar mass, stellar surface density, color, and concentration) have been quantified for a fairly large, homogeneously selected sample of nearby galaxies by GASS (Galex Arecibo SDSS survey: Catinella et al., 2010, 2012, 2013). The THINGS (The Hi nearby galaxy survey: Walter et al., 2008) and LITTLE THINGS (Hunter et al., 2012) surveys mapped the atomic hydrogen density distribution in small samples of nearby galaxies.
The molecular hydrogen content of galaxies has most commonly been studied through emission from 12CO (from here on CO) as a tracer. The CO mass-function of nearby galaxies was presented by Keres, Yun & Young (2003), along with an estimate of the H2 mass-function resulting from the application of a constant conversion factor between CO luminosity and H2 mass. An updated estimate of the H2 mass function from the Keres, Yun & Young (2003) sample, based on an empirical, and variable, CO-H2 conversion factor, was presented by Obreschkow & Rawlings (2009b). The BIMA SONG (BIMA survey of nearby galaxies: Helfer et al., 2003), HERACLES (HERA CO-Line Extragalactic Survey: Leroy et al., 2009) and COLD GASS (CO legacy database for GASS: Saintonge et al., 2011) surveys mapped the CO-emitting gas in galaxies of the THINGS and GASS surveys, constraining the surface densities and gas-to-star ratios of molecular gas.
Observations of atomic hydrogen in emission have up until now been restricted to galaxies at redshifts of (Verheijen et al., 2007; Catinella et al., 2008). Damped Lyman- absorbers (DLA) have provided estimates of the global atomic gas content of the Universe () at much higher redshifts (; e.g., Rao, Turnshek & Nestor, 2006; Prochaska & Wolfe, 2009; Noterdaeme et al., 2012), but the exact nature of these systems, and their connection to galaxies detected in emission, is still unclear, making the interpretation of these observations somewhat complicated (Berry et al., 2013).
Direct observations of the molecular content of distant galaxies through the CO line have recently become available for small samples of objects, although these samples are usually biased towards the most gas-rich, actively star-forming galaxies (e.g. Genzel et al., 2010; Tacconi et al., 2010; Riechers et al., 2011; Bothwell et al., 2013; Tacconi et al., 2013). Although results are still inconclusive because of the small and potentially biased nature of the samples, and uncertainties in the H2-CO conversion factor, these studies suggest that galaxies at high redshift may have been considerably more rich in H2 than nearby galaxies. Moreover, a tight relationship between H2 surface density and SFR density seems to persist out to at least (Genzel et al., 2010; Daddi et al., 2010).
The gas content of galaxies at high redshift has also been estimated using more indirect methods, such as by using Far-Infrared (FIR) observations and an assumed relationship between dust and H2 mass (Magdis et al., 2012), or by using an empirical relationship between SFR density and total gas or H2 content along with SF tracers such as H- or UV (Erb et al., 2006; Mannucci et al., 2009; Popping et al., 2012).
All of the above efforts have already led to extremely valuable insights and constraints on galaxy formation models. However, our ability to measure Hi and CO in emission, in unbiased samples of galaxies out to high redshift, is expected to undergo a revolution in the next decade, with new and upcoming facilities such as the Atacama Large Millimeter Array (ALMA; Wootten & Thompson, 2009) and the Square Kilometer Array (SKA; Carilli & Rawlings, 2004) and its pathfinders the Karoo Array Telescope (MeerKAT; Booth et al., 2009) and the Australian SKA Pathfinder (ASKAP; Johnston et al., 2008) coming online.
The observations expected from these facilities present a new and stringent challenge to theoretical models of galaxy formation. Until recently, most cosmological models and simulations of galaxy formation did not attempt to ‘partition’ gas into different phases, and used a total-gas based (Hi +H2) Kennicutt-Schmidt (KS) law to model star formation. However, aided by the insights gained from studies of the relationship between star formation and gas properties on kpc scales (e.g. Bigiel et al., 2008; Leroy et al., 2008) in external galaxies, theorists have also made considerable progress on developing physical models linking the efficiency of star formation on GMC scales with that on galactic scales. Several groups have implemented explicit modeling of detailed chemistry and simplified radiative transfer into galaxy-scale and cosmological numerical hydrodynamic simulations, tracking the multi-phase gas content and implementing H2-based star formation prescriptions (e.g. Pelupessy, Papadopoulos & van der Werf, 2006; Robertson & Kravtsov, 2008; Gnedin & Kravtsov, 2011; Christensen et al., 2012; Kuhlen et al., 2012). Gnedin & Kravtsov (2011, hereafter GK) presented fitting functions for the SFR in their simulations as a function of total cold gas density (), gas phase metallicity, and the intensity of the UV ionizing background. Krumholz, McKee & Tumlinson (2009) presented analytic models for the formation of H2 as a function of total gas density and metallicity, supported by numerical simulations with simplified geometries (Krumholz, McKee & Tumlinson, 2008, 2009), emphasizing the importance of metallicity as a controlling parameter in H2 formation. A somewhat different view is presented by Ostriker, McKee & Leroy (2010), who propose that heating of the Interstellar Medium (ISM) by the stellar UV background plays a key role in regulating star formation. In their model, the thermal pressure in the diffuse ISM, which is proportional to the UV heating rate, adjusts until it balances the midplane pressure set by the vertical gravitational potential. This could provide an explanation for the strong empirical correlation between H2 fraction and disc midplane pressure found by Blitz & Rosolowsky (2006).
These analytic models and fitting formulae can be implemented within semi-analytic models of galaxy formation. The modern semi-analytic approach applies simple, physically motivated recipes for physical processes that drive the formation and evolution of galaxies within the framework of a cold dark matter (CDM) cosmology. These models can provide predictions of global galaxy properties (such as SFR, size, stellar mass and luminosity, gas content, metal enrichment) for large numbers of galaxies. Furthermore, they can efficiently explore the parameter space associated with the large number of “sub-grid” recipes that are used to model processes such as star formation, stellar feedback, black hole accretion and feedback from Active Galactic Nuclei (AGN). Semi-analytic models have been successful in reproducing many observed galaxy properties (e.g., Kauffmann, White & Guiderdoni, 1993; Cole et al., 1994; Kauffmann et al., 1999; Somerville & Primack, 1999; Cole et al., 2000; Somerville, Primack & Faber, 2001), in particular recent models that include ‘radio mode’ AGN feedback (e.g., Bower et al., 2006; Croton et al., 2006; Kang, Jing & Silk, 2006; Menci et al., 2006; Monaco, Fontanot & Taffoni, 2007; Somerville et al., 2008b), although some puzzles remain. For example, SAMs from several different groups do not correctly reproduce the observed properties of low-mass galaxies ( Fontanot et al., 2009; Guo et al., 2010; Weinmann et al., 2012). These low-mass galaxies form too early in the models, and are too passive at late times. On the other hand, SAMs have also had difficulty reproducing enough very rapidly star forming, extreme starbursts (Ultra-luminous Infrared Galaxies; ULIRGS) at high redshift (Somerville et al., 2012; Niemi et al., 2012, and references therein). However, numerical hydrodynamic simulations suffer from the same problems (Weinmann et al., 2012; Davé et al., 2010), and in fact produce very similar predictions to the SAMs, leading most theorists to conclude that it is likely to be limitations in our understanding of the sub-grid processes of star formation and stellar feedback, rather than inaccuracies of the semi-analytic approach, that are the root cause of the problems.
Several groups have now used semi-analytic models to make predictions for the multi-phase gas content of galaxies. Obreschkow et al. (2009a) applied an empirical pressure-based recipe based on the results of Blitz & Rosolowsky (2006, hereafter BR) in post-processing to compute the Hi and H2 content of galaxies in the Millennium simulations (De Lucia & Blaizot, 2007). Power, Baugh & Lacey (2010) carried out a similar project based on post-processing. Fu et al. (2010, 2012) modeled the partitioning of gas into Hi and H2 in radial bins in each galaxy, using both the metallicity-dependent recipes of Krumholz, McKee & Tumlinson (2009, hereafter KMT) and the pressure-based recipe of BR, and self-consistently implemented a H2-based star formation recipe, within the established semi-analytic modeling framework of Guo et al. (2011). Lagos et al. (2011a, b) also estimated gas partitioning into an atomic and molecular component, and implemented a H2-based star formation recipe, within the GALFORM semi-analytic model (Baugh et al., 2005; Bower et al., 2006). Somewhat simpler models in a similar spirit have also been presented by Dutton, van den Bosch & Dekel (2010) and Krumholz & Dekel (2012).
In this paper we explore how different models for H2 formation affect the evolution of the atomic and molecular gas content of galaxies with time. We implement an empirical, pressure-based recipe (BR) and a recipe based on numerical hydrodynamic simulations, dependent on metallicity and the local UV radiation field (GK) into the Somerville et al. (2012) model, thus allowing a link to be made between the stellar and dust emission and the multi-phase gas content of galaxies. We anticipate that these predictions will be useful for planning upcoming observations of cold gas in galaxies at high redshift, and as these observations become available, this will provide insights into the physics that drives the formation of molecules in galaxies. Furthermore, we aim to give insight to what improvements need to be incorporated in cosmological galaxy evolution models to correctly model the gas content of galaxies. In Somerville, Popping & Trager (in prep.; SPT14) we implement a wider suit of star-formation and H2 recipes including the KMT recipe. We will present predictions for the observable properties of the stellar (and dust) emission over a broad range of redshifts, and discuss the sensitivity of these properties to the adopted SF-recipes.
The structure of the paper is as follows. In Section 2 we briefly present the semi-analytic model and its ingredients, focussing on the new recipes for gas partitioning and star formation. In Section 3 we present our predictions for the scaling relations between stellar mass or surface density and Hi and H2 content, relationship between Hi mass and radius, and Hi and H2 mass functions at . We further present predictions for the evolution in the SFR half-light radius vs. stellar mass, Hi and H2 mass functions, global mass density of Hi and H2, and Hi and H2 fractions vs. stellar mass. We compare our predictions of H2 fractions and mass functions with observational estimates of these quantities obtained by applying a CO-H2 conversion factor to the observations; we also adopt an alternate approach in which we use our knowledge of the physical properties of our model galaxies to estimate the CO content, and compare directly with the CO observations. In Section 4 we discuss our findings and we summarize those in Section 5.
2 Model
This section describes the semi-analytic model used in this paper. The model is based on the models presented in Somerville & Primack (1999), Somerville et al. (2008b), and Somerville et al. (2012) and we refer the reader to those papers for details. In this section we provide a brief summary of the model framework and the ingredients relevant to this paper. Throughout this paper we adopt a flat CDM cosmology with and a cosmic baryon fraction of (Komatsu et al., 2009). Unless stated otherwise we leave the free parameters associated with the galaxy-formation model fixed to the values given in Somerville et al. (2012).
2.1 Semi-analytic model framework
The merging histories of dark matter halos (merger trees) are constructed based on the Extended Press-Schechter formalism following the method described in Somerville & Kolatt (1999) and Somerville et al. (2008b). Each branch in the tree represents a merger event and is followed back in time to a minimum progenitor mass of , which we refer to as the mass resolution of our simulations.
Whenever dark matter halos merge, the central galaxy of the largest progenitor halo becomes the new central galaxy, whereas all the other galaxies become ‘satellites’. Satellite galaxies may eventually merge with the central galaxy due to dynamical friction. Merger timescale are estimated using a variant of the Chandrasekhar formula from Boylan-Kolchin, Ma & Quataert (2008). Tidal stripping and destruction of the satellites is included as described in Somerville et al. (2008b).
Before reionisation of the Universe, each halo contains a mass of hot gas equal to the universal baryon fraction times the virial mass of the halo. After reionisation, the collapse of gas into low-mass halos is suppressed by the photoionising background. We model the fraction of baryons that can collapse into halos of a given mass after reionisation using the fitting functions provided by Gnedin (2000) and Kravtsov et al. (2004).
When a dark matter halo collapses or experiences a merger with a larger halo, the hot gas shock-heats to the virial temperature of the new halo. The radiating gas then gradually cools and collapses. To calculate the cooling rate of the hot gas we use the metallicity-dependent radiative cooling curves of Sutherland & Dopita (1993). The rate at which gas can cool is given by
| (1) |
where is the mass of the hot halo gas, is the virial radius of the dark matter halo, and is the radius within which all of the gas can cool in a time , which itself depends on density, metallicity and temperature. This cooling radius limited regime is associated with “hot flows”. In some cases the cooling radius can be larger than the virial radius. In this case the cooling rate is limited by the infall rate
| (2) |
This infall limited cooling regime is associated with “cold flows” (Birnboim & Dekel, 2003; Kereš et al., 2005; Dekel & Birnboim, 2006).
Although in reality satellite galaxies should continue to accrete some cold gas, we assume that the cold gas is only accreted by the central galaxy of the halo. When the gas cools we assume it initially collapses to form a rotationally supported disc. The scale radius of the disc is computed based on the initial angular momentum of the gas and the halo profile, assuming that angular momentum is conserved and that the self-gravity of the collapsing baryons causes contraction of the matter in the inner part of the halo (Blumenthal et al., 1986; Flores et al., 1993; Mo, Mao & White, 1998). Assuming that the halo initially has a density profile described by the Navarro-Frank-White (NFW; Navarro, Frenk & White, 1996) form, the size of the gas disc of a galaxy is given by
| (3) |
where is the ratio of the specific angular momentum of the disc and the halo, is the NFW concentration of the halo, and is the disc mass to the halo mass ratio. The functions correct for the difference in energy of the NFW profile relative to that of a singular isothermal profile, and accounts for the adiabatic contraction (see Mo, Mao & White, 1998, for expressions governing and ). Somerville et al. (2008a) showed that this approach produced good agreement with the evolution of the size-stellar mass relation for disc-dominated galaxies from to the present.
Stars are formed through two modes, a “normal” mode in isolated discs, and a merger-driven “starburst” mode. We discuss star formation in the “normal” mode in below Section 2.2. The efficiency and timescale of the “starburst” mode is set by the merger mass ratio and the gas fractions of the merger progenitors, based on the results of hydrodynamical simulations of binary galaxies (Robertson et al., 2006; Hopkins et al., 2009a).
When supernovae occur, they deposit some of their energy into the ISM, driving a large-scale outflow of cold gas from the galaxy. The mass outflow rate is given by
| (4) |
where is the maximum circular velocity of the galaxy (here approximated by of the uncontracted dark matter halo), is the star formation rate, and and are free parameters ( km/s is an arbitrary normalization constant). Some fraction of the ejected gas escapes from the potential of the dark matter halo, whereas some is deposited in the hot gas reservoir within the halo and can cool again. The fraction of gas ejected from the disc and halo versus ejected from the disc but retained in the halo is a function of the halo circular velocity, such that low-mass halos lose a larger fraction of gas (see Somerville et al. (2008b) for details). We choose and (similar to previous works) to obtain a good match with the observed stellar mass function.
Each generation of stars produces heavy elements that can enhance the metal content of a galaxy. Here, chemical enrichment is modelled in a simple manner using the instantaneous recycling approximation. For each parcel of new stars , we also create a mass of metals , which we assume to be instantaneously mixed with the cold gas in the disc. We assume the yield to be constant, and treat it as a free parameter. When supernova driven winds eject gas from the disc, a corresponding proportion of metals is also removed and deposited either in the hot gas or outside the halo, following the same proportions as the ejected gas.
Mergers can remove angular momentum from the disc stars and build up a spheroid. The efficiency of disc destruction and build up of spheroids is a function of progenitor merger mass ratio and gas fractions, parameterised based on the simulations of binary galaxy systems (Hopkins et al., 2009a). These simulations indicate that more “major” and more gas-poor mergers are more efficient in removing angular momentum, destroying discs, and building spheroids. When implemented within the SAM, these recipes correctly predict the relative fractions of early vs. late type galaxies as a function of stellar mass (Hopkins et al., 2009b).
The model tracks the growth of supermassive black holes and the energy they release (Croton et al., 2006; Somerville et al., 2008b). Each top-level DM halo is seeded with a black hole, and these black holes are able to grow via two different accretion modes. The first accretion mode is fueled by cold gas that is driven into the nucleus of the galaxy by mergers. This mode is radiatively efficient, and the accretion rates are close to the Eddington limit. The accretion continues until the energy being deposited into the ISM in the central region of the galaxy is sufficient to significantly offset and halt accretion via a pressure-drive outflow. Because this accretion mode is associated with optically bright classical quasars and AGN, it is sometimes referred to as “bright mode” or “quasar mode” accretion. The second mode of black hole growth, the “radio mode”, is thought to be associated with powerful jets observed at radio frequencies. Hot halo gas is assumed to be accreted according to the Bondi-Hoyle approximation (Bondi, 1952). We adjust the efficiency of “radio mode” heating to fit the observed number density of massive galaxies, and obtain ). Accretion rates in this mode are significantly sub-Eddington ( to times the Eddington rate), so that most of the BH’s mass is acquired during “bright mode” accretion. However, the radio jets are assumed to couple very efficiently with the hot gas, and provide a heating term that can partially or completely offset cooling during the “hot flow” mode.
2.2 Multi-phase Gas Partitioning and Star Formation Recipes
In this section we describe the new ingredients of our model that we use to calculate the fraction of ionised, atomic, and molecular gas in each galaxy, and how we compute the SFR based on the molecular gas content.
At each time step we compute the scale radius of the cold gas disc using the angular momentum argument described in the previous subsection. We assume that the cold gas is distributed in an exponential disc with scale radius and a central gas surface density of , where is the mass of all cold gas in the disc. We assume that the stellar scale length is defined as , with fixed to match stellar scale lengths at . We divide the gas disc into radial annuli and compute the fraction of molecular gas in each annulus as described below. The integrated mass of Hi and H2 in the disc at each time step is calculated using a fifth order Runga-Kutta integration scheme.
2.2.1 Ionised gas
We assume that the cold gas consists of an ionised, atomic and molecular component. The ionised component may be due to either an external background or by the radiation field from stars within the galaxy. We assume that some fraction of the cold gas in the galaxy, , is ionised by the stars in the galaxy. The external background field ionises of a slab of gas on each side of the disc. Following Gnedin (2012), and assuming that all the gas with a surface density below some critical value is ionised, we use
| (5) |
Throughout this paper we assume (as in the Milky Way) and , supported by the results of Gnedin (2012). Although observations do not support a sharp transition to ionized gas at this surface density, we found that our model reproduced the results of the hydro simulations well with this choice of parameters.
2.2.2 Molecular gas: pressure based partitioning
In this work we consider two approaches for calculating the molecular fraction of the cold neutral gas in a galaxy. The first is based on the empirical pressure-based recipe presented by Blitz & Rosolowsky (2006, BR). They found a power-law relation between the disc mid-plane pressure and the ratio between molecular and atomic hydrogen, i.e.,
| (6) |
where and are the H2 and Hi surface density, and are free parameters that are obtained from a fit to the observational data, and the mid-plane pressure acting on the galactic disc. We adopted cm3 K and from Leroy et al. (2008). The hydrostatic pressure acting on the disc at a radius is estimated as (Elmegreen, 1989, 1993; Fu et al., 2010)
| (7) |
where G is the gravitational constant, is the ratio between and , the gas and stellar vertical velocity dispersion, respectively. The stellar surface density profile is modeled as an exponential with scale radius and central density . Following Fu et al. (2010), we adopt , based on empirical scalings for nearby disc galaxies. The fraction of non-ionized gas in a molecular state at each radial annulus can be calculated as .
2.2.3 Molecular gas: metallicity based partitioning
The second approach for computing molecular gas fractions in galaxies is based on the simulation by Gnedin & Kravtsov (2011, GK), who performed high-resolution “zoom-in” cosmological simulations with the Adaptive Refinement Tree (ART) code of Kravtsov (1999), including gravity, hydrodynamics, non-equilibrium chemistry, and 3D on the fly radiative transfer. Based on their simulations, the authors find a fitting function for the H2 fraction which effectively parameterizes as a function of dust-to-gas ratio relative to the Milky Way, , the UV ionizing background relative to the Milky Way, , and the neutral gas surface density . The fraction of molecular hydrogen at each radial annulus is given by
| (8) |
where
We take the dust-to-gas ratio to be proportional to the metallicity in solar units . The local UV background relative to the MW is set by relating the SFR of the galaxy in the previous time step to the MW SFR as , where we choose (Murray & Rahman, 2010; Robitaille & Whitney, 2010).
The GK fitting functions are intended to characterize the formation of molecular hydrogen on dust grains, the dominant mechanism for forming H2 once gas is enriched to more than a few hundredths of Solar metallicity. Other channels for the formation of H2 in primordial gas must be responsible for producing the molecular hydrogen out of which the first stars were formed. Hydrodynamic simulations containing detailed chemical networks and analytic calculations have shown that H2 can form through other channels in dark matter halos above a critical mass (e.g., Nakamura & Umemura, 2001; Glover, 2013). This gas can then form “Pop III” stars which can enrich the surrounding ISM to (Schneider et al., 2002; Greif et al., 2010; Wise et al., 2012). These processes take place in halos much smaller than our resolution limit. We represent them by setting a “floor” to the molecular hydrogen fraction in our halos, . In addition, we “pre-enrich” the initial hot gas in halos, and the gas accreted onto halos due to cosmological infall, to a metallicity of . We adopt typical values of and (Haiman, Rees & Loeb, 1996; Bromm & Larson, 2004). We find that our results are not sensitive to the adopted values of these parameters within reasonable limits. Note that observations of resolved stars in the MW halo and local dwarfs have revealed stars with metallicities below (Tolstoy, Hill & Tosi, 2009; Starkenburg et al., 2010), precluding much higher values for .
2.2.4 Molecular based star formation
Star formation is modeled following empirical relationships from recent observations. Bigiel et al. (2008) suggest, based on observations of spiral galaxies from the THINGS survey, that the star-formation rate surface density can be directly related to the surface density of molecular gas, i.e.
| (9) |
with . Observations of higher density environments suggest that above some critical H2 surface density, the slope of the relation described in equation 9 steepens. We therefore adopt a two-part scaling law given by:
| (10) |
We adopt the “two-slope” star formation recipe in all of the models presented in this work. In addition, we adopt , pc-2, and . The value of is taken from the observations of Bigiel et al. (2008), corrected to our system in which Helium is not included in the gas masses and densities. The values for and are motivated by the observational compilation presented in Narayanan et al. (2012).
3 Results
In this section we show our predictions for the evolution of the Hi and H2 content of galaxies over a range of redshifts from to . The simulations were run on a grid of halos with virial masses ranging from to with a mass resolution of . We first perform a comparison of our model predictions with observations of local galaxy properties, in order to validate our models. All presented gas masses are pure hydrogen masses and do not include a correction for Helium.
3.1 Local galaxy properties
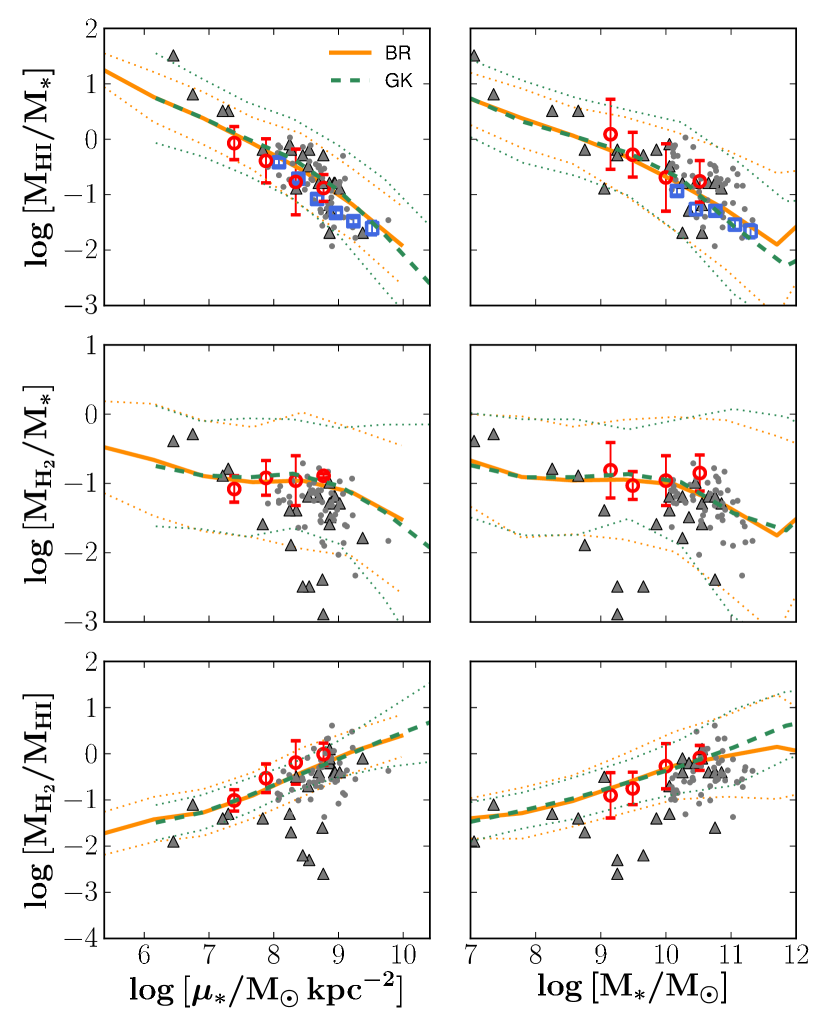
In Figure 1 we present the ratios of Hi and H2 relative to stellar mass, and the ratio of H2 to Hi, as functions of stellar mass and stellar surface density in disc-dominated galaxies (). We compare our results to a compilation of observations presented in Leroy et al. (2008), Saintonge et al. (2011), and Catinella et al. (2013) based on the THINGS+HERACLES and GASS+COLDGASS surveys and in Boselli et al. (2014) based on the Herschel reference survey.
Both the pressure-based and metallicity-based recipes show very good agreement with the observed trends between stellar mass or stellar surface density and Hi and H2 fractions. The fraction of Hi relative to stars decreases with increasing stellar mass and surface density, whereas the fraction of H2 relative to stars remains roughly constant. Consequently, the fraction of cold gas in the form of H2 increases with stellar mass and surface density. The H2-to-Hi ratio as a function of stellar mass is on average slightly too high in our models, although still within the scatter of the observations (particularly at low stellar masses). Here we focus on the gas fractions of disc-dominated galaxies. A similar exercise for a “blind” survey of galaxies would yield lower Hi-to-stellar mass, H2-to-stellar mass, and H2-to-Hi mass ratios. Spheroidal objects have much lower relative gas content than disc-dominated galaxies and most of the cold gas is atomic.
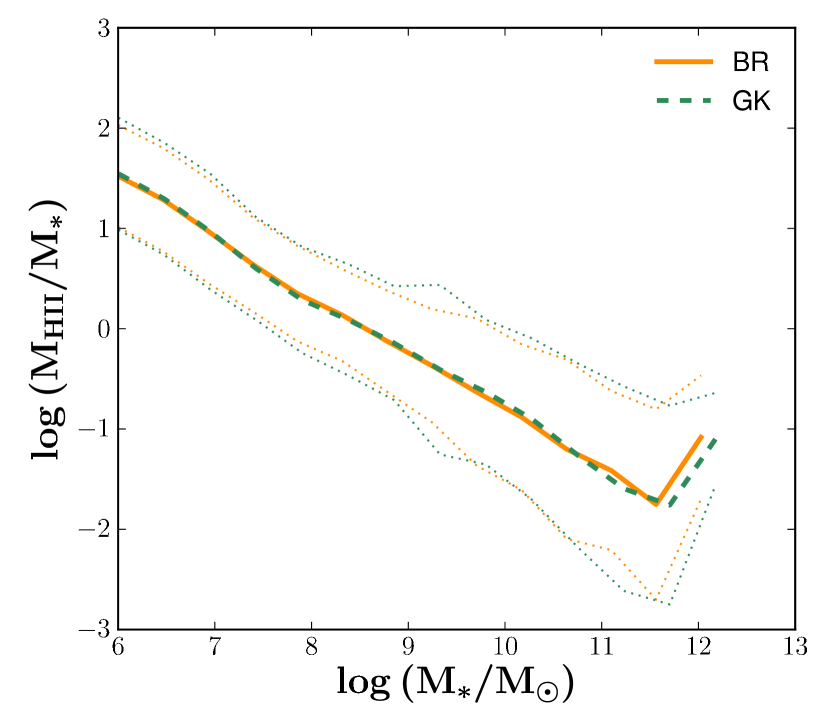
We present the ratio of ionised hydrogen to galaxy stellar mass as a function of stellar mass in Figure 2. We find a monotonic decrease in the ratio between ionised hydrogen and stellar mass, without any significant difference between the two H2 formation recipes. The ionised hydrogen mass ranges from about a tenth of the stellar mass in large galaxies, to about equal to the stellar mass in low mass objects (), and up to 10-100 times the stellar mass in very low mass galaxies (). These ratios are comparable to the ratio between galaxy Hi and stellar mass, indicating that a significant amount of the cold gas in galaxies may be in an ionised component, as suggested by recent observations (Tumlinson et al., 2011), but not accounted for in previous semi-analytic models of galaxy formation. We will further explore the predictions for ionised hydrogen in galaxies in future work.
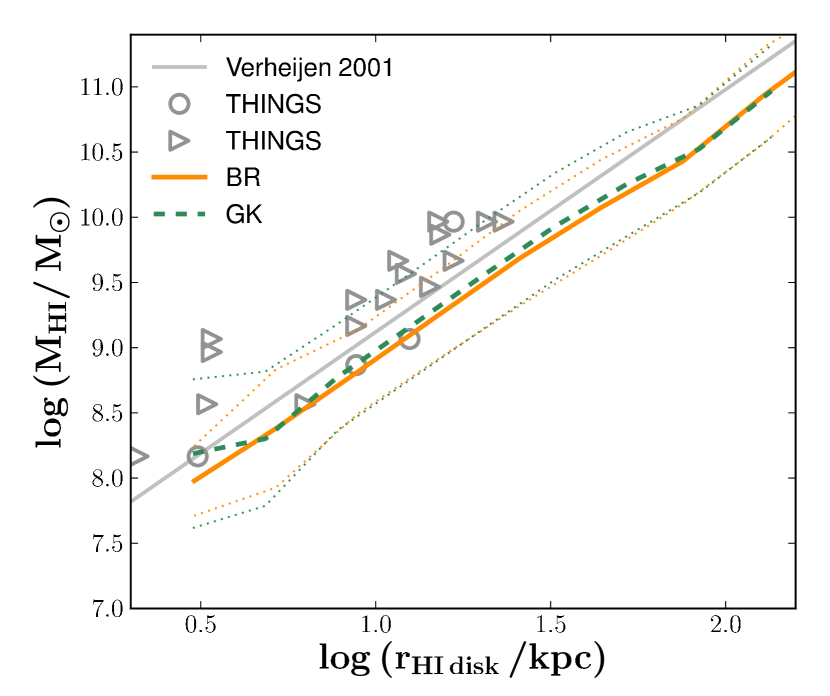
Both H2 recipes presented in this work rely on the estimated size of the galaxy disc, as this sets the surface density of the gas, one of the key parameters in calculating the H2 content of the gas. It is therefore of great importance to correctly predict the sizes of the gas disc in galaxies. Figure 3 shows the Hi disc size of a galaxy as a function of its Hi mass. Following Verheijen & Sancisi (2001), we define the size of the Hi disc as the radius at which the Hi surface density of the gas equals . We calculate the location of in post-processing, assuming an exponential distribution of the cold gas in the disc. Besides the fit presented in Verheijen & Sancisi (2001), we also present, where possible, the size of the Hi discs of the THINGS sample of galaxies, which we computed from the radial profiles presented in (Leroy et al., 2008).
There is good agreement between the modeled and observed Hi disc sizes, spanning over three orders of magnitude in Hi mass and two orders of magnitude in disc size. The good agreement between model and data is independent of the H2 formation prescription. We have shown that our models match the observed H2 fractions for nearby galaxies (Fig. 1), and Somerville et al. (2008a) has shown previously that the models also reproduce the size-stellar mass relation for disc-dominated galaxies from to the present. Although this does not necessarily guarantee a match between the Hi disc size and gas content of a galaxy, the agreement is an encouraging sanity check.
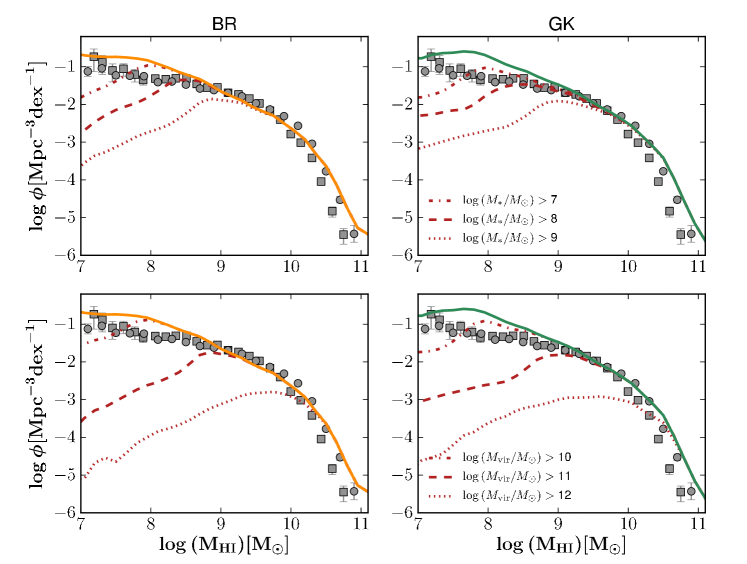
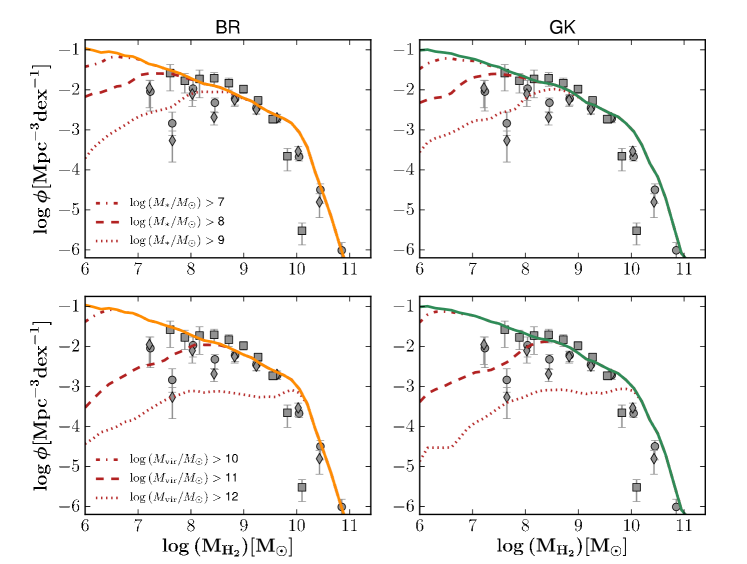
Figure 4 shows our predictions for the Hi mass-functions at . Both star formation recipes show decent agreement with the observed Hi mass functions at Hi masses of and higher. The pressure-based recipe slightly underpredicts the observed Hi mass function in the mass range , and slightly overpredicts the observations at lower Hi masses. The metallicity-based recipe overpredicts the observed number of galaxies below .
Figure 4 shows that the galaxies responsible for the excess of low-Hi mass objects are low-mass galaxies () residing in low mass halos (). This underlines the importance of sufficiently high mass resolution in simulations that attempt to predict the properties of galaxies observed in Hi.
The predicted H2 mass function at is presented in Figure 5, and compared with two observational estimates. Both estimates are based on the CO survey of Keres, Yun & Young (2003). The estimated H2 mass function given by Keres, Yun & Young (2003) was obtained by applying a fixed conversion factor to convert between CO and H2. Obreschkow & Rawlings (2009b) estimated a variable H2-CO conversion factor based on the galaxy properties. Based on recent observations and theoretical work, a variable conversion factor that depends on galaxy properties (such as metallicity) is probably more reasonable (we discuss this further below). The predictions of both recipes are very similar, and we obtain good agreement with the observational estimates of Keres, Yun & Young (2003), but significantly overproduce galaxies with large H2 masses relative to the Obreschkow & Rawlings (2009b) results. It is possible that a process not included in our model, such as AGN feedback, could destroy or expel H2 in massive galaxies (Saintonge et al., 2012) and possibly lower the number of H2 massive galaxies.
3.2 Evolution of gas in galaxies
In this section we present our predictions for the evolution of the gas content in galaxies and make predictions for upcoming surveys of gas at high redshifts.
3.2.1 Galaxy sizes
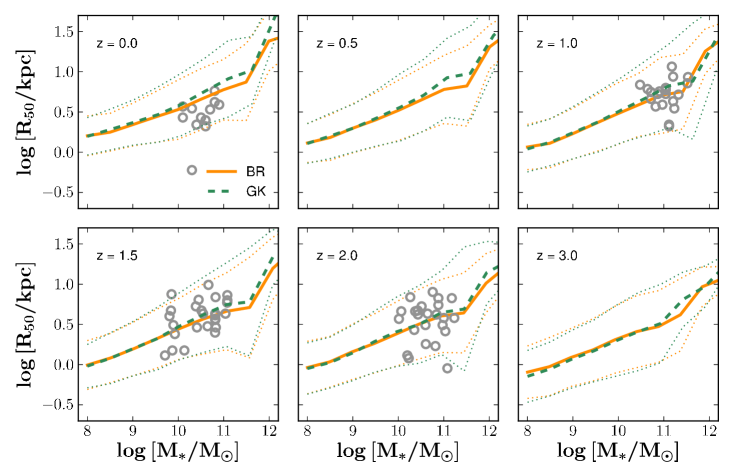
Figure 6 shows the SFR half-light radius of our modelled galaxies as a function of their stellar mass (i.e., the radius that encompasses half of the total SFR of the galaxy). We compare these results with radii presented in the literature for high-redshift galaxies (Förster Schreiber et al., 2006; Genzel et al., 2010; Tacconi et al., 2013) and, where possible, the CO half-light radius of the discs of the THINGS galaxies, which we computed from the radial profiles presented in (Leroy et al., 2008, assuming a fixed conversion between the H2 and CO radial profiles). Our results are in excellent agreement with the observations at high-redshift and in the local Universe, indicating that in spite of the simplicity of our model for computing disc sizes and surface density profiles, we appear to be able to correctly model the sizes and the location of star formation and the evolution of these quantities since . For a fixed stellar mass, the SFR half-light radius increases with decreasing redshift. Consequently, the molecular gas is more compact in high redshift galaxies. This behavior is driven by the overall growth of galaxy discs with time, as they accrete gas with higher angular momentum.
3.2.2 Hi mass function
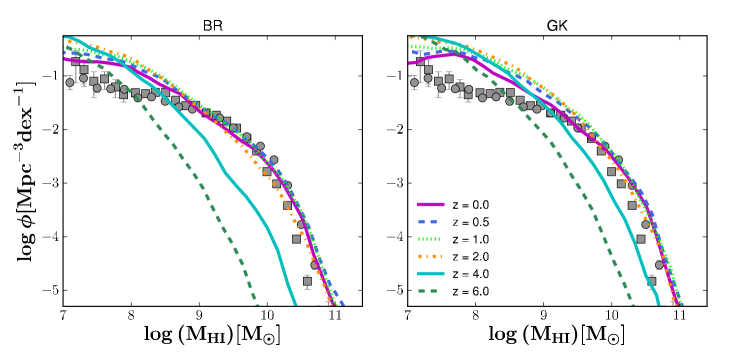
Figure 7 shows the predicted Hi mass function at redshifts between and . We overplot observations from Zwaan et al. (2005) and Martin et al. (2010) at . For Hi masses (), the figure shows a clear monotonic increase in the number of galaxies at a given Hi mass from to . There is very weak evolution at , and almost none at all from –0. The weak evolution in the number of low Hi mass galaxies shows that in our current model framework, the excess of these objects is already present at redshifts 2. We find little difference in the predicted evolution of the Hi mass function between the metallicity- and pressure-based recipes.
Although little evolution is seen in the Hi mass function since , this of course does not mean that galaxies are static, or that Hi is not being created or destroyed. It rather means that there is a kind of self-regulated equilibrium that arises naturally in these models.
3.2.3 H2 mass function
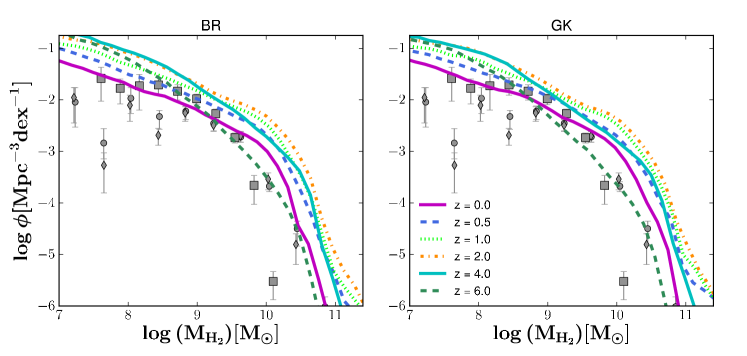
In Figure 8 we show the predicted H2 mass function at redshifts between and . The left panel contains mass functions obtained using the metallicity-based recipe, whereas the right pannel shows results obtained using a pressure-based recipe. These predictions are compared with the observational estimates of the H2 mass function at , as shown in Figure 5.
Both H2 recipes predict a gentle evolution in the H2 mass function at all H2 masses. In both recipes, the number of galaxies with large H2 masses increases from –2, then declines slightly to . At lower masses, , both models predict a slight increase in the number of low-H2 mass galaxies from –4, then a more or less monotonic decline from to .
In both recipes, it is more difficult to form H2 in low-surface density gas. In our models, low-mass halos host galaxies with a larger fraction of their gas at low surface density (this is in accord with observational size-mass scaling relations), and therefore low-mass galaxies are less efficient at forming H2, as we saw in Figure 1. In the BR model, we would say this is because their disc midplane pressure is lower due to their smaller gravitational potential wells. In the GK model, we would say it is due to the lower availability of dust grains on which H2 can form. Thus the build-up of large H2-mass galaxies from –2 reflects the growth of structure and the formation of massive dark matter halos, while the decrease in the number of low-H2 mass galaxies from to reflects the growth of galaxy discs resulting in lower cold gas surface densities, combined with low potential wells and/or low availability of dust grains.
3.2.4 Evolution in galaxy gas-fractions
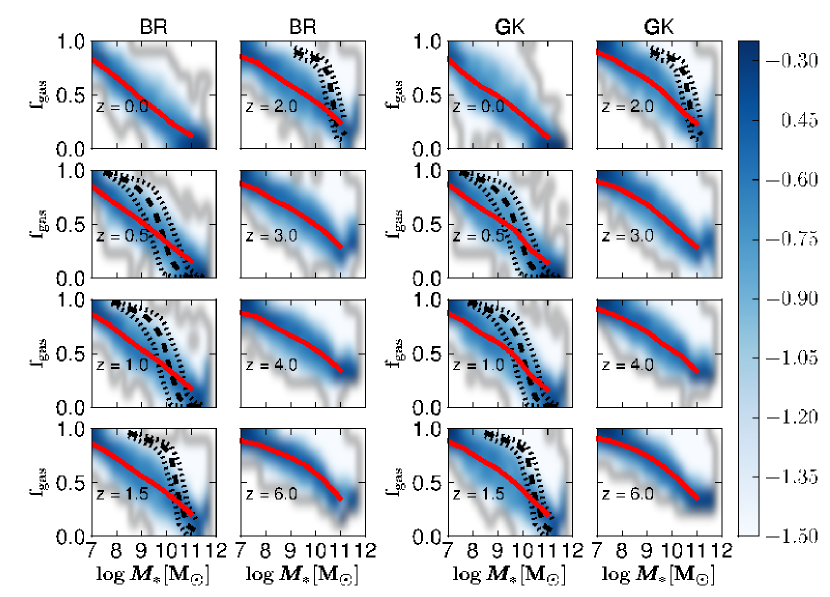
In the following figures we present the gas fraction and relative H2 content of galaxies as a function of their stellar mass for different redshifts (). In each case, we plot the conditional probability , and the reader should keep in mind that the most massive galaxies will be extremely rare at high redshift, and probably would not be included in any observed samples.
Figure 9 shows the cold gas fraction of the modeled galaxies as a function of stellar mass, divided into redshift bins. We also included the indirectly derived gas fraction from Popping et al. (2012). They calculated cold gas and H2 masses in galaxies from the COSMOS survey by inverting the Bigiel et al. (2008) star-formation law in combination with the Blitz & Rosolowsky (2006) method to calculate the H2 fraction of cold gas. Including a recipe to calculate the H2 fraction of cold gas allowed Popping et al. to indirectly estimate both the molecular and the atomic hydrogen masses of thse galaxies.
Our models predict that gas fractions decrease only mildly from –3. At lower redshifts the gas fractions decrease rapidly, such that galaxies with large stellar masses run out of gas first. This evolution is similar for both H2 recipes. Only in low mass galaxies () do the two applied recipes give different predictions, with the metallicity-based recipe predicting slightly larger gas fractions. We find that our model predictions are in good agreement with the indirect estimates of Popping et al. (2012) for in the mass range . At higher redshifts we find good agreement for objects with . We overpredict the indirect estimates from the literature at lower stellar mass, however, we did not take the selection criteria applied by Popping et al. into account here.
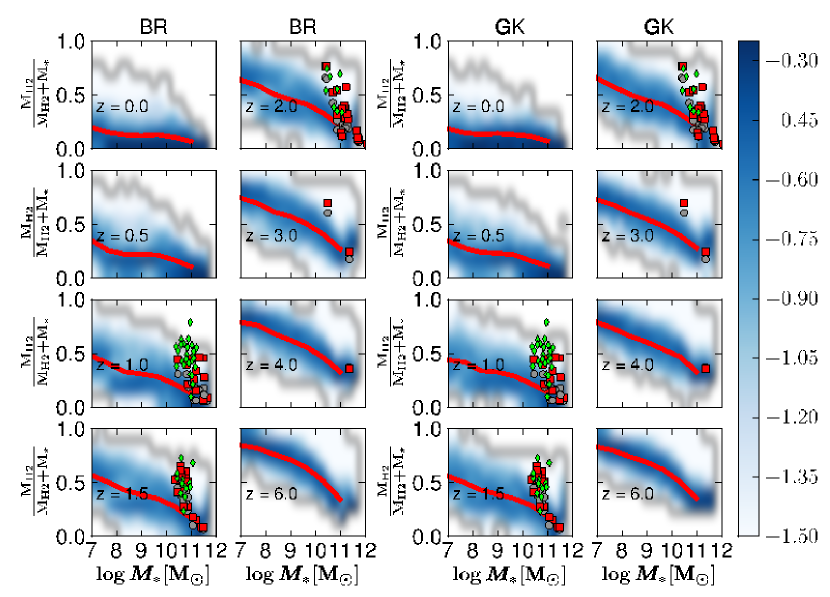
Figure 10 shows as a function of stellar mass at different redshifts. We included a compilation of observations presented in Narayanan, Bothwell & Davé (2012, taken from ()) and in Tacconi et al. (2013). Besides the H2 masses quoted in the original literature, Narayanan, Bothwell & Davé (2012) uses a novel approach to calculate the conversion between CO observation and H2 masses and their resulting gas fractions (see section 3.3 for a detailed description). We included the original values for as well as the recalibrated values. Similar to the previous figure, there is no significant difference between the two studied recipes. The evolution in , however, is much stronger. At we find at all probed stellar masses, whereas at we find values of over a large range of stellar masses. There is large scatter in at redshifts over all probed stellar masses. This scatter is indicative of a transitional phase during which the relative H2 content of galaxies rapidly drops, however, this does not necessarily take place at the same time/rate in galaxies with similar stellar mass.
This strong evolutionary trend, compared to the trends seen for the total cold gas fraction, indicates that the amount of H2 decreases not only due to the availability of less cold gas, but that the H2 fraction itself also drops (Popping et al., 2012). The rate at which this happens is independent of adopted recipe in our models. We find good agreement with the observations and their re-analysis by Narayanan, Bothwell & Davé (2012). Our model does not strongly favor either choice for the CO-H2 conversion factor. Similar to the total cold gas fractions, we find that our model predicts a lower relative H2 content of galaxies than the indirect estimates by Popping et al. (2012) suggest (especially at stellar masses ). We again emphasize that so far, we did not take the selection bias inherent to the observations that went into Popping et al. (2012) analysis into account. We will now discuss how selection criteria affect our results.
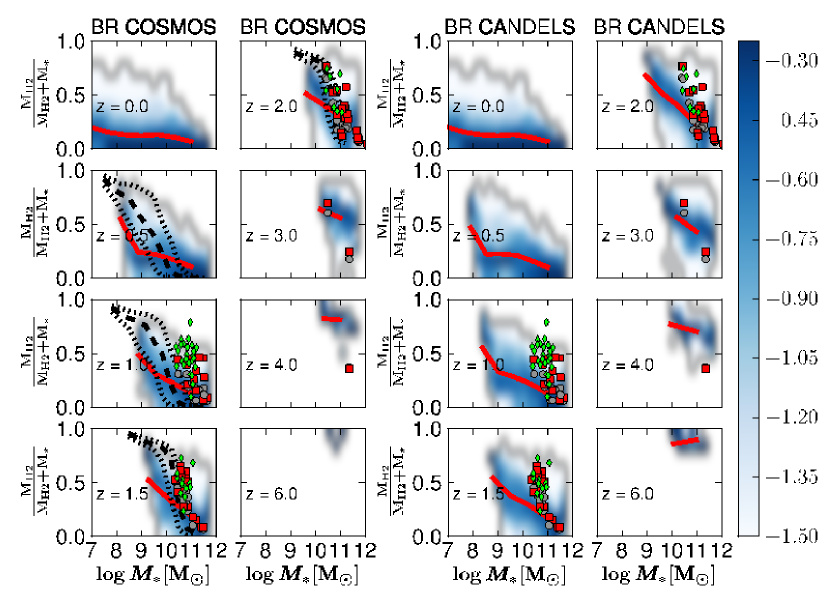
Current samples of high-redshift galaxies are highly sensitive to their selection criteria and direct observation of the molecular content of the galaxies are usually biased towards the most gas rich galaxies. To study how this bias might affect the comparison of our model predictions with observations in the literature, we apply the selection criteria from the relevant surveys to our model galaxies assuming a metallicity-based H2 recipe and show the results in Figure. 11. We compare our results to the gas fraction estimates for galaxies taken from the COSMOS sample with (Popping et al., 2012). We also show predictions for a sample with H 25 mag, representative of galaxies in the CANDELS survey (Grogin et al., 2011; Koekemoer et al., 2011) for which reliable measurements of galaxy size are expected to be able to be obtained.
When we account for the selection effects, we find good agreement with the indirect H2 fraction estimates from the COSMOS sample. At our model predicts slightly lower gas fractions than those suggested by the indirect estimates. The rough agreement is a very encouraging result for our model, but also emphasizes how important it is to properly take selection criteria into account when comparing models to observed galaxy samples. Our results also suggest that repeating the analysis on the deeper, -band selected CANDELS sample will greatly expand the range of stellar mass and gas fraction that can be probed by the indirect method at . We intend to repeat the Popping et al. (2012) analysis on the CANDELS sample in the near future. These results will provide an interesting complement to direct measures of high redshift gas fractions that will become available from ALMA.
3.2.5 Gas density evolution of the Universe
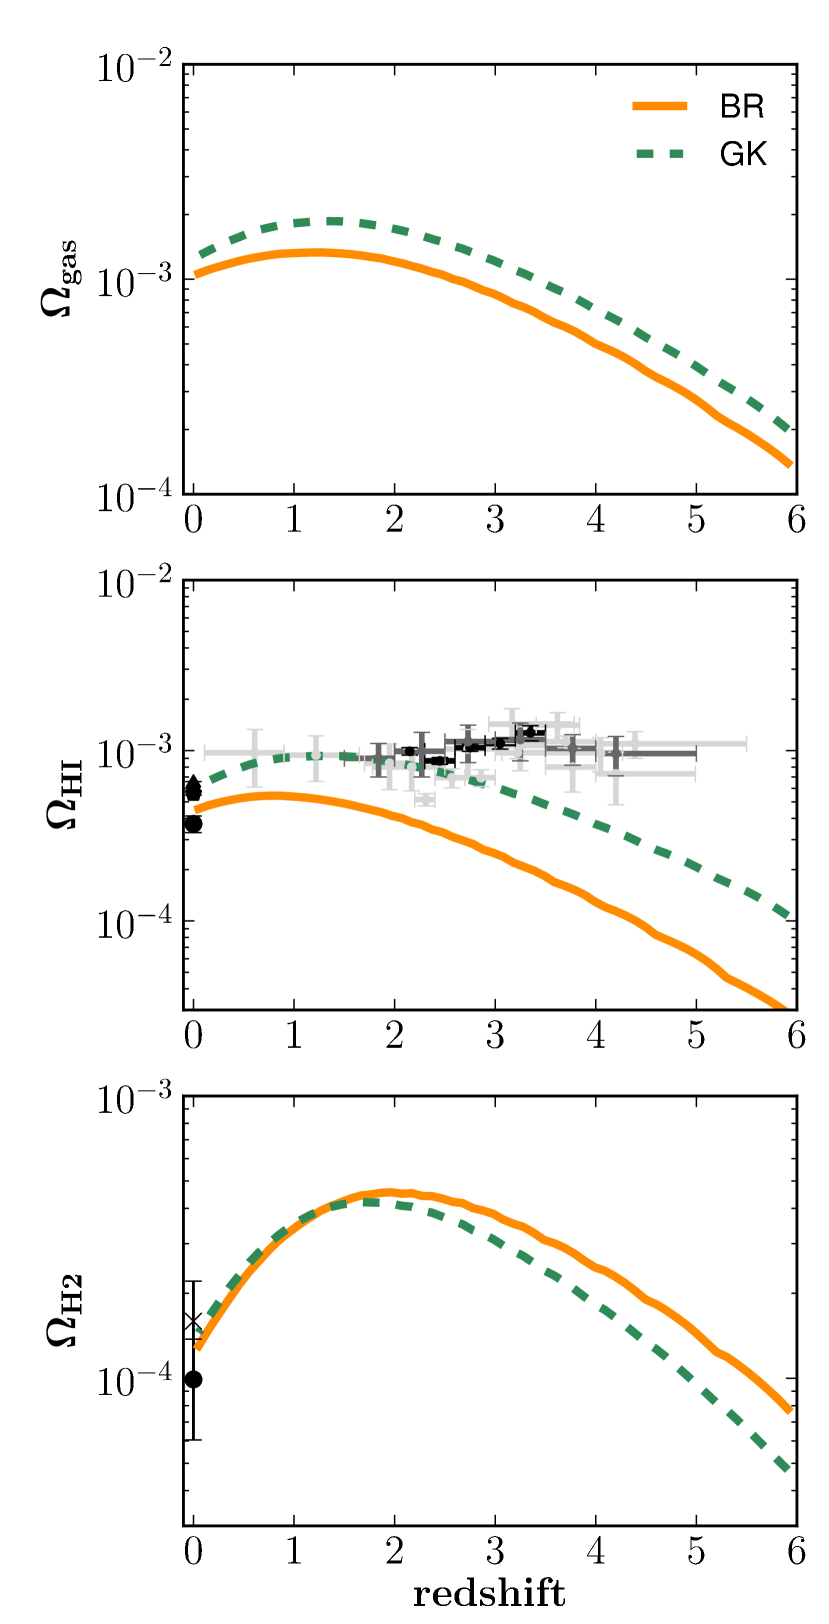
Figure 12 shows the predicted global Hi, H2, and total cold gas density (including ionised hydrogen) of the Universe as a function of time (in units of the critical density). We compare our results to local Hi and H2 densities (Keres, Yun & Young, 2003; Zwaan et al., 2005; Obreschkow & Rawlings, 2009b; Martin et al., 2010; Braun, 2012) and high-z estimates of the HI density obtained from Damped Lyman- (DLA) absorption systems (e.g., Péroux et al., 2005; Rao, Turnshek & Nestor, 2006; Guimarães et al., 2009; Prochaska & Wolfe, 2009; Noterdaeme et al., 2012; Zafar et al., 2013).
We see that the two H2 formation recipes differ significantly in terms of both the total cold gas content of the Universe and the ratio between Hi and H2. The metallicity-based recipe predicts more cold gas overall at all redshifts, and also more Hi. The pressure-based recipe produces more H2 overall, in spite of the lower amount of total cold gas. Both models underpredict inferred from DLAS at , the pressure-based model more dramatically. On the other hand, predictions by the metallicity-based model is in decent agreement with DLA observations at . Overall the metallicity-based recipe is better in reproducing the observed values for and .
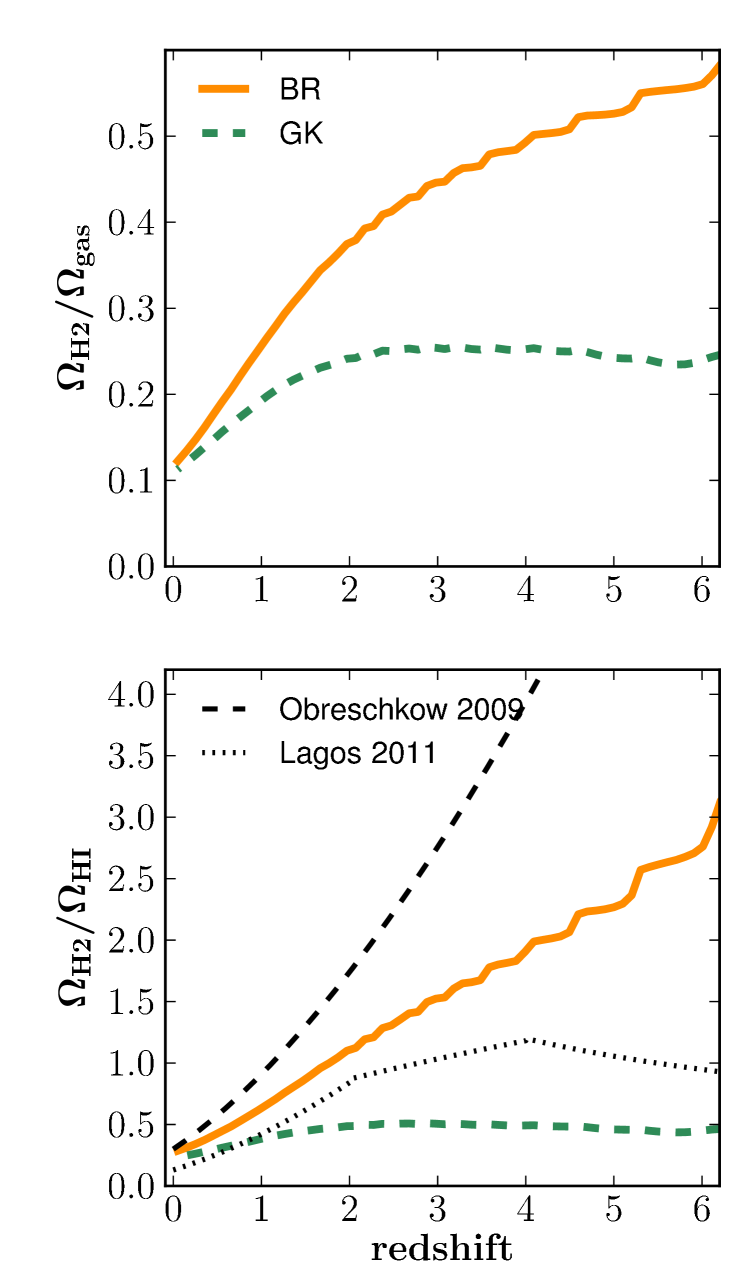
The two H2 formation recipes show a very different evolution in the global ratio of Hi to H2 with redshift (see Figure 13). The pressure-based recipe predicts a monotonic increase in and with increasing redshift. The metallicity-based recipe predicts a very mild increase with increasing redshift up to , then a flattening at higher redshifts. Especially worthwhile to note is that never exceeds for the metallicity-based recipe, whereas it does by up to a factor of three for the pressure-based recipe. We will give a detailed discussion about the origin of these differences, and how they can help to constrain the physics driving the partitioning of hydrogen into atomic and molecular hydrogen, in Section 4.
As a comparison we also show predictions from Obreschkow & Rawlings (2009a) and Lagos et al. (2011a) in Figure 13. Both authors use a pressure-based recipe similar to ours. Although the predictions differ in detail — unsurprising as many other aspects of the models differ — we find that our predictions for the pressure-based recipe are in qualitative agreement with other predictions from the literature, indicating a strong decline in with time. The slope of the decline differs significantly between the compared models. Only at do the Lagos et al. models predict an increase in with time. The authors claim this is due to a Monte-Carlo extension of the merger trees to very low mass halos dominated by Hi, although our halo mass resolution is actually higher than theirs, so this seems unlikely to account for the difference with our results. Our predicted evolution in for the metallicity-based H2 recipe is much flatter compared with the predictions from pressure-based recipes.
3.3 Predictions in Observation Space
Our model gives predictions for the H2 mass and surface density of galaxies, but these are difficult to observe directly. Observations typically use the CO luminosity as a tracer for the H2 content of a galaxy, assuming a CO-to-H2 conversion factor. A proper prediction of the CO luminosity of galaxies requires the inclusion of detailed chemistry and radiative transfer calculations (Lagos et al., 2012; Popping et al., 2013). In the present work we use a CO-to-H2 conversion relation to convert our predicted H2 masses to more directly observable CO luminosities. The advantage of working in “Observation Space” is that the CO-to-H2 conversion factor is thought to depend on galaxy properties such as internal density and metallicity, which are predicted by our models. Thus instead of attempting to convert CO luminosities to H2 masses for the observations, we can instead make use of our knowledge of our model galaxy properties to make a more physically motivated galaxy-by-galaxy conversion from H2 to CO.
Recently, Narayanan et al. (2012) and Feldmann, Gnedin & Kravtsov (2012) coupled sub-grid models of the ISM with cosmological simulations of galaxy formation to calculate the CO-H2 conversion factor for galaxies with different properties. Using a coupling of an H2-formation model and radiative-transfer calculations to simulated isolated and starburst galaxies, Narayanan et al. (2012) found that the average CO-H2 conversion factor in galaxies can be represented by
| (11) |
with in units of , is the H2 surface density in units of and is the gas metallicity in solar units.
Feldmann, Gnedin & Kravtsov (2012) use a coupling of sub-grid ISM models by Glover & Mac Low (2011) with cosmological simulations by Gnedin & Kravtsov (2011). They find that, when averaged on kiloparsec scales, the CO-H2 conversion factor is weakly dependent on column density and radiation field and can be described as a function of metallicity:
| (12) |
with and (see the Feldmann, Gnedin & Kravtsov 2010 results averaged to 4 kpc).
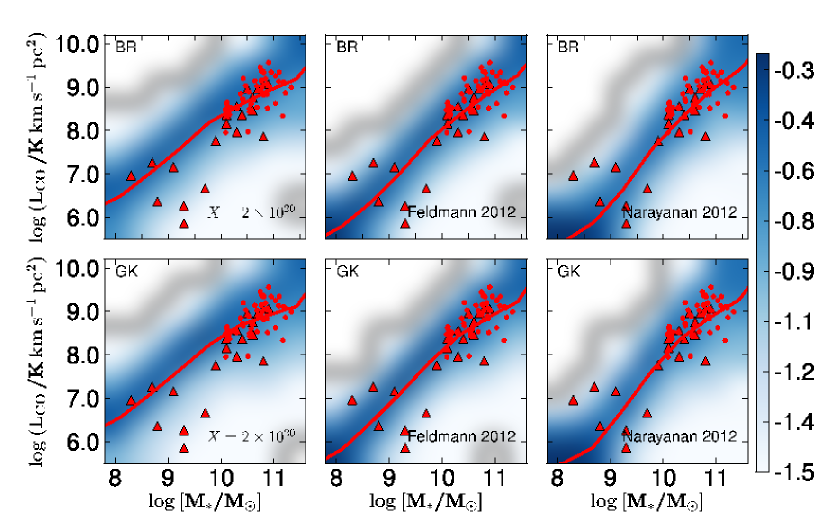
We estimate the CO luminosities of our model galaxies by applying three different assumptions for the CO-H2 conversion factor; a fixed conversion of , the approach presented by Narayanan et al. (2012) and that of Feldmann, Gnedin & Kravtsov (2012). Note that all CO luminosities presented here correspond to the CO J1-0 transition.
Figure 14 shows the CO luminosity of our model galaxies as a function of stellar mass at for the three CO-H2 conversion methods. Overplotted are CO luminosities observed by Leroy et al. (2008) and Saintonge et al. (2011). These CO luminosities have been obtained by converting the published H2 masses back to CO luminosities, using the CO-H2 conversion factor assumed in the respective papers. The Narayanan et al. (2012) and Feldmann, Gnedin & Kravtsov (2012) methods produce very similar results, and when applied to our models both provide very good agreement with the observations. Both clearly produce better agreement with the observations than the fixed CO-H2 conversion factor. The slope of the relation between CO luminosity and stellar mass varies slightly between the applied CO-H2 conversion method, however, this is not very well constrained by the data.
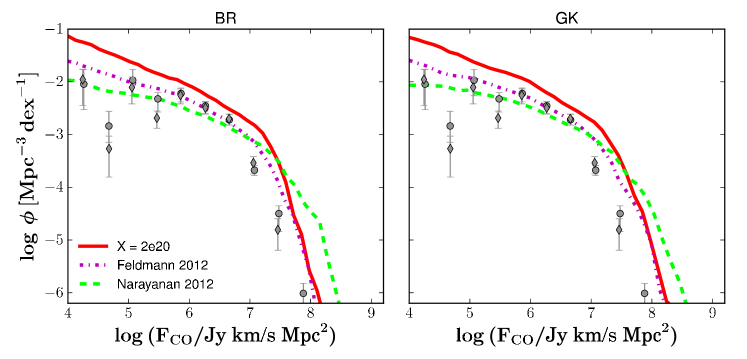
Figure 15 shows the CO luminosity function at obtained using the three different CO-H2 conversion methods. The Feldmann, Gnedin & Kravtsov (2012) method gives the best overall agreement with the observed CO luminosity function. The Narayanan et al. (2012) approach produces similar predictions, but with a slightly shallower low-luminosity end slope and more high CO luminosity galaxies. A fixed conversion factor of overpredicts the observations at all luminosities. All three methods slightly overpredict the number of high-CO luminosity objects.
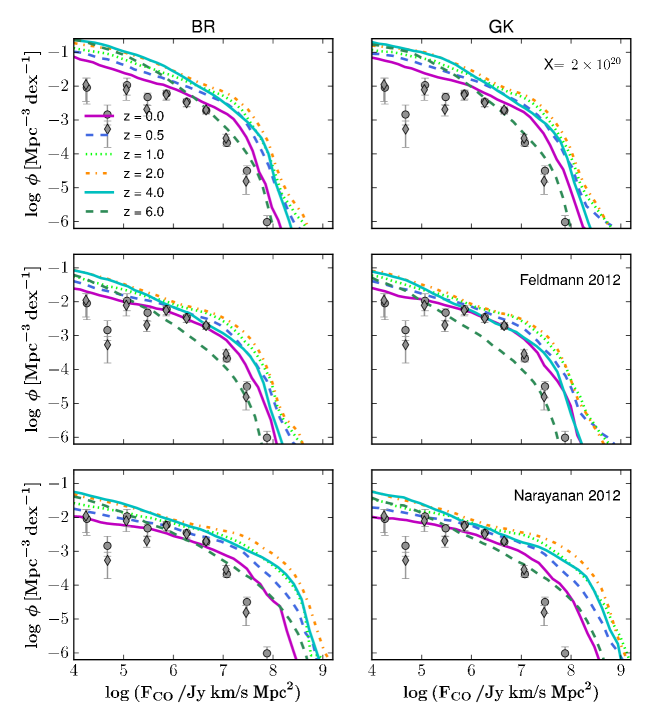
Figure 16 shows the predicted CO luminosity-functions at redshifts –6 for all three applied CO-H2 conversion methods. We overplot the CO luminosity function obtained by Keres, Yun & Young (2003) to guide the eye. All three CO-H2 conversion methods yield qualitatively the same evolutionary trends, but differ more in the details of the predicted evolution. All models predict a relatively mild flattening of the low-luminosity end of the CO luminosity function from –0, with a more rapid evolution on the bright end. The Feldmann et al. and Narayanan et al. approaches give almost identical results for the low-luminosity end, and differ more at high luminosities. The Feldmann et al. approach predicts fewer high-CO luminosity galaxies at high redshift.
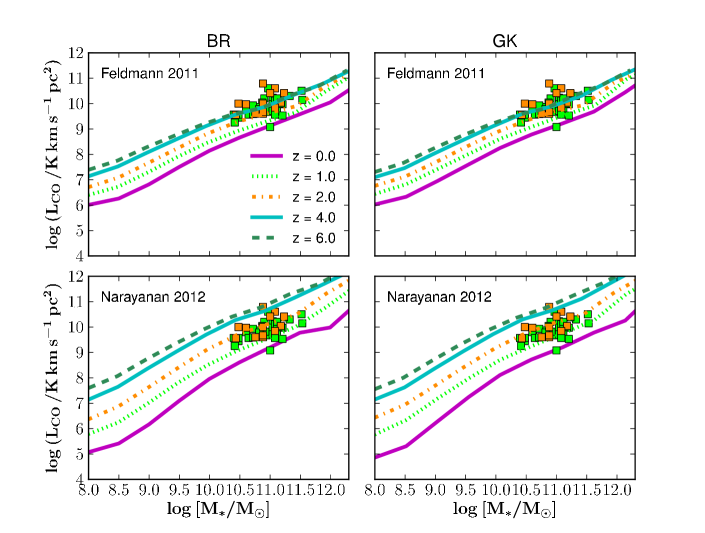
We show the evolution with redshift of the relation between stellar mass and CO luminosity in Figure 17 (assuming the Feldmann et al. and Narayanan et al. approach for the CO-H2 conversion factor). This diagram will, in the near future, be easily filled with observations of the CO luminosity of galaxies from surveys like GOODS, COSMOS, CANDELS using ALMA. As a comparison, we plot observational results presented in Genzel et al. (2010) and Tacconi et al. (2013), color-coded by redshift. We find that our model reproduces the observations very well. There is a clear linear relation between stellar mass and CO luminosity. The slope of this relation does not change with time and only slightly with CO-H2 conversion method. The normalization of the relation does change with time, indicating that the relative amount of CO decreases at the same rate in galaxies spanning a wide range in stellar mass (and type). The Narayanan et al. (2012) CO-H2 conversion method predicts a stronger evolution in the CO luminosities with time, driven by the dependency of the CO-H2 conversion on the H2 surface density. The high surface densities in high-redshifts galaxies decrease the CO-H2 conversion factor, increasing the CO luminosity at a given stellar mass. We find only minor differences between the results obtained assuming a pressure- and metallicity-based recipe.
4 Discussion
In this paper we have presented new predictions for the evolution of the multiphase gas content and CO luminosity of galaxies from –0. We apply pressure- (Blitz & Rosolowsky, 2006) and metallicity-based (Gnedin & Kravtsov, 2010) H2 formation recipes as two different approaches to calculating the molecular fraction of cold gas. Stars are formed following a power-law relation between the surface density of molecular gas and the SFR surface-density (Bigiel et al., 2008). Our goal is to assess the degree to which observations of the gas content of galaxies at high redshift can constrain the physics of the transformation of gas from one phase to another, and the conversion of cold dense gas into stars. In this section we discuss the results of this modeling effort and discuss our findings in comparison with previous studies using similar techniques. We will discuss the agreement and differences between the GK and BR model, draw general conclusions about the evolution of the gas content in galaxies, provide predictions that can help to guide future observational efforts, and discuss our results in the context of the physics driving galaxy formation in general.
We find that both the pressure-based and metallicity-based H2 formation recipes do well at reproducing the gas fractions and gas-to-stellar-mass ratios of local galaxies and the trends with stellar mass and internal galaxy density. There are only very small differences in the scaling relations predicted by the pressure- and metallicity-based recipe over the entire stellar mass range probed. The predicted sizes of atomic hydrogen discs are in good agreement with observations at , and the sizes of the modeled H2 discs are in good agreement with observations in the redshift range . We note that these recipes were taken from empirical results calibrated to observations, or from numerical simulations, and were not tuned to cause our semi-analytic model to match these observations. This is an indication that, despite the simplicity of our model for gas partitioning, SF, and disc internal structure, we reproduce the distribution of gas in galaxies with reasonable accuracy.
Both the pressure- and metallicity-based recipe do a fairly good job of reproducing the Hi mass function over the whole range probed by observations, with a small excess of high-Hi mass galaxies. Both models predict an excess of low-Hi-mass galaxies at compared to observations. The galaxies responsible for the excess at low-Hi masses in this model have low stellar masses () and reside in low-mass-halos (). This shows that to properly model the smallest galaxies observed in Hi, it is of key importance to resolve halos down to masses of , which frequently has not been possible in previous studies. For example, Somerville et al. (2008b) presented a predicted Hi mass function that was apparently in much better agreement with the observed one, but this was merely an artifact of the relatively coarse halo mass resolution () adopted in their simulations. Both recipes successfully predict the H2 mass function over the entire mass range probed.
In both models, the number density of Hi-massive galaxies shows an increase of about an order of magnitude from to 4, then remains nearly constant to . This result indicates that there is a kind of self-regulated equilibrium that arises naturally in these models. To first order, the constant high-mass end of the Hi mass function in our models is a consequence of the balance between accretion and the transformation of Hi into H2. Observations have shown that Hi saturates at surface densities of and that higher cold gas densities are dominated by H2 (Blitz & Rosolowsky, 2006; Leroy et al., 2008). In our models, as new gas is accreted, the amount of gas that is above surface densities where H2 formation is efficient increases, leading to conversion of Hi into H2. The constant high-mass end of the Hi mass function is a strong prediction that can be tested by the VLA up to (Fernández et al., 2013), and SKA and its pathfinders ASKAP and MeerKat in the near future. It will not only probe the H2 formation recipes, but also the physics that drives the accretion, consumption, and heating and/or ejection of cold gas from galaxies.
The number density of low H2-mass galaxies shows a strikingly different evolution, decreasing almost monotonically from to . This behavior is qualitatively very similar in the two H2 formation models. It is intriguing that this behavior — weak evolution of massive objects, with a decrease in the number of low-mass objects — is qualitatively similar to the evolution of the observed stellar mass function (Cimatti, Daddi & Renzini, 2006; Marchesini et al., 2009), sometimes referred to as “mass assembly downsizing”. This suggests that “mass assembly downsizing” may be linked to the evolution of the molecular gas content of galaxies and the ability to form stars out of this molecular gas.
We also find only minor differences in the evolution of galaxy gas fractions between the pressure- and metallicity-based recipes. Gas fractions are quite high () over a broad range of stellar masses () from –3, then drop fairly rapidly at lower redshifts. This drop in gas fraction occurs at higher redshift for galaxies with higher stellar mass — massive galaxies appear to consume or expel their gas earlier than less massive galaxies. A similar trend holds for the H2 fraction of galaxies, but the rate at which the H2 fraction drops is even faster than the rate of decline of the overall cold gas fractions. These trends are a different manifestation of mass assembly downsizing, and are in qualitative agreement with the observed evolution in galaxy gas fractions (Tacconi et al., 2010; Magdis et al., 2012; Narayanan et al., 2012; Popping et al., 2012; Tacconi et al., 2013; Sargent et al., 2013). Future surveys of the molecular gas content of galaxies, as well as future efforts to indirectly estimate the gas content of galaxies, will be able to probe the gas content in galaxies over a much wider range in galaxy properties and environment, improving the constraints that can be obtained on models of galaxy formation.
In a picture where galaxy gas fractions represent the competition between gas inflow, outflow and consumption through star formation (Davé, Finlator & Oppenheimer, 2011), the decreasing gas fractions below redshifts of indicate that outflows and gas consumption largely dominate this competition. Galaxies run out of cold gas and of molecular gas, but not necessarily at the same rate (Popping et al., 2012). Taking into account that galaxies form their stars out of molecular gas, this means that declining SFRs are not only due to a decline in the cold gas available, but also due to an even more rapid decline of the H2 fraction of gas.
The relative H2 content of galaxies with stellar masses below predicted by our models appears to be slightly too low in the redshift regime compared to the predictions by Popping et al. (2012). This effect is still present after taking selection criteria into account. It is probably related to the low-mass galaxy problem in models of galaxy formation, where galaxies in this mass regime are too passive at these redshifts with respect to the observations. We find that the low H2 content in these galaxies might be driving this problem, leading to inefficient star formation. A successful solution to the low-mass galaxy problem must also produce higher gas fractions in low-mass galaxies at intermediate redshift.
The predictions of the cosmic-density evolution of Hi, H2 and the total cold gas budget show the largest differences between pressure- and metallicity-based H2 recipes. The metallicity-based recipe yields a much higher cosmic density of cold gas and the density peaks at lower redshift. More striking is the difference in the evolution of the global H2 fraction, . The global H2 fraction assuming a metallicity-based H2 formation recipe shows only a mild decrease of a factor of from –0, whereas a pressure-based recipe predicts a strong decrease of a factor over this redshift range. Our predicted cosmic density of Hi is, at face value, in poor agreement with estimates from observations of DLAs for both H2 prescriptions. However, we have presented for all galaxies without taking into account the selection criteria for DLAs.
It is important to note that here we have computed the global density of gas by adding up all the gas in galaxies. However, DLAs may not provide an unbiased estimate of the total Hi content of the Universe. Berry et al. (2013) present a detailed analysis of predicted DLA properties using the same semi-analytic models presented here, and show that derived from DLAs as in the observational estimates shown here can differ substantially from the “true” underlying . They argue that a greater fraction of DLAs may arise from intergalactic or circumgalactic gas at , while at lower redshifts, a large amount of Hi may be in galaxies that have column densities too low for them to be selected as DLAs, leading to very weak evolution in , as observed.
The significant differences between the metallicity- and pressure-based recipes for H2 formation all find their origin in low mass galaxies () within low mass halos (). A significant fraction of the cold gas and Hi that leads to the higher cosmic densities of these quantities in the model with the metallicity-based recipe is within virtually “pristine” halos that contain less than of stars (see also the discussion in Berry et al., 2013). These differences are driven by a lack of metals at high redshift, necessary for the metallicity-based recipe to form molecular gas. As a result fewer stars form, less gas is consumed and the cold gas content of galaxies piles up. Furthermore, the lack of formed stars slows down the production of metals necessary to form H2. Meanwhile, the high internal densities of high-redshift galaxies are highly conducive to the formation of molecules through a pressure-based recipe. It is important to note that both the pressure- and metallicity-based recipes predict a small excess of low-Hi-mass galaxies. None of the various H2 formation recipes that we have explored are able to remove this excess, suggesting that it may arise from other physical processes.
We present predictions for the CO luminosities of our modelled galaxies using different methods to estimate the conversion between CO and H2. Although the general trends in CO are similar, different approaches to estimating the CO-H2 conversion factor yield different predictions in detail, especially for lower-H2-mass galaxies. The use of a fixed conversion factor between CO and H2 in our models overpredicts the observed luminosity function over a wide range of CO luminosities, although a different value for can change the normalization of the luminosity function. Using either the Narayanan et al. (2012) or Feldmann, Gnedin & Kravtsov (2012) CO-H2 conversion prescriptions, which depend on galaxy properties, we obtain good agreement with the observed H2 luminosity function below the knee, but overpredict the number of high-H2 mass galaxies by a significant amount, more so with the Narayanan et al. (2012) prescription. The predicted evolution of the CO luminosity function is qualitatively similar to that of the H2 luminosity function, described above, although the detailed predictions depend somewhat on the adopted conversion prescription. Future surveys with sub-mm and radio telescopes such as the ALMA, PdBI, LMT, VLA, ATCA, and SKA, will be able to probe the CO luminosity function at and provide valuable constraints for our models.
4.1 Comparison with previous work
We now discuss our results with respect to other recent theoretical predictions of the evolution of atomic and molecular gas in semi-analytic galaxy formation models. We will attempt to not only point out the differences between the various modeling efforts, but also the common results that can shed more light on the physics at play in galaxy formation. We used the fitting functions provided by Gnedin & Kravtsov (2011, GK) in our metallicity-based recipe for the formation of H2, whereas most previous modeling efforts have used the analytic model of Krumholz, McKee & Tumlinson (2009). These two approaches have been compared and were found to be very similar except at the lowest metallicities (Krumholz & Gnedin, 2011). We will show an explicit comparison of the two approaches in SPT14, and also find that they produce similar results. The GK fitting functions appear to be somewhat more robust and produce better agreement with observations, which is why we adopt them. Another difference in our approach is that we have separated the recipes for partitioning gas into an atomic and molecular component, and those for converting molecular gas into stars, while in some previous works both recipes were varied, making it more difficult to identify which aspects of the recipes may be causing differences in the results. In SPT14, we will present a systematic study of the effects of varying both the gas partitioning and star formation recipes separately. Here, we leave the star formation recipe fixed and vary only the gas partitioning recipes.
A first attempt to study the atomic and molecular hydrogen content of galaxies was presented in Obreschkow et al. (2009a) and Obreschkow & Rawlings (2009a). The authors use the semi-analytic predictions from De Lucia & Blaizot (2007) and calculate the H2 and Hi content of galaxies in post-processing using the Blitz & Rosolowsky (2006) pressure-based formalism. This model does not include an H2 based star-formation recipe, but rather assumes a traditional “total gas” based Kennicutt star formation relation, where stars form above some critical cold gas surface density. Obreschkow et al. (2009a) and Obreschkow & Rawlings (2009a) find Hi and H2 mass functions, H2 disc sizes and an evolution in universal density of H2 (Fig. 13) very similar to our findings when we assume a pressure based H2 formation recipe, and an H2-based star-formation recipe.
Obreschkow et al. (2009b) estimate the CO luminosity (ranging from CO J1-0 to CO J10-9) of a galaxy from its gas temperature based on the SFR surface density or AGN bolometric luminosity under local thermodynamic equilibrium (i.e. a single gas phase). The authors find that the low-luminosity end of the CO J1-0 luminosity function is already in place at , contrary to our predictions. The evolution of the bright end of the CO J1-0 luminosity function is in much better agreement with our results. Obreschkow et al. (2009b) point out that above the CMB starts to act as a bright background reducing the observed CO J1-0 luminosity. At the same time, the higher excitation temperatures of the warm CMB in the early universe will ease the observability of CO emission (Combes, Maoli & Omont, 1999; Gnedin, Silk & Spaans, 2001), although the negative effect of the CMB dominates. These are effects we did not include in our model but which can play a significant role when observing young galaxies in the early universe. In particular, sources at without a strong heating by a starburst or AGN will not be detectable through low CO transitions.
Lagos et al. (2011a, b) study the evolution of the atomic and molecular gas content of galaxies using a pressure- and metallicity based H2 recipe in a semi-analytic model of galaxy formation. Their pressure-based model uses an H2-prescription from Blitz & Rosolowsky (2006) and a star-formation model from Leroy et al. (2008), very similar to our pressure-based model. Their metallicity-based model follows the H2 prescription and star-formation model presented in Krumholz, McKee & Tumlinson (2009). Although the authors vary the star-formation relation in their models, the models are not calibrated to necessarily fit the luminosity functions, stellar and gas mass fractions and mass functions. The authors find that the metallicity-based recipes fail to reproduce the observed Hi-mass functions and select the pressure-based recipes in combination with the Bower et al. (2006) semi-analytic model as their preferred model. Taking into account that the Lagos et al. (2011b) models are not calibrated to match local observations, we argue that a metallicity-based H2 and star-formation recipe should not be considered ruled out, although we also find (to a much lesser extent) that the metallicity-based H2 recipe tends to produce too many low-Hi mass galaxies at . The KMT model is known to break down at the lowest metallicities, due to a failure of the assumption of chemical equilibrium in the analytic model (Krumholz & Gnedin, 2011). This problem yields a rapid accumulation of large Hi reservoirs in poor agreement with observations. We point out that the metallicity-based recipes require the cold gas in the initial time steps to be assigned a non-zero metallicity, otherwise no star formation will ever take place. The results can also be somewhat sensitive to the treatment of this “seed” metallicity, which may be provided by Pop III stars.
Using their preferred model, Lagos et al. (2011a) find an evolution in the Hi and H2 mass functions, gas fractions and H2 density of the universe very similar to our results. The authors find a bump in the Hi mass function at , similar to (although much larger than) the excess number of low-Hi-mass galaxies we find. They ascribe this excess to a mismatch between the observed and modeled radii of the galaxy discs. We, however, have shown the sizes of the gas discs in our models (including the sizes of the Hi and H2 components separately) are in good agreement with observations, so we do not think this is the main cause of the remaining excess of intermediate Hi-mass galaxies in our models, though it may partially explain the better agreement of our metallicity-based model with observations. Lagos et al. (2011a) finds a good match between their preferred model and the observed CO luminosity function by Keres, Yun & Young (2003). To obtain this match the authors need to assume a fixed CO-to-H2 conversion factor of .
Fu et al. (2012) also studied the redshift evolution of atomic and molecular gas in galaxies, although the emphasis of their work lies more on the evolution of the mass-metallicity relation. In their work the authors use a variety of star-formation models (including the Bigiel et al. 2008 recipe) and apply both a metallicity- (based on Krumholz, McKee & Tumlinson, 2009) and a pressure-based H2 recipe (based on Blitz & Rosolowsky, 2006). Their model is calibrated to the local Hi, H2 and stellar mass functions. The authors find that the evolution of the atomic and molecular gas fraction of galaxies is very similar for both applied H2 prescriptions, and is more dependent on the star-formation model. Similar to our findings, their results suggest that increases monotonically with increasing redshift for the pressure-based H2 recipe, whereas it decreases at redshifts for the metallicity-based recipe. The resolution of the models in Fu et al. (2012) is not sufficient to study the differences in behavior of the low mass end of the H2 and Hi mass function for the pressure- and metallicity based H2 recipes. This makes it difficult to compare our excess in low-Hi-mass galaxies and our constraints on the different H2 formation recipes with the results of Fu et al. (2012).
Despite the different implementations of the physical recipes, the three discussed models and ours all agree that a pressure-based recipe for H2 formation predicts a monotonic increase for with redshift (Fig. 13, although note the decline in for the Lagos et al., 2011a, model), whereas it flattens out for a metallicity based recipe. We therefore conclude that the applied H2 recipe is likely to be responsible for these trends. As discussed extensively in the previous subsection, in the metallicity-based models, the low metallicities at early times make H2 formation and hence star formation very inefficient, in spite of the higher gas densities. Thus star formation, H2 formation, and enrichment are delayed in these models relative to the pressure-based models.
5 Conclusions
We have presented predictions for the evolution of the atomic and molecular hydrogen content of galaxies from , based on a semi-analytic model of galaxy formation, including new modeling of the partitioning of cold gas in galactic discs into atomic, molecular, and ionised phases. We present results for two different H2 formation recipes: one a pressure-based recipe motivated by the empirical relation between molecular fraction and gas midplane-pressure from Blitz & Rosolowsky (2006), and one based on numerical hydrodynamic simulations in which the molecular fraction is highly dependent on the cold gas metallicity as well as the local UV background (Gnedin & Kravtsov, 2011). We compared our predictions to local and high-redshift observations and adopted an alternate approach in which we estimate the CO content of galaxies and compare directly with CO observations. We summarize our main findings below.
-
•
Without any tuning, our models correctly predict the trends between gas fractions and gas-to-stellar-mass ratios of Hi and H2 in local galaxies with mass and internal density. We furthermore reproduce the Hi and H2 disc sizes of local and high redshift galaxies.
-
•
Both H2 formation recipes reproduce the observed Hi mass function fairly well over the whole range probed by observations. Both models predict a small excess of low-Hi-mass galaxies. The high-mass end of the Hi mass function remains remarkably constant at redshifts of for both H2 formation recipes.
-
•
Both recipes correctly predict the H2 mass function over the entire mass range probed. The number density of H2-massive galaxies increases from to after which it remains fairly constant, whereas the number density of low-H2 mass galaxies decreases almost monotonically from to .
-
•
Galaxy gas fractions remain relatively high () from , then drop fairly rapidly. A similar trend holds for the H2 fraction of galaxies, but the drop occurs at an even higher rate.
-
•
The metallicity-based recipe yields a much higher cosmic density of cold gas over the entire redshift range probed. The cosmic H2 fraction as predicted by the metallicity-based recipe is much lower than the H2 fraction predicted by the pressure-based recipe.
-
•
The galaxies responsible for the high cosmic gas density and low cosmic H2 fraction all reside in low-mass halos (), and contain negligible amounts of stellar material. The build-up of atomic gas in these low-mass halos is driven by a lack of metals at high redshift, necessary to form molecular gas, stars, and produce more metals.
-
•
The conversion of H2 masses to CO luminosities provides valuable direct predictions for future surveys with ALMA at low redshifts or radio interferometers such as the VLA at higher redshifts. None of the presented methods for the CO-to-H2 conversion predicts perfect agreement with observations from the literature, although the physically motivated nature of the Narayanan et al. (2012) and Feldmann, Gnedin & Kravtsov (2012) approaches are favoured over a constant CO-to-H2 conversion factor.
The results presented in this paper can serve as predictions for future surveys of the atomic and molecular content of galaxies. We look forward to observations from new and upcoming facilities, that will be able to confront our predictions, further constraining the physics that drives the formation of molecules and the evolution of gas in galaxies.
Acknowledgments
We thank Michael Berry, Ann Martin, Desika Narayanan, Danail Obreschkow, Linda Tacconi, and Martin Zwaan for providing observational data and Marc Verheijen for stimulating discussions. We thank the anonymous referee for many suggestions that have improved the paper. GP acknowledges NOVA (Nederlandse Onderzoekschool voor Astronomie) and LKBF (Leids Kerkhoven-Bosscha Fonds) for funding and the Physics and Astronomy department of Rutgers University for its hospitality.
References
- Baugh et al. (2005) Baugh C. M., Lacey C. G., Frenk C. S., Granato G. L., Silva L., Bressan A., Benson A. J., Cole S., 2005, \mnras, 356, 1191
- Berry et al. (2013) Berry M., Somerville R. S., Haas M. R., Gawiser E., Maller A., Popping G., Trager S. C., 2013, ArXiv/1308.2598
- Bigiel et al. (2008) Bigiel F., Leroy A., Walter F., Brinks E., de Blok W. J. G., Madore B., Thornley M. D., 2008, \aj, 136, 2846
- Bigiel et al. (2011) Bigiel F. et al., 2011, \apjl, 730, L13+
- Birnboim & Dekel (2003) Birnboim Y., Dekel A., 2003, \mnras, 345, 349
- Blitz & Rosolowsky (2006) Blitz L., Rosolowsky E., 2006, \apj, 650, 933
- Blumenthal et al. (1986) Blumenthal G. R., Faber S. M., Flores R., Primack J. R., 1986, \apj, 301, 27
- Bolatto et al. (2008) Bolatto A. D., Leroy A. K., Rosolowsky E., Walter F., Blitz L., 2008, \apj, 686, 948
- Bondi (1952) Bondi H., 1952, \mnras, 112, 195
- Booth et al. (2009) Booth R. S., de Blok W. J. G., Jonas J. L., Fanaroff B., 2009, ArXiv e-prints
- Boselli et al. (2014) Boselli A., Cortese L., Boquien M., Boissier S., Catinella B., Lagos C., Saintonge A., 2014, ArXiv e-prints
- Bothwell et al. (2013) Bothwell M. S. et al., 2013, \mnras, 563
- Bower et al. (2006) Bower R. G., Benson A. J., Malbon R., Helly J. C., Frenk C. S., Baugh C. M., Cole S., Lacey C. G., 2006, \mnras, 370, 645
- Boylan-Kolchin, Ma & Quataert (2008) Boylan-Kolchin M., Ma C.-P., Quataert E., 2008, \mnras, 383, 93
- Braun (2012) Braun R., 2012, \apj, 749, 87
- Bromm & Larson (2004) Bromm V., Larson R. B., 2004, \araa, 42, 79
- Carilli & Rawlings (2004) Carilli C. L., Rawlings S., 2004, \nar, 48, 979
- Casey et al. (2011) Casey C. M. et al., 2011, \mnras, 415, 2723
- Catinella et al. (2008) Catinella B., Haynes M. P., Giovanelli R., Gardner J. P., Connolly A. J., 2008, \apjl, 685, L13
- Catinella et al. (2013) Catinella B. et al., 2013, ArXiv e-prints: 1308.1676
- Catinella et al. (2012) —, 2012, \aap, 544, A65
- Catinella et al. (2010) —, 2010, \mnras, 403, 683
- Christensen et al. (2012) Christensen C., Quinn T., Governato F., Stilp A., Shen S., Wadsley J., 2012, \mnras, 425, 3058
- Cimatti, Daddi & Renzini (2006) Cimatti A., Daddi E., Renzini A., 2006, \aap, 453, L29
- Cole et al. (1994) Cole S., Aragon-Salamanca A., Frenk C. S., Navarro J. F., Zepf S. E., 1994, \mnras, 271, 781
- Cole et al. (2000) Cole S., Lacey C. G., Baugh C. M., Frenk C. S., 2000, \mnras, 319, 168
- Combes, Maoli & Omont (1999) Combes F., Maoli R., Omont A., 1999, \aap, 345, 369
- Croton et al. (2006) Croton D. J. et al., 2006, \mnras, 365, 11
- Daddi et al. (2010) Daddi E. et al., 2010, \apj, 713, 686
- Davé, Finlator & Oppenheimer (2011) Davé R., Finlator K., Oppenheimer B. D., 2011, \mnras, 416, 1354
- Davé et al. (2010) Davé R., Finlator K., Oppenheimer B. D., Fardal M., Katz N., Kereš D., Weinberg D. H., 2010, \mnras, 404, 1355
- De Lucia & Blaizot (2007) De Lucia G., Blaizot J., 2007, \mnras, 375, 2
- Dekel & Birnboim (2006) Dekel A., Birnboim Y., 2006, \mnras, 368, 2
- Dutton, van den Bosch & Dekel (2010) Dutton A. A., van den Bosch F. C., Dekel A., 2010, \mnras, 405, 1690
- Elmegreen (1989) Elmegreen B. G., 1989, \apj, 338, 178
- Elmegreen (1993) —, 1993, \apj, 411, 170
- Erb et al. (2006) Erb D. K., Steidel C. C., Shapley A. E., Pettini M., Reddy N. A., Adelberger K. L., 2006, \apj, 646, 107
- Feldmann, Gnedin & Kravtsov (2012) Feldmann R., Gnedin N. Y., Kravtsov A. V., 2012, \apj, 747, 124
- Fernández et al. (2013) Fernández X. et al., 2013, \apjl, 770, L29
- Flores et al. (1993) Flores R., Primack J. R., Blumenthal G. R., Faber S. M., 1993, \apj, 412, 443
- Fontanot et al. (2009) Fontanot F., De Lucia G., Monaco P., Somerville R. S., Santini P., 2009, \mnras, 397, 1776
- Förster Schreiber et al. (2009) Förster Schreiber N. M. et al., 2009, \apj, 706, 1364
- Förster Schreiber et al. (2006) —, 2006, \apj, 645, 1062
- Fu et al. (2010) Fu J., Guo Q., Kauffmann G., Krumholz M. R., 2010, \mnras, 409, 515
- Fu et al. (2012) Fu J., Kauffmann G., Li C., Guo Q., 2012, \mnras, 424, 2701
- Genzel et al. (2010) Genzel R. et al., 2010, \mnras, 407, 2091
- Giovanelli et al. (2005) Giovanelli R. et al., 2005, \aj, 130, 2598
- Glover (2013) Glover S., 2013, in Astrophysics and Space Science Library, Vol. 396, Astrophysics and Space Science Library, Wiklind T., Mobasher B., Bromm V., eds., p. 103
- Glover & Mac Low (2011) Glover S. C. O., Mac Low M.-M., 2011, \mnras, 412, 337
- Gnedin (2000) Gnedin N. Y., 2000, \apj, 542, 535
- Gnedin (2012) —, 2012, \apj, 754, 113
- Gnedin & Kravtsov (2010) Gnedin N. Y., Kravtsov A. V., 2010, \apj, 714, 287
- Gnedin & Kravtsov (2011) —, 2011, \apj, 728, 88
- Gnedin, Silk & Spaans (2001) Gnedin N. Y., Silk J., Spaans M., 2001, ArXiv Astrophysics e-prints: 0106110
- Greif et al. (2010) Greif T. H., Glover S. C. O., Bromm V., Klessen R. S., 2010, \apj, 716, 510
- Grogin et al. (2011) Grogin N. A. et al., 2011, \apjs, 197, 35
- Guimarães et al. (2009) Guimarães R., Petitjean P., de Carvalho R. R., Djorgovski S. G., Noterdaeme P., Castro S., Poppe P. C. D. R., Aghaee A., 2009, \aap, 508, 133
- Guo et al. (2011) Guo Q. et al., 2011, \mnras, 413, 101
- Guo et al. (2010) Guo Q., White S., Li C., Boylan-Kolchin M., 2010, \mnras, 404, 1111
- Haiman, Rees & Loeb (1996) Haiman Z., Rees M. J., Loeb A., 1996, \apj, 467, 522
- Helfer et al. (2003) Helfer T. T., Thornley M. D., Regan M. W., Wong T., Sheth K., Vogel S. N., Blitz L., Bock D., 2003, \apjs, 145, 259
- Hopkins et al. (2009a) Hopkins P. F., Cox T. J., Younger J. D., Hernquist L., 2009a, \apj, 691, 1168
- Hopkins et al. (2009b) Hopkins P. F. et al., 2009b, \mnras, 397, 802
- Hunter et al. (2012) Hunter D. A. et al., 2012, \aj, 144, 134
- Johnston et al. (2008) Johnston S. et al., 2008, Experimental Astronomy, 22, 151
- Kang, Jing & Silk (2006) Kang X., Jing Y. P., Silk J., 2006, \apj, 648, 820
- Kauffmann et al. (1999) Kauffmann G., Colberg J. M., Diaferio A., White S. D. M., 1999, \mnras, 303, 188
- Kauffmann, White & Guiderdoni (1993) Kauffmann G., White S. D. M., Guiderdoni B., 1993, \mnras, 264, 201
- Kennicutt (1998) Kennicutt, Jr. R. C., 1998, \apj, 498, 541
- Keres, Yun & Young (2003) Keres D., Yun M. S., Young J. S., 2003, \apj, 582, 659
- Kereš et al. (2005) Kereš D., Katz N., Weinberg D. H., Davé R., 2005, \mnras, 363, 2
- Koekemoer et al. (2011) Koekemoer A. M. et al., 2011, \apjs, 197, 36
- Komatsu et al. (2009) Komatsu E. et al., 2009, \apjs, 180, 330
- Kravtsov (1999) Kravtsov A. V., 1999, PhD thesis, NEW MEXICO STATE UNIVERSITY
- Kravtsov et al. (2004) Kravtsov A. V., Berlind A. A., Wechsler R. H., Klypin A. A., Gottlöber S., Allgood B., Primack J. R., 2004, \apj, 609, 35
- Krumholz & Dekel (2012) Krumholz M. R., Dekel A., 2012, \apj, 753, 16
- Krumholz & Gnedin (2011) Krumholz M. R., Gnedin N. Y., 2011, \apj, 729, 36
- Krumholz, McKee & Tumlinson (2008) Krumholz M. R., McKee C. F., Tumlinson J., 2008, \apj, 689, 865
- Krumholz, McKee & Tumlinson (2009) —, 2009, \apj, 693, 216
- Kuhlen et al. (2012) Kuhlen M., Krumholz M. R., Madau P., Smith B. D., Wise J., 2012, \apj, 749, 36
- Lagos et al. (2011a) Lagos C. D. P., Baugh C. M., Lacey C. G., Benson A. J., Kim H.-S., Power C., 2011a, \mnras, 1776
- Lagos et al. (2012) Lagos C. d. P., Bayet E., Baugh C. M., Lacey C. G., Bell T. A., Fanidakis N., Geach J. E., 2012, \mnras, 426, 2142
- Lagos et al. (2011b) Lagos C. D. P., Lacey C. G., Baugh C. M., Bower R. G., Benson A. J., 2011b, \mnras, 416, 1566
- Leroy et al. (2009) Leroy A. K. et al., 2009, \aj, 137, 4670
- Leroy et al. (2008) Leroy A. K., Walter F., Brinks E., Bigiel F., de Blok W. J. G., Madore B., Thornley M. D., 2008, \aj, 136, 2782
- Magdis et al. (2012) Magdis G. E. et al., 2012, \apj, 760, 6
- Mannucci et al. (2009) Mannucci F. et al., 2009, \mnras, 398, 1915
- Marchesini et al. (2009) Marchesini D., van Dokkum P. G., Förster Schreiber N. M., Franx M., Labbé I., Wuyts S., 2009, \apj, 701, 1765
- Martin et al. (2010) Martin A. M., Papastergis E., Giovanelli R., Haynes M. P., Springob C. M., Stierwalt S., 2010, \apj, 723, 1359
- McKee & Ostriker (2007) McKee C. F., Ostriker E. C., 2007, \araa, 45, 565
- Menci et al. (2006) Menci N., Fontana A., Giallongo E., Grazian A., Salimbeni S., 2006, \apj, 647, 753
- Mo, Mao & White (1998) Mo H. J., Mao S., White S. D. M., 1998, \mnras, 295, 319
- Monaco, Fontanot & Taffoni (2007) Monaco P., Fontanot F., Taffoni G., 2007, \mnras, 375, 1189
- Murray & Rahman (2010) Murray N., Rahman M., 2010, \apj, 709, 424
- Nakamura & Umemura (2001) Nakamura F., Umemura M., 2001, \apj, 548, 19
- Narayanan, Bothwell & Davé (2012) Narayanan D., Bothwell M., Davé R., 2012, \mnras, 426, 1178
- Narayanan et al. (2012) Narayanan D., Krumholz M. R., Ostriker E. C., Hernquist L., 2012, \mnras, 421, 3127
- Navarro, Frenk & White (1996) Navarro J. F., Frenk C. S., White S. D. M., 1996, \apj, 462, 563
- Niemi et al. (2012) Niemi S.-M., Somerville R. S., Ferguson H. C., Huang K.-H., Lotz J., Koekemoer A. M., 2012, \mnras, 421, 1539
- Noterdaeme et al. (2012) Noterdaeme P. et al., 2012, \aap, 547, L1
- Obreschkow et al. (2009a) Obreschkow D., Croton D., De Lucia G., Khochfar S., Rawlings S., 2009a, \apj, 698, 1467
- Obreschkow et al. (2009b) Obreschkow D., Heywood I., Klöckner H.-R., Rawlings S., 2009b, \apj, 702, 1321
- Obreschkow & Rawlings (2009a) Obreschkow D., Rawlings S., 2009a, \apjl, 696, L129
- Obreschkow & Rawlings (2009b) —, 2009b, \mnras, 394, 1857
- Ostriker, McKee & Leroy (2010) Ostriker E. C., McKee C. F., Leroy A. K., 2010, \apj, 721, 975
- Pelupessy, Papadopoulos & van der Werf (2006) Pelupessy F. I., Papadopoulos P. P., van der Werf P., 2006, \apj, 645, 1024
- Péroux et al. (2005) Péroux C., Dessauges-Zavadsky M., D’Odorico S., Sun Kim T., McMahon R. G., 2005, \mnras, 363, 479
- Popping et al. (2012) Popping G., Caputi K. I., Somerville R. S., Trager S. C., 2012, \mnras, 425, 2386
- Popping et al. (2013) Popping G., Pérez-Beapuits J. P., Spaans M., Trager S. C., Somerville R. S., 2013, ArXiv/1310.1476
- Power, Baugh & Lacey (2010) Power C., Baugh C. M., Lacey C. G., 2010, \mnras, 406, 43
- Prochaska & Wolfe (2009) Prochaska J. X., Wolfe A. M., 2009, \apj, 696, 1543
- Rao, Turnshek & Nestor (2006) Rao S. M., Turnshek D. A., Nestor D. B., 2006, \apj, 636, 610
- Riechers et al. (2011) Riechers D. A., Hodge J., Walter F., Carilli C. L., Bertoldi F., 2011, \apjl, 739, L31
- Robertson et al. (2006) Robertson B., Cox T. J., Hernquist L., Franx M., Hopkins P. F., Martini P., Springel V., 2006, \apj, 641, 21
- Robertson & Kravtsov (2008) Robertson B. E., Kravtsov A. V., 2008, \apj, 680, 1083
- Robitaille & Whitney (2010) Robitaille T. P., Whitney B. A., 2010, \apjl, 710, L11
- Saintonge et al. (2011) Saintonge A. et al., 2011, \mnras, 415, 32
- Saintonge et al. (2012) —, 2012, \apj, 758, 73
- Sargent et al. (2013) Sargent M. T. et al., 2013, ArXiv e-prints: 1303.4392
- Schmidt (1959) Schmidt M., 1959, \apj, 129, 243
- Schneider et al. (2002) Schneider R., Ferrara A., Natarajan P., Omukai K., 2002, \apj, 571, 30
- Schruba et al. (2011) Schruba A. et al., 2011, \aj, 142, 37
- Solomon et al. (1987) Solomon P. M., Rivolo A. R., Barrett J., Yahil A., 1987, \apj, 319, 730
- Somerville et al. (2008a) Somerville R. S. et al., 2008a, \apj, 672, 776
- Somerville et al. (2012) Somerville R. S., Gilmore R. C., Primack J. R., Domínguez A., 2012, \mnras, 423, 1992
- Somerville et al. (2008b) Somerville R. S., Hopkins P. F., Cox T. J., Robertson B. E., Hernquist L., 2008b, \mnras, 391, 481
- Somerville & Kolatt (1999) Somerville R. S., Kolatt T. S., 1999, \mnras, 305, 1
- Somerville & Primack (1999) Somerville R. S., Primack J. R., 1999, \mnras, 310, 1087
- Somerville, Primack & Faber (2001) Somerville R. S., Primack J. R., Faber S. M., 2001, \mnras, 320, 504
- Starkenburg et al. (2010) Starkenburg E. et al., 2010, \aap, 513, A34
- Sutherland & Dopita (1993) Sutherland R. S., Dopita M. A., 1993, \apjs, 88, 253
- Tacconi et al. (2010) Tacconi L. J. et al., 2010, \nat, 463, 781
- Tacconi et al. (2013) —, 2013, \apj, 768, 74
- Tolstoy, Hill & Tosi (2009) Tolstoy E., Hill V., Tosi M., 2009, \araa, 47, 371
- Tumlinson et al. (2011) Tumlinson J. et al., 2011, Science, 334, 948
- Verheijen et al. (2007) Verheijen M., van Gorkom J. H., Szomoru A., Dwarakanath K. S., Poggianti B. M., Schiminovich D., 2007, \apjl, 668, L9
- Verheijen & Sancisi (2001) Verheijen M. A. W., Sancisi R., 2001, \aap, 370, 765
- Walter et al. (2008) Walter F., Brinks E., de Blok W. J. G., Bigiel F., Kennicutt R. C., Thornley M. D., Leroy A., 2008, \aj, 136, 2563
- Weinmann et al. (2012) Weinmann S. M., Pasquali A., Oppenheimer B. D., Finlator K., Mendel J. T., Crain R. A., Macciò A. V., 2012, \mnras, 426, 2797
- Wise et al. (2012) Wise J. H., Turk M. J., Norman M. L., Abel T., 2012, \apj, 745, 50
- Wong & Blitz (2002) Wong T., Blitz L., 2002, \apj, 569, 157
- Wootten & Thompson (2009) Wootten A., Thompson A. R., 2009, IEEE Proceedings, 97, 1463
- Zafar et al. (2013) Zafar T., Péroux C., Popping A., Milliard B., Deharveng J.-M., Frank S., 2013, \aap, 556, A141
- Zwaan et al. (2005) Zwaan M. A., Meyer M. J., Staveley-Smith L., Webster R. L., 2005, \mnras, 359, L30