The effect of inertia on sheared disordered solids:
Critical scaling
of avalanches in two and three dimensions
Abstract
Molecular dynamics simulations with varying damping are used to examine the effects of inertia and spatial dimension on sheared disordered solids in the athermal, quasistatic limit. In all cases the distribution of avalanche sizes follows a power law over at least three orders of magnitude in dissipated energy or stress drop. Scaling exponents are determined using finite-size scaling for systems with to particles. Three distinct universality classes are identified corresponding to overdamped and underdamped limits, as well as a crossover damping that separates the two regimes. For each universality class, the exponent describing the avalanche distributions is the same in two and three dimensions. The spatial extent of plastic damage is proportional to the energy dissipated in an avalanche. Both rise much more rapidly with system size in the underdamped limit where inertia is important. Inertia also lowers the mean energy of configurations sampled by the system and leads to an excess of large events like that seen in earthquake distributions for individual faults. The distribution of stress values during shear narrows to zero with increasing system size and may provide useful information about the size of elemental events in experimental systems. For overdamped and crossover systems the stress variation scales inversely with the square root of the system size. For underdamped systems the variation is determined by the size of the largest events.
I Introduction
Many slowly driven systems respond to a driving force through bursts of activity termed avalanches. These avalanches often follow a power-law distribution over many decades, signalling the existence of a nonequilibrium critical depinning transition at the onset of motion. Systems showing this scaling behavior include charge-density waves, fluid interfaces, magnetic domain walls, granular media, foams, crystals, amorphous metals and the earth’s crust Martys et al. (1991); Perkovic et al. (1995); Myers and Sethna (1993); Miguel et al. (2001); Friedman et al. (2012); Chan et al. (2010); Baldassarri et al. (2006); Zapperi et al. (1997, 2005); Sethna et al. (2001).
One of the unresolved aspects of the depinning transition is the role of inertia. Most computational work has focussed on the overdamped limit, and studies that include inertia suggest that it fundamentally changes the depinning transition from a continuous second order transition to a discontinuous transition with hysteresis Dahmen et al. (2009); Schwarz and Fisher (2003); Prado and Olami (1992); Marchetti (2005). In contrast, experiments have reported power law scaling even in systems that display underdamped dynamics, such as earthquakes and compressed laboratory samples. In this paper we present simulations of quasistatic plastic deformation in two and three dimensional disordered solids that show inertia does not destroy critical behavior at depinning, but does change the universality class.
Theoretical studies of avalanches have generally considered lattice-based models with simple site interaction rules Alava et al. (2006); Cizeau et al. (1997); Dahmen et al. (2009); Friedman et al. (2012); Dahmen et al. (2011); Zapperi et al. (1997); Prado and Olami (1992); Kadanoff et al. (1989); Martys et al. (1991); Maimon and Schwarz (2004); Talamali et al. (2011); Zaiser and Nikitas (2007); Bak et al. (1987); Picallo and López (2008). These models are computationally and analytically tractable, but have the limitation that position and stress changes are discrete. Most studies consider scalar order parameters and are in the overdamped, mean-field limit where correlations in deformation are ignored. Then the rate of avalanches of size follows a power law with a universal value of Alava et al. (2006); Dahmen et al. (2011). Strain and stress in deformed solids are tensoral quantities rather than scalars. A recent model shows that this can produce a lower value of Talamali et al. (2011) and produce longe-range spatial correlations in deformation like those found in atomistic simulations Maloney and Robbins (2009). Older models with different rules for site evolution, such as long-term damage to sites, also find that spatial correlations affect the power-law exponents for avalanche statistics Zapperi et al. (1997).
Another limitation of lattice models is the difficulty of including inertia. One common approach is to add rules that lower barriers to motion when an avalanche starts Prado and Olami (1992); Maimon and Schwarz (2004); Dahmen et al. (2009); Friedman et al. (2012); Dahmen et al. (2011). This fits the intuitive picture that inertia can carry a system over successive potential energy barriers, but inertia is highly directional, and decreases the chance of passing over barriers that are not in the direction of the momentum. Lattice models of this type find that inertia fundamentally changes the nature of the depinning transition. All find that inertia introduces hysteresis, with different stresses required to initiate and stop motion Maimon and Schwarz (2004); Schwarz and Fisher (2001); Dahmen et al. (2009); Prado and Olami (1992). Most predict the transition becomes first orderSchwarz and Fisher (2001); Dahmen et al. (2009); Prado and Olami (1992), but a hysteretic second order has also been proposed Maimon and Schwarz (2004). Experimental evidence for hysteresis and a first order depinning transition has been reported for granular media and sandpiles Held et al. (1990); Jaeger et al. (1989).
Many other expermients have reported a continuous second order transition with critical scaling in plastically deformed disordered solids, including granular packings, colloidal glasses, foams and metallic glasses Schall et al. (2007); Utter and Behringer (2004, 2008); Hayman et al. (2011); Miller et al. (1996); Wu et al. (2008); Xing et al. (2001); Jang et al. (2011); Jang and Greer (2010); Bretz et al. (2006). The longest range of scaling is for earthquakes, where the conversion of the magnitude on the Richter scale to the energy or moment is complicated, but gives .Scholz (2002) Studies of granular media have found values of that are to Bretz et al. (2006); Hayman et al. (2011), or as small as Baldassarri et al. (2006); Bretz et al. (2006); Behringer . Sun and coworkers have reported results from deformation of bulk metallic glasses, finding avalanche distribution exponents between and Sun et al. (2010, 2012). The variation in laboratory measurements reflects the difficulty in detecting events with a wide range of sizes. In addition, it is difficult to vary the rate, system size, and other experimental parameters that cut off the largest events and influence the apparent exponent Friedman et al. (2012). Simulations allow full analysis of these effects.
Particle-based simulations of plastic deformation provide more realistic microscopic detail than lattice models but are also computationally more intensive. Early simulations of bubbles in the overdamped limit found a power-law distribution of rearrangements with exponent Tewari et al. (1999); Durian (1997). Maloney and Lemaître found similar scaling using energy-minimization dynamics for quasi-static shear of a model two-dimensonal glass, but appeared to decrease from 0.7 to 0.5 with increasing system size Maloney and Lemaître (2004). They also found that the size of the largest avalanche increased with system size, as expected at a critical depinning transition. A power law increase in event size was seen in later simulations of a similar two-dimensional model by Lerner and Procaccia Lerner and Procaccia (2009) and three diemensional simulations of a more realistic model of amorphous metals by Bailey et al. Bailey et al. (2007). The computational studies described above have all been on systems of about particles or less, restricting the range of power law scaling, and making difficult to measure.
In a recent paper, we examined scaling of avalanches in two-dimensional systems with more than a million particles. This allowed and other critical exponents to be determined as a function of damping. The results showed that the depinning transition remained second order in the underdamped limit, but that the universality class changed with damping. The current paper expands our studies of two dimenional systems and extends them to three dimensions. All simulations are performed in the athermal quasi-static limit, but with varying levels of damping to change the role of inertia in the system. Finite-size scaling is used to develop scaling relations between critical exponents and analyze data from systems with thousands to millions of particles.
We find that inertia leads to the same three universality classes in two and three dimensions. Some of the exponents, including , are independent of dimension. In the overdamped limit, is close to the value of 1.25 obtained in a recent lattice model that includes directional stress transfer Talamali et al. (2011), and less than the value of 1.5 obtained for scalar lattice models Friedman et al. (2012); Dahmen et al. (2011, 2009). In the underdamped limit, is also near 1.25, but the distribution of stress drops can exhibit a higher apparent exponent. The most dramatic effect of inertia is to increase prevalence of large avalanches. The magnitude of the largest events grows more rapidly with system size and the avalanche distribution has a plateau at large magnitudes. The longest range of scaling is observed for the crossover damping that separates these two regimes. The energy scales with for more than 5 decades.
There is no evidence of the hysteresis predicted by lattice models of inertia Dahmen et al. (2009, 2011); Schwarz and Fisher (2003); Maimon and Schwarz (2004); Schwarz and Fisher (2001); Marchetti (2005). The range of stresses sampled during quasistatic motion shrinks to zero with increasing system size. In the overdamped limit, stress fluctuations decrease as the inverse square root of the number of particles. Stress fluctuations drop more slowly in the underdamped limit, where they are determined by the size of the largest avalanches. In all cases, the rise in maximum avalanche size with system size reduces the rate of small avalanches, which scales sublinearly with system size. Both effects may be useful in analyzing the effective size of elemental deformations in experimental systems.
The relationship between the change in shear stress, energy dissipation and plastic deformation during individual avalanches is studied in detail. The drop in stress and the energy dissipated are uncorrelated for small events, but become linearly related for the larger events that exhibit critical scaling. The spatial size of avalanches is proportional to the energy dissipated. This provides evidence that bigger avalanches spread over a larger area rather than producing greater local strains in the deformed region.
An outline of the remainder of the paper is as follows: The second section of the paper details the system studied, including the particle interactions, damping, and the protocol for reaching the quasi-static limit in simulations with inertia. The third section of the paper presents results for the effect of inertia on the energies and stresses sampled during shear, the rate of avalanches, critical scaling exponents, and the relation between the energy dissipated, stress change and plastic deformation associated with each avalanche. Finally, the fourth section presents a discussion and summary of the findings.
II Methods
This paper presents results from molecular dynamics (MD) simulations of deformed disordered solids in two and three dimensions. In all cases, the system studied is a binary glass. The two species of particles A and B both have mass but have different diameters to prevent crystallization. The particles interact via a smoothed Lennard-Jones (LJ) potential, which depends only on the magnitude of the vector between two particles and their species. This potential keeps the standard LJ form at small distances:
| (1) |
where is the characteristic energy, is an energy offset, and is the interaction length between particles of type I and J. The particle interaction length is taken as the fundamental unit of length The particle interaction length while the mixed interaction length Outside the LJ region the potential has a polynomial form
| (2) |
with coefficients chosen so that the energy, force and the derivative of the force match the LJ form at the inner cutoff radius, , and go to zero at an outer cutoff radius, . For these cutoff radii the binding energy of a single bond is about 0.5 . The strength of the interaction, particle radius, and mass set the fundamental unit of time, Simulations were performed with the LAMMPS MD simulation code, using a velocity Verlet integration algorithm with an integration timestep Plimpton (1995).
Two dimensional systems are initialized by placing particles at random in a square periodic simulation cell with the ratio of the number of particles of species A and B: . Next, the system is heated well above the glass transition temperature and then quenched to zero temperature at constant pressure. The pressure is chosen to be near zero but slightly compressive. The results are insensitive to the precise value. Following this procedure, the system density is and the square simulation box has period L. We consider five box sizes with and . These sizes correspond to to particles.
A similar equilibration protocol is followed for three dimensions. After equilibration the density is and the simulation is a cube with period L. Sizes are and , corresponding to to particles.
After the quench process, the samples are strained. The periodic boundary conditions are changed, and a corresponding affine displacement is applied to the position of each particle. The deformation applied to the simulation box in two dimensions is a pure shear strain at a true strain rate . In three dimensions the system volume is conserved by applying an axisymmetric compressive strain-rate in two dimensions (x and y) and an extensional strain rate in the third direction (z).
Our aim is to study the athermal limit, which requires constantly removing kinetic energy from the simulation. A viscous drag force is applied to damp particle motion. The drag force has the form where is the peculiar velocity, with displacement due to the affine deformation subtracted. The dissipation rate plays a central role in our simulations by controlling the relative importance of the inertial term in the particle equations of motion. As decreases, the dynamics changes from overdamped to underdamped (inertial) dynamics.
Generically, a strained disordered solid will load elastically for some strain interval and then plastically deform, decreasing the stress in the system and releasing stored elastic energy as kinetic energy. These sudden bursts of particle motion are termed avalanches. In the quasi-static limit the series of elastic loading segments and plastic deforming avalanche events should be independent of strain rate and depend only on the total strain interval. One way to realize this limit is to deform the system at a very low rate, so that the kinetic energy from one avalanche has been dissipated long before the system has been strained enough to nucleate the next avalanche. Since the rate must be set low enough to prevent overlap of the closest events, this is not computationally feasible for all system sizes and damping rates. Instead, we implement a protocol where the system is strained at a finite strain rate, which is then reduced to zero when an avalanche is detected.
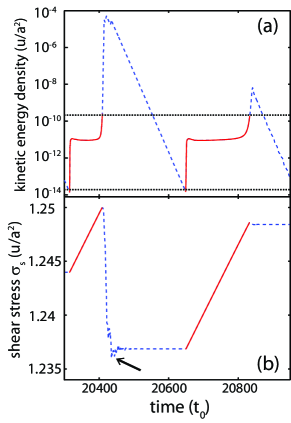
A representative strain-avalanche-strain interval, shown in Fig.1, illustrates how the system evolves with this quasi-static avalanche detection scheme. When the system is deformed, the non-affine response due to heterogeneity in the solid produces a small background kinetic energy density, . This kinetic energy is nearly constant during elastic loading at constant strain rate (solid lines). When an avalanche starts, there is a sharp rise in kinetic energy. The strain rate is reduced to zero when the kinetic energy exceeds by roughly two orders of magnitude. The straining of the solid resumes when the kinetic energy has fallen below by at least two orders of magnitude. We have checked that the strain rate chosen is low enough that the results are not sensitive to these thresholds.
The stress response of the system illustrated in Fig. 1b is typical, showing linear behavior during the strain interval, followed by a rapid drop during an avalanche event. During avalanches with low particle damping the stress often overshoots the steady-state value which is used to quantify the size of avalanches. This overshoot complicates analysis of simulations at constant strain rate.
Even after eliminating the connection between strain rate and avalanche duration, there is still the problem of the very long duration of large avalanches at very low damping rates. As the damping coefficient becomes small and events become large, the peak kinetic energy in the system approaches per unit area (volume). At our prescribed strain rates there is then a factor of between the maximum kinetic energy and the kinetic energy during straining. This energy must be removed by the viscous drag force and one can estimate that for the smallest damping rates we simulate, , the decay of the kinetic energy will take a time of about . This is not only computationally expensive, but unnecessary. Even for our largest system sizes the time for sound waves to propagate across the system, is much smaller. Underdamped systems seldom show signs of further instability, such as kinetic energy spikes or stress drops, after about .
In order to expedite draining the system of kinetic energy when we quench the kinetic energy rapidly once a threshold has been reached. Our criterion is that when the kinetic energy in the system has fallen to about times the peak kinetic energy the avalanche is effectively over and no other instabilities will be activated. For the viscous damping force discussed above, this is equivalent to a time criterion since the decay of the kinetic energy in the system is exponential. For comparison, the time for this decrease in kinetic energy is still roughly ten times larger than the timescale for sound to propagate across the largest simulation cell (). It is also much larger than the time for the stress to reach its steady-state value (Fig. 1), indicating an event is over.
In order to verify that the quench procedure does not affect system evolution, we compared it to simulations with constant damping. For a subset of avalanches simulated with both the ”quench” protocol and fixed damping rate, the total energy dissipated differed by less than . This is orders of magnitude smaller than the smallest avalanches recorded, which have energy . We conclude that the quench protocol produces a system in the same local potential energy minimum as the unquenched simulation.
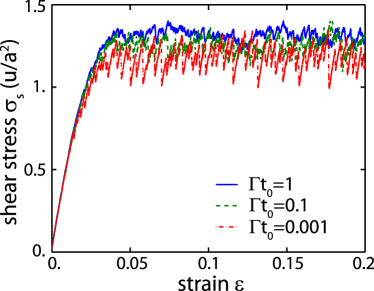
Typical two-dimensional stress-strain loading curves are shown in Fig. 2. Curves for three dimensional systems are similar. For all damping rates the systems reach steady-state after roughly 5% strain. There is a small drift in the hydrostatic pressure at larger strains, but quantities of interest like the shear stress and avalanche statistics become stationary and do not evolve with strain. Only avalanches at strains greater than 7% are included below.
Generically, the elastic energy density stored in a system by a differential strain is where is the stress tensor, and summation over repeated indices is implied. Because the 2D strain geometry is pure shear, this can be simplified by defining and . The stored elastic energy density is then
| (3) |
The elastic strain energy in three dimensions has the same form if one defines and .
III Results
III.1 Time Dependence of Stress and Energy
This section illustrates some of the dramatic effects that inertia has on the mean of and fluctuations in the shear stress and potential energy density in steady-state, quasi-static shear. One limiting case is the overdamped (large ) regime, where the potential energy decreases monotonically to the next minimum during each avalanche. In the opposite, underdamped limit, there is negligible damping during plastic rearrangement, and inertia can carry the system over successive small energy barriers. We present typical results from these limiting regimes with damping rates and , respectively. Ref. Salerno et al. (2012) identified a critical intermediate damping rate of that separates these regimes. We find that this crossover damping rate is the same in 2D and 3D within our uncertainty.
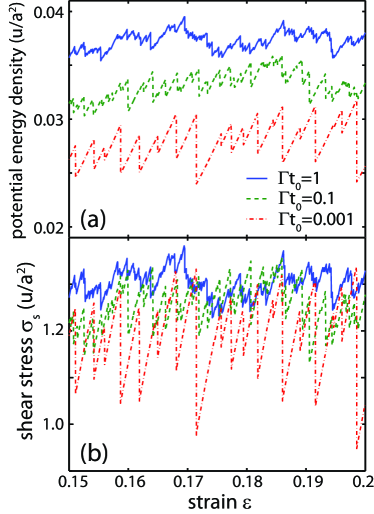
Figure 3 illustrates how damping affects the potential energy density and stress. Note that systems with different damping rates sample completely different potential energy landscapes with almost no overlap. Differences of approximately 30% in the mean value of the potential energy density persist in our largest system sizes in two dimensions. There is a smaller but significant change of about 10% in the mean stress. In three dimensions the mean potential energy in the overdamped and underdamped limits varies by about 8% and the stress by 6%. As the damping decreases, inertia is able to carry the system over barriers in the potential energy landscape to progressively lower minima. In addition to reducing the mean potential energy, inertia leads to larger avalanches. The increase in the size of energy and stress drops is evident in Fig. 3 and related to changes in scaling exponents discussed below.
As illustrated in Fig. 3, the evolution of the stress and potential energy density is characterized by linear rises, where elastic energy is stored, and sudden drops during avalanches. Each avalanche can be characterized by the potential energy density drop and stress drop In what follows we want to compare avalanches of the same absolute size in systems of different linear dimension . We define absolute measures of energy and stress drop as
| (4) |
The shear modulus and the steady-state shear stress are introduced so that both and have units of energy. We have found that both and are nearly independent of system size and relatively insensitive to damping rate.
With these normalizations, energy conservation imposes a sum rule:
| (5) |
where the sum is over all avalanches in the steady-state regime. This connection has been noted previously by Lerner and Procaccia Lerner and Procaccia (2009) and is derived in Appendix A.
The sum rule in Eq. 5 only constrains the sum over all events, but one might expect that something similar to the principle of detailed balance leads to a correlation between and for individual events. This correlation clearly breaks down for small events. Indeed, while E is always positive, can have either sign for small events Lerner and Procaccia (2009). Large events dominate the sums in Eq. 5 and their energy and stress drops are more strongly correlated.
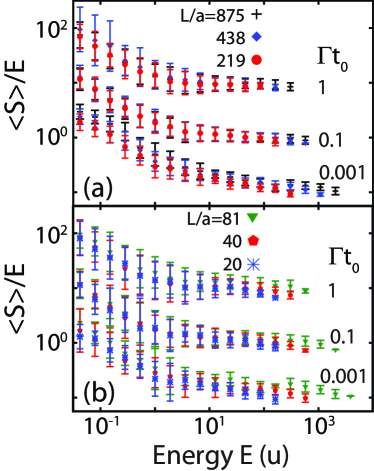
Figure 4 shows how the mean and variation in for events of a given change with avalanche size. Results are normalized by to accentuate deviations from linear behavior and results from different damping rates are offset to prevent overlap. For energies less than a crossover energy the stress drop is much larger than and has large fluctuations. In the overdamped regime this crossover occurs between and for both 2D and 3D, while for the crossover damping regime we estimate the crossover energy to occur between and The presence of large fluctuations and occasional negative drops suggests that events smaller than these crossovers do not necessarily contribute to a release of the imposed shear stress. For energies larger than the crossover energy the mean stress drop is nearly equal to E for the overdamped and crossover damping cases. Only these larger events exhibit critical scaling for both and Fig. 4 implies that and should have the same scaling exponents in this regime.
In the underdamped limit, only approaches unity for the largest events, which move to larger as increases. The sum rule is not violated, but the scaling of avalanches with and may be different. The data can be fit to a power law with over the range , but the prefactor must be dependent so that at the largest events. The deviation from linearity is a natural result of reduced damping and inertia. In the overdamped limit there should be a correspondence between stress and potential energy, as traversing each potential energy barrier dissipates energy. In the underdamped limit potential energy barriers may be surmounted with little energy dissipation, leading to decoupling of the dissipated energy and the stress drop. The implications of this decoupling are discussed further in the section on finite-size scaling.
III.2 Avalanche Distributions
To characterize the different universality classes associated with the three damping regimes we examine the behavior of the avalanche rate distribution. To form this distribution we count the number of avalanche events with energy drop or stress drop during a given strain interval. We define the rate of events as the number of events per unit strain and energy. The rates of events with size and in a system of length are denoted and respectively.
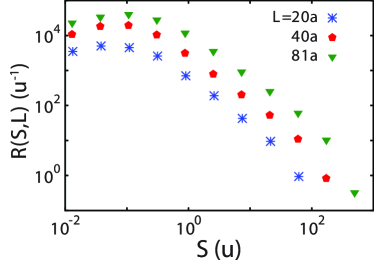
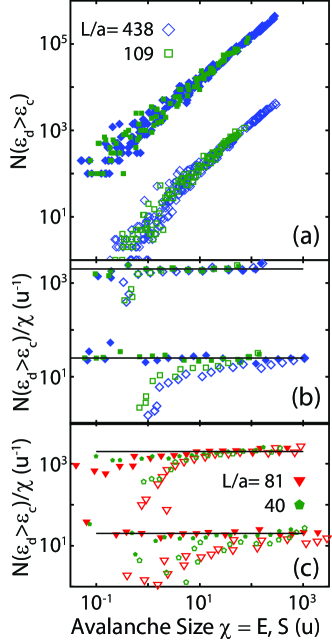
Raw distributions for the overdamped regime in three dimensions are shown in Fig. 5. As expected, the number of events of a given size increases with system size. One might expect the rate of small avalanches to scale with the number of particles, ie as This would be the case if the density of nucleation sites were independent of system size. Many previous studies of avalanche behavior, for example in interface depinning, have found or assumed this extensive scaling Fisher (1998); Martys et al. (1991); Stauffer and Aharony (1994). In contrast, we find subextensive scaling in the avalanche rate distribution for all damping rates in both 2D and 3D.
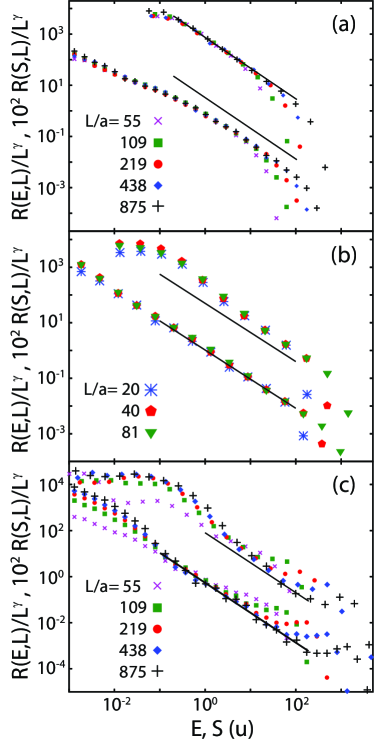
Figure 6 shows and scaled by with chosen to collapse the distributions for and within the critical scaling range. Results for 2D and 3D are similar and only one example is shown for each For different geometries and damping rates both and follow a power-law dependence on avalanche size from up to a maximum size that grows with system size. Note that the nature of the cutoff at large avalanche sizes varies with damping rate. There is a simple rapid decay in the number of large events for the overdamped and crossover cases. For the underdamped case there is an excess of large events that leads to a plateau before the distribution cuts off.
We have already shown in Fig. 4 that and become decorrelated for energy drops smaller than a crossover energy. The distributions and also differ below this scale and only follow critical scaling for larger events. For underdamped systems, and both show dependent saturation below and , respectively. For overdamped and crossover systems saturates for while continues to rise as a power law as decreases. At the crossover damping, follows a single power law up to the size dependent cutoff. For overdamped systems there is a change in power law at The exponent for small avalanches is less than unity and varies with system size. Previous simulations Tewari et al. (1999); Maloney and Lemaître (2004); Durian (1997) have also observed this regime, but were too small () to see the critical scaling at large E. Note that results are cut off by system size at giving less than a decade of scaling.
Table 1 lists the values of that give the best collapse of and in the critical scaling region from the crossover energy to the upper cutoff. Quoted uncertainties indicate where deviations between curves for different differ by more than the statistical errors, which are comparable to the symbol size. As noted above, is substantially less than in all cases. This represents a breakdown of hyperscaling. One possibility is that the same local nucleation site is likely to produce a bigger avalanche in larger systems, because there are more surrounding regions to trigger. Another is tied to the growth in the size of the largest events with . These larger avalanches may reduce the probability that a given region can nucleate small events. The size of the largest avalanches increases with decreasing and there is a corresponding drop in
Note that for the overdamped regime the stress distribution shows a larger range of power-law scaling in Fig. 6, while in the crossover and underdamped regimes the energy drop shows a larger range of power-law behavior. The deviation in behavior of and comes from the regions where in Fig. 4. This region extends to larger as increases for underdamped systems. There is a corresponding shift to larger in the start of the scaling regime in
Given the above observations, the most accurate exponents are obtained from in overdamped systems and for crossover and underdamped systems. The difference is only significant for the underdamped case. In fact, the value of recorded for the underdamped regime is substantially different from the previously reported value of in Ref. Salerno et al. (2012). This is because previous analysis had regarded the collapse of with more importance and had considered small events () in the fit. The current collapse puts more emphasis on the quantity and only attempts to collapse the scaling region
The solid lines in Fig. 6 show power-law fits with given in Table 1 and for overdamped systems and for other cases. Parallel lines are drawn near for overdamped systems and for other cases. The results are clearly consistent with power-law scaling over three decades in event size, but the precise limits of the critical region where the slope of the distributions should be fit is difficult to determine using this figure. As in other critical systems, finite-size scaling of results for different provides a better method for determining the range of critical scaling for the avalanche rate distribution Privman (1990); Perković et al. (1999).
III.3 Finite-Size Scaling
The assumption underlying the finite-size scaling procedure is that rather than depending separately on or and , the avalanche rate distributions are a function only of the ratio of avalanche size to a power of the system size Privman (1990). They then obey the scaling ansatz
| (6) |
where is either or and is a scaling function that depends on damping rate and may be different for and . The scaling function decays to zero at large arguments so that there are few avalanches above a largest size that increases with system size as Given the assumption that no smaller energy or length scales are important, must scale as a power law at small arguments:
| (7) |
As shown above, the number of avalanches of a given size scales as for . Combining equations 6 and 7 gives
| (8) |
This gives us our first scaling relation between exponents,
| (9) |
Another scaling relation can be derived from energy balance in steady state. The total work per unit volume per unit strain is just the mean stress Equating the total work done in the entire system to the sum of energy drops in all avalanches one finds:
| (10) |
Inserting the scaling relation and changing variables to one finds:
| (11) |
yielding
| (12) |
Note that the integral in Eq. 11 converges and is insensitive to the lower bound because for all systems. If hyperscaling was obeyed, would imply which is clearly inconsistent with the data.
| d | |||||
|---|---|---|---|---|---|
| 1.0 | 2 | ||||
| 0.1 | 2 | ||||
| 0.001 | 2 | ||||
| 1.0 | 3 | ||||
| 0.1 | 3 | ||||
| 0.001 | 3 |
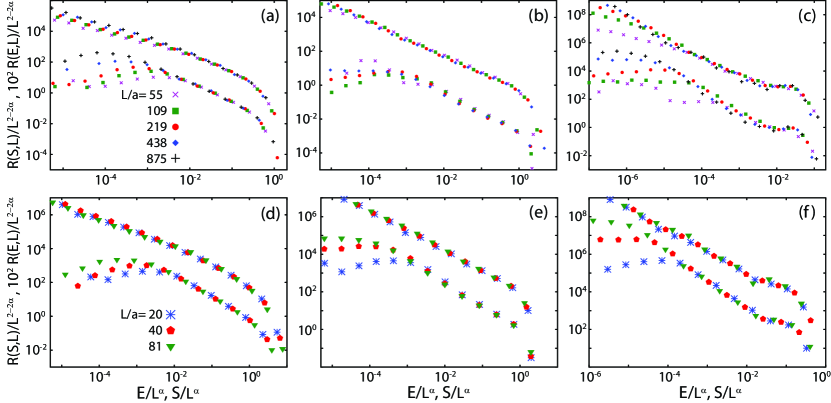
Figure 7 shows finite-size scaling collapses for both the energy and stress drop using the scaling ansatz in Eq. 6, with obeying Eq. 12. The exponent is chosen so that data for large events from different system sizes collapse onto a universal curve that corresponds to the scaling function In all cases the curves deviate from the scaling function at a scaled energy which decreases with increasing The energy of a single bond () is a natural discrete energy scale where the assumption of scale invariance underlying Eq. 6 breaks down. We also considered collapses where was allowed to deviate from the scaling relation in Eq. 12, but found there was no significant improvement. As with the exponent the uncertainties in the value of are determined by varying and finding a range of values over which the collapse is acceptable. This determination utilizes the fact that the symbol sizes in Fig. 7 are comparable to the errorbars.
The exponent listed in Table 1 is found by multiplying the distributions by in order to make the curves flat over the range of energies from to (figures not shown). The uncertainty in the exponent is determined from the range of values over which the distributions appear approximately flat. The values of the exponent given in Table 1 are consistent with the scaling relation Eq. 9 and fit the unscaled data shown in Fig. 6. In the overdamped regime fits to give the smallest uncertainty and in the other cases fits to extend over the longest range. Fits to and only differ significantly for the underdamped case. The slope of is given in Table 1, while the slope of appears larger for both 2D and 3D, closer to for certain energy ranges. This difference in slope can be explained by the features in Fig. 4. Since and are not linearly related, their distributions should also differ slightly, with being steeper. As with the exponent our previous paper Salerno et al. (2012) reported a larger value for This steeper slope reflects a value consistent with the distribution as opposed to
It is clear from the finite-size scaling collapses that dimensionality does not affect the function but that its form changes with damping rate. The form of in the underdamped regime is of particular interest. It displays a characteristic plateau at large avalanche sizes in both two and three dimensions. Such an excess of large avalanches is seen in both earthquakes and experiments on sand Scholz (2002); Held et al. (1990); Baldassarri et al. (2006). An excess of system spanning events has also been seen in the Burridge-Knopoff model. In some versions of that model a consistent finite-size scaling collapse was not found because a high-energy peak separated from the lower part of the distribution Carlson and Langer (1989); Carlson et al. (1991); Carlson (1991). In our system there is a plateau rather than a second peak, and the entire distribution collapses at large scaled energies.
III.4 Spatial Extent of Avalanches
The goal of this section is to relate the spatial extent of the plastic damage produced by avalanches to the corresponding energy and stress drops. This is complicated by the long range of elastic interactions. The simplest type of shear displacement involving a local rearrangement of a few atoms produces elastic strains that decay as where is the distance from the atoms and the dimension Lemaître and Caroli (2009); Maloney and Lemaître (2006); Picard et al. (2004); Tanguy et al. (2006). A threshold must be introduced to distinguish these small elastic strains from the plastic deformations in the central region. Appendix B describes how deviations from the power law decay of strain fields can be used to determine the threshold used in this section. Note that this threshold changes quantitative prefactors in the following discussion, but does not affect any of the general conclusions.
To define strain fields we first find the displacement of each atom during an avalanche. Previous work has emphasized the importance of subtracting any affine component of these displacements that reflects deformation of the box Tanguy et al. (2006); Maloney and Lemaître (2004); Lemaître and Caroli (2007), but this contribution vanishes in our simulation because no strain is imposed during the avalanche. The derivative of the displacement field is calculated by taking a finite difference of displacements on nearby atoms. In two dimensions we form a Delaunay triangulation of the particle positions. A linear fit to the displacements of the particles on the corners of each triangle gives the derivative of the displacement along direction with respect to Maloney and Robbins (2008). The symmetrized strain tensor is then constructed to eliminate the effect of any translation or rotation of the triangle. In three dimensions, the strain is obtained from finite differences on a tetrahedral tiling.
The magnitude of the strain is usually quantified by rotational invariants. The first, the trace of the strain tensor, measures the magnitude of dilational strains. Shear is most simply related to the second deviatoric strain invariant . We define
| (13) |
where is the deviatoric strain tensor In the case of a simple shear strain in the x-y plane, then Triangles or tetrahedra with greater than a threshold value are identified as plastic. Based on the results of Appendix B, we use in both 2D and 3D. This is comparable to the ideal elastic limit in dislocation-free crystals. Similar results are obtained with other thresholds and by using the dilational strain.
Figure 8a shows plots of the number of plastically deformed triangles vs. event size for The data for energy drop (open symbols) have been multiplied by 100. Events in the scaling range () show a linear relation between the event size ( or and area of the plastic deformation. Data for and are similar.
It is not obvious that the spatial extent and energy of events must be proportional. In particular, larger events could be associated with greater dissipation in each spatial region rather than a spread to new regions. To test this we found the average or of events with a given spatial size. Fig. 8b shows the ratio of spatial size to mean energy in the overdamped and underdamped limits. Results for different are offset to avoid overlap. For the overdamped data the spatial size of systems is proportional to both and for events in the scaling region identified in previous sections ( and ). The energy and spatial size are also proportional for the underdamped case. In contrast, results for only asymptote to a linear relation for the largest events, which grow in size as increases. This deviation is further evidence that is the most natural quantity for the finite-size scaling collapses of underdamped systems.
The straight lines drawn in Fig 8b are the best fit for the number of plastically deformed triangles per unit energy. The values are about for the underdamped systems and for the overdamped systems. The constant energy dissipation per unit area is consistent with limited local plasticity and local particle displacements during avalanche events. Such behavior was found in previous 2D simulations, where the total non-affine displacement of particles over strain intervals of was at most Maloney and Robbins (2008). Displacements by a single particle diameter are sufficient to completely change the local forces and thus the shear stress driving further deformation.
Fig. 8c shows that the plastically deformed volume also scales linearly with event energy in three dimensions. As in 2D, the stress drop in underdamped systems is less simply related to the plastic volume. The horizontal lines in Fig. 8(c) indicate that the number of plastic tetrahedra per unit dissipated energy is about for all damping rates. This result and the corresponding value for 2D explain the limit of the scaling region to energies of order and above. At there are only a handful of triangles or tetrahedra that deform plastically. It is natural that the finite size scaling ansatz breaks down and the discreteness of the system becomes important when events involve only a few particles.
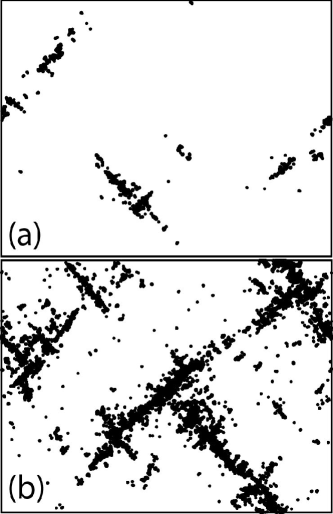
Given the linear relation between energy and the total size of the plastically deformed region, the largest events involve triangles or tetrahedra. This implies that is an effective fractal dimension. Typical examples of large avalanches are shown in Fig. 9. In the overdamped limit avalanches contain a number of disconnected regions that tend to lie along diagonal lines. While the disconnected regions span the system, they are separated by larger gaps and thus the fractal dimension is less than unity. In the underdamped limit, and the deformed region spreads across the system with only small breaks. The clusters are still highly directional with correlations along the diagonals that have been discussed in past studies of continuous and lattice models Maloney and Robbins (2009); Talamali et al. (2011). These striking changes in avalanche geometry with will be discussed in detail in a later paper and represent another qualitative difference between underdamped and overdamped systems that may be readily accessible to experiments.
III.5 Distribution of Stress Values
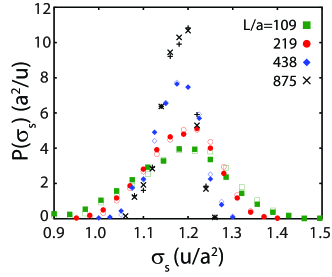
One of the most basic quantities measured in a deformation simulation or experiment is the stress. In this section we consider the distribution of shear stress values values before and after each event, Figure 10 shows the distribution of stress values before (closed symbols) and after (open symbols) avalanches for 2D underdamped systems of different size. The distributions narrow about a limiting mean value as the system size increases. If inertia drove the system away from criticality and the onset of shear was a first order transition with hysteresis, one would expect a gap between the distribution of stresses before and after avalanches. There is no evidence of this separation in our results. Even as they narrow, the distribution of stresses before and after avalanches continue to overlap. For all cases considered, the shift between the two distributions is much smaller than their width. In the following we combine the two distributions to improve our statistics. The distribution of all instantaneous values of stress gives similar results.
One way to describe the variation in with system size is to use a finite-size scaling ansatz similar to Eq. 6 above. The shear stress distribution can be rewritten with a scaling function as
| (14) |
where is the stress value with the system size dependent mean stress, subtracted. The width of the distribution around the mean decreases as with increasing Note that must enter with the same power inside and outside the scaling function in order to preserve the normalization of the probability distribution.
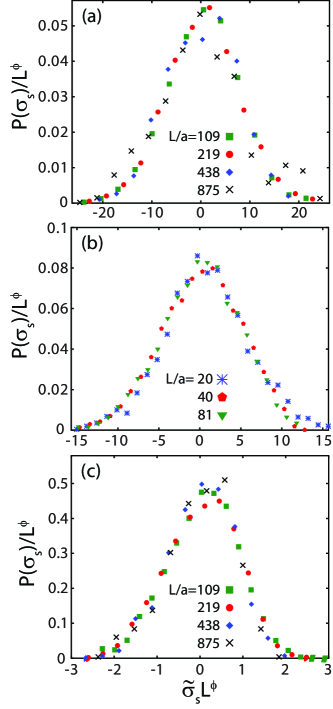
We confirm the scaling form for the shear stress probability distributions given in Eq. 14 by finding values of which collapse results for the various system sizes and damping rates. Three such collapses are plotted in Fig. 11, while the best-fit values of for all systems simulated are listed in Table 1.
Two upper bounds on the value of may be set. If there were an incoherent addition of stress from different regions with no correlations in time or space, one would expect the width of the distribution to scale as the inverse square root of the number of independent regions (or particles). This yields a relation or Correlations could make fluctuations decay more slowly with L, so that is an upper bound for The width of the distribution must also be at least as large as the stress change due to the largest avalanches, which are of order This implies that
The values of listed in Table 1 satisfy the above bounds in all cases in 2D and 3D, and is comparable to the smallest bound, The 2D overdamped and critically damped systems have . In 3D it is clear that for the overdamped systems is greater than the bound, and Finally, in the underdamped regime in 2D and in 3D, and in both cases The crossover from to is equivalent to the crossover from positive to negative indicating that the rate of events of size is decreasing, or the strain interval between such events is increasing. It appears that at this crossover, the events at begin to dominate and set the width of the stress distribution.
The conclusion that the largest events can set the width of the stress distribution seems inconsistent with Fig. 10. There we found that the distributions of stresses before events and after events were nearly the same. The resolution of this discrepancy is that most events are small and can occur at any stage of the loading. The mean and standard deviation of the stresses before and after small events are indistinguishable from the global distribution.
For systems with even the largest events have a similar distribution. This is evident in Fig. 3 for the overdamped case where the largest events are smaller than the spread in stress and occur at all stresses. For the underdamped case Fig. 3 is dominated by the large events which seem to have a characteristic scale and time interval. These large events are in the plateau region where the finite-size of the system is important. While they remain the main source of fluctuations in stress for all , the fractional change in shear stress goes to zero as increases, because these largest events increase in size more slowly than .
Studies of depinning often control the driving stress rather than the driving rate Fisher (1998); Martys et al. (1991); Friedman et al. (2012); Alava et al. (2006). There is then a critical exponent relating the distance from the critical stress to the correlation length , corresponding to the linear dimension of the largest avalanches: . While we have performed simulations with constant rate, the fact that the range of stresses scales as suggests that . This relation applies in the limit where the largest avalanches set the range of stress fluctuations, giving . In the case where , stress fluctuations are instead set by uncorrelated fluctuations in the local properties of the system. As pointed out by Pazmandi et al. Pázmándi et al. (1997), does not correspond to the intrinsic for the correlation length in this case.
IV Summary and Discussion
In this paper we have presented a detailed analysis of the dramatic effects inertia has on quasistatic shear deformation of two and three dimensional disordered solids. During the intermittent avalanches of plastic activity, inertia can carry the system over successive energy barriers and thus change the ensemble of states sampled. The most direct evidence for this comes from measurements of the time dependent potential energy density and shear stress (i.e. Fig. 3). Damping changes the mean energy density by about 30% in 2D and 8% in 3D, while the shear stress varies by 8% in 2D and 6% in 3D. Even for relatively small systems, in 2D and in 3D, there is no overlap between the range of energy densities sampled in the underdamped and overdamped limits.
Previous studies of lattice models with rules designed to mimic inertia had predicted profound changes in the nature of the depinning transition with increasing inertia Prado and Olami (1992); Maimon and Schwarz (2004); Dahmen et al. (2009); Friedman et al. (2012); Dahmen et al. (2011). All found that the onset of shear became hysteretic, with different stresses needed to initiate and stop motion. Hysteresis is also present in the recently identified avalanche oscillator transition Papanikolaou et al. (2012). Our simulations of continuous systems show no hysteresis. In all cases the range of shear stresses and energy densities sampled during quasistatic shear goes to zero with increasing system size. The depinning transition is always continuous and a power law distribution of avalanches is observed even in the underdamped limit. However, the scaling exponents are different in underdamped and overdamped limits.
Avalanches were characterized by the total energy dissipated and an extensive quantity proportional to the stress drop, which is more easily measured in experiments. A sum rule based on conservation of energy requires that the sums over all avalanches of and are equal, but does not relate the two quantities for individual events. Indeed, is always positive, while can be negative in small systems Lerner and Procaccia (2009). At sufficiently high energies, and become correlated and exhibit the same critical scaling. For high damping this threshold is a fraction of a single particle bond energy, but the correlation moves to higher energies in the underdamped limit. For smaller events, the distribution of energies (not stresses) can exhibit power law scaling over several decades in that is not related to the critical behavior of larger avalanches. Past simulations used smaller system sizes where these noncritical avalanches dominated the statistics, making it difficult to determine scaling exponents Lerner and Procaccia (2009); Bailey et al. (2007); Maloney and Lemaître (2004).
Finite-size scaling relations for the rate of avalanches of a given size in a system of length were developed and used to determine scaling exponents as a function of damping. As in our earlier 2D studies, we find three universality classes corresponding to overdamped and underdamped limits and something analogous to a multicritical point at a crossover damping that separates them. Table 1 summarizes the numerical results for the scaling exponents.
One surprising aspect of the results is that the rate of small events is not proportional to the system size. If the probability that a local region would nucleate a small event was independent of system size, then the rate of small events would grow as . The observed rate grows as with significantly less than . One possibility is that local configurations that would only produce a small avalanche in a small system can trigger a string of other instabilities in a larger system. The long-range power law decay of elastic interactions makes it more likely that they can affect scaling exponents in this way. The size of the largest avalanches grows with system size, and it is also possible that these largest avalanches lower the number of nucleation sites for small avalanches. The difference between and for all damping regimes in two and three dimensions represents a violation of hyperscaling. To our knowledge, values of have not been reported for lattice models, but the restriction to discrete changes on discrete lattice sites may lead to different scaling.
The scaling exponent reflects the growth the of the largest avalanches with system size Values of in all systems are found to be less than spatial dimension . In the overdamped limit is slightly lower than unity in 2D and slightly larger than unity in 3D. Previous simulations of smaller overdamped systems (less than 20,000 particles) reported Maloney and Lemaître (2004) or Lerner and Procaccia (2009) in 2D, and about in 3D Bailey et al. (2007), but with significant uncertainties and poor collapses at the largest energies. Lattice models of overdamped avalanches that include the tensoral nature of shear stress find Zaiser and Nikitas (2007); Talamali et al. (2011). This is quite close to our simulation results, while scalar models predict Dahmen et al. (2009); Fisher et al. (1997). The large difference in predictions for make it a useful quantity to measure in future experiments, but we know of no existing studies. As noted above, is effectively a fractal dimension for the plastically deformed region which is generally disconnected and strongly anisotropic Maloney and Lemaître (2006); Maloney and Robbins (2009)
The largest avalanches grow much more rapidly with system size in the underdamped limit, and in 2D and 3D, respectively. As a result, these large avalanches dominate the fluctuations in instantaneous stress values, which scale as with . Plots of the evolution of stress with time are dominated by these large events. In the overdamped regime, , indicating that fluctuations are dominated by uncorrelated variations in interactions and geometry as the configuration of particles evolves.
Studies of avalanche statistics in slowly driven systems have generally focussed on the exponent that describes the decrease in event rate with event size: . Our simulations reveal similar values of for both underdamped and overdamped limits in 2D and 3D. The crossover damping has a lower value of . Direct fits of power laws over at least 3 decades are consistent with exponents obtained from finite-size scaling relations. The only discrepancy is for scaling of stress drops in the underdamped limit. In this case, the stress drop rises less rapidly than the energy up to the size of the largest avalanches. This may be because inertia is more likely to carry the system past barriers that lead to a lowering in stress than energy. The result is an apparent of about 1.5 over a limited range of stress drops and a poorer finite-size scaling collapse. The fact that and are different in the underdamped limit may have implications for experimental studies where stress or slip displacements are often more directly accessible than energy.
Lattice models of overdamped dynamics that treat strain as a scalar variable predict a universal value of that is clearly inconsistent with our scaling relations. A recent model that includes the directional nature of stress transfer yields a consistent value of about 1.25 Talamali et al. (2011). As noted above, lattice models predict hysteresis in the underdamped limit. This is inconsistent with our results, but the hysteresis is related to a discrete change from inertia and local rearrangements produce discrete drops in strain. It would be interesting to explore the effect that continuous changes from inertia and/or in local stress would have on scaling in lattice models.
A critical review of experimental results for is beyond the scope of this paper, but the wide range of reported values reflects systematic uncertainties in measuring avalanches and analyzing their statistics. In many cases experiments are not in the steady state regime considered here, but collect avalanche statistics at small strains during the transition from the inital elastic response to yield (i.e. in Fig. 2). We find that this initial region is sensitive to preparation and exclude it from our analysis. In most cases the range of avalanche sizes is only one to two decades. Uncertainties in the limits of the scaling regime due to finite system size, finite temperature Hentschel et al. (2010), distance from the critical stress Friedman et al. (2012) and experimental noise lead to uncertainties that are greater than the difference between and 1.25. The finite-size scaling method used here eliminates such systematic effects, but is difficult to replicate in experiments.
Earthquake statistics cover the largest range of event sizes, but involve a wide range of phenomena that are not included in simple models like ours Scholz (2002). Just one example is the finite thickness (km) of the active region of the crust. There is a transition in the effective dimension of earthquake displacements as the size of the slipping region grows past this scale Pacheco et al. (1992); Shaw (2009). Seismologists also treat successive displacements along different faults as separate events, even though there is evidence that they are causally connected. Our quasistatic simulations group together all plastic activity resulting from an initial instability even if the activity occurs in widely separated regions and is separated by long quiescent periods. These long quiescent periods do not occur in lattice models where changes in local strain are discrete. We are currently evaluating methods of separating our avalanches into separate events, and initial results suggest the effective value of could increase in the overdamped limit where quiescent periods are more common.
Given the difficulties in determining precise values of , it becomes interesting to consider the qualitative difference in the scaling function for overdamped and underdamped systems. Models and experiments on overdamped systems generally find a simple exponential cutoff for large events Maloney and Lemaître (2004); Bailey et al. (2007); Lerner and Procaccia (2009); Pratt and Dennin (2003); Lauridsen et al. (2002). In contrast, studies of earthquakes statistics for single faults often find an excess of large system spanning events that is similar to the plateau seen in our underdamped simulations. Plateaus of this type are also evident in experimental studies of steady shear in glass bead packs Baldassarri et al. (2006). Future experiments that focus on the form of the scaling function and the fractal dimension of the largest avalanches may provide the most sensitive means of detecting inertial effects and testing theoretical models.
Acknowledgements.
This work was supported by the National Science Foundation under Grants No. DMR-1006805, IGERT 0801471, CMMI-0923018, and OCI-0963185. MR acknowledges support from the Simons Foundation.References
- Martys et al. (1991) N. Martys, M. O. Robbins, and M. Cieplak, Phys. Rev. B, 44, 12294 (1991a).
- Perkovic et al. (1995) O. Perkovic, K. Dahmen, and J. P. Sethna, Physical Review Letters, 75, 4528 (1995).
- Myers and Sethna (1993) C. R. Myers and J. P. Sethna, Phys. Rev. B, 47, 11171 (1993).
- Miguel et al. (2001) M. C. Miguel, A. Vespignani, S. Zapperi, J. Weiss, and J. R. Grasso, Nature, 410, 667 (2001).
- Friedman et al. (2012) N. Friedman, A. T. Jennings, G. Tsekenis, J.-Y. Kim, M. Tao, J. T. Uhl, J. R. Greer, and K. A. Dahmen, Phys. Rev. Lett., 109, 095507 (2012a).
- Chan et al. (2010) P. Y. Chan, G. Tsekenis, J. Dantzig, K. A. Dahmen, and N. Goldenfeld, Phys. Rev. Lett., 105, 015502 (2010).
- Baldassarri et al. (2006) A. Baldassarri, F. Dalton, A. Petri, S. Zapperi, G. Pontuale, and L. Pietronero, Phys. Rev. Lett., 96, 118002 (2006).
- Zapperi et al. (1997) S. Zapperi, A. Vespignani, and H. E. Stanley, Nature, 388, 658 (1997).
- Zapperi et al. (2005) S. Zapperi, C. Castellano, F. Colaiori, and G. Durin, Nature Physics, 1, 46 (2005), ISSN 1745-2473.
- Sethna et al. (2001) J. P. Sethna, K. a. Dahmen, and C. R. Myers, Nature, 410, 242 (2001), ISSN 0028-0836.
- Dahmen et al. (2009) K. A. Dahmen, Y. Ben-Zion, and J. T. Uhl, Phys. Rev. Lett., 102, 175501 (2009).
- Schwarz and Fisher (2003) J. M. Schwarz and D. S. Fisher, Phys. Rev. E, 67, 021603 (2003).
- Prado and Olami (1992) C. P. C. Prado and Z. Olami, Phys. Rev. A, 45, 665 (1992).
- Marchetti (2005) M. C. Marchetti, Pramana, 64, 1097 (2005).
- Alava et al. (2006) M. J. Alava, P. K. V. V. Nukala, and S. Zapperi, Advances in Physics, 55, 349 (2006).
- Cizeau et al. (1997) P. Cizeau, S. Zapperi, G. Durin, and H. Stanley, Physical Review Letters, 79, 4669 (1997), ISSN 0031-9007.
- Dahmen et al. (2011) K. Dahmen, Y. Ben-Zion, and J. T. Uhl, Nature Physics, 7, 554 (2011).
- Kadanoff et al. (1989) L. Kadanoff, S. Nagel, L. Wu, and S.-m. Zhou, Physical Review A, 39, 6524 (1989), ISSN 0556-2791.
- Maimon and Schwarz (2004) R. Maimon and J. M. Schwarz, Phys. Rev. Lett., 92, 255502 (2004).
- Talamali et al. (2011) M. Talamali, V. Petäjä, D. Vandembroucq, and S. Roux, Phys. Rev. E, 84, 016115 (2011).
- Zaiser and Nikitas (2007) M. Zaiser and N. Nikitas, Journal of Statistical Mechanics: Theory and Experiment, 2007, P04013 (2007), ISSN 1742-5468.
- Bak et al. (1987) P. Bak, C. Tang, and K. Wiesenfeld, Physical Review Letters, 59, 381 (1987), ISSN 0031-9007.
- Picallo and López (2008) C. B. Picallo and J. M. López, Physical Review E, 77, 046114 (2008), ISSN 1539-3755.
- Maloney and Robbins (2009) C. Maloney and M. Robbins, Phys. Rev. Lett., 102, 225502 (2009).
- Schwarz and Fisher (2001) J. M. Schwarz and D. S. Fisher, Phys. Rev. Lett., 87, 096107 (2001).
- Held et al. (1990) G. A. Held, D. H. Solina, H. Solina, D. T. Keane, W. J. Haag, P. M. Horn, and G. Grinstein, Phys. Rev. Lett., 65, 1120 (1990).
- Jaeger et al. (1989) H. M. Jaeger, C. Liu, and S. R. Nagel, Phys. Rev. Lett., 62, 40 (1989).
- Schall et al. (2007) P. Schall, D. A. Weitz, and F. Spaepen, Science (New York, N.Y.), 318, 1895 (2007).
- Utter and Behringer (2004) B. Utter and R. P. Behringer, Phys. Rev. E, 69, 031308 (2004).
- Utter and Behringer (2008) B. Utter and R. P. Behringer, Phys. Rev. Lett., 100, 208302 (2008).
- Hayman et al. (2011) N. W. Hayman, L. Ducloué, K. L. Foco, and K. E. Daniels, Pure and Applied Geophysics, 168, 2239 (2011).
- Miller et al. (1996) B. Miller, C. O’Hern, and R. P. Behringer, Phys. Rev. Lett., 77, 3110 (1996).
- Wu et al. (2008) F. Wu, Z. Zhang, J. Shen, and S. Mao, Acta Materialia, 56, 894 (2008).
- Xing et al. (2001) L.-Q. Xing, Y. Li, K. T. Ramesh, J. Li, and T. C. Hufnagel, Phys. Rev. B, 64, 180201 (2001).
- Jang et al. (2011) D. Jang, C. T. Gross, and J. R. Greer, International Journal of Plasticity, 27, 858 (2011).
- Jang and Greer (2010) D. Jang and J. R. Greer, Nature materials, 9, 215 (2010).
- Bretz et al. (2006) M. Bretz, R. Zaretzki, S. B. Field, N. Mitarai, and F. Nori, Europhysics Letters (EPL), 74, 1116 (2006), ISSN 0295-5075.
- Scholz (2002) C. H. Scholz, The mechanics of earthquakes and faulting (Cambridge University Press, 2002) ISBN 9780521655408.
- (39) R. Behringer, Private communication.
- Sun et al. (2010) B. A. Sun, H. B. Yu, W. Jiao, H. Y. Bai, D. Q. Zhao, and W. H. Wang, Phys. Rev. Lett., 105, 035501 (2010).
- Sun et al. (2012) B. Sun, S. Pauly, J. Tan, M. Stoica, W. Wang, U. Kühn, and J. Eckert, Acta Materialia, 60, 4160 (2012), ISSN 1359-6454.
- Friedman et al. (2012) N. Friedman, A. T. Jennings, G. Tsekenis, J.-Y. Kim, M. Tao, J. T. Uhl, J. R. Greer, and K. A. Dahmen, Phys. Rev. Lett., 109, 095507 (2012b).
- Tewari et al. (1999) S. Tewari, D. Schiemann, D. J. Durian, C. M. Knobler, S. A. Langer, and A. J. Liu, Phys. Rev. E, 60, 4385 (1999).
- Durian (1997) D. J. Durian, Phys. Rev. E, 55, 1739 (1997).
- Maloney and Lemaître (2004) C. Maloney and A. Lemaître, Phys. Rev. Lett., 93, 016001 (2004a).
- Lerner and Procaccia (2009) E. Lerner and I. Procaccia, Phys. Rev. E, 79, 066109 (2009).
- Bailey et al. (2007) N. P. Bailey, J. Schiøtz, A. Lemaître, and K. W. Jacobsen, Phys. Rev. Lett., 98, 095501 (2007).
- Plimpton (1995) S. Plimpton, Journal of Computational Physics, 117, 1 (1995).
- Salerno et al. (2012) K. Salerno, C. Maloney, and M. Robbins, Physical Review Letters, 109, 105703 (2012).
- Fisher (1998) D. S. Fisher, Physics reports, 301, 113 (1998).
- Stauffer and Aharony (1994) D. Stauffer and A. Aharony, Introduction To Percolation Theory (Taylor & Francis, 1994) ISBN 9781420074796.
- Privman (1990) V. Privman, Finite Size Scaling and Numerical Simulation of Statistical Systems (World Scientific Publishing Company, Incorporated, 1990) ISBN 9789810237967.
- Perković et al. (1999) O. Perković, K. A. Dahmen, and J. P. Sethna, Phys. Rev. B, 59, 6106 (1999).
- Carlson and Langer (1989) J. M. Carlson and J. S. Langer, Phys. Rev. Lett., 62, 2632 (1989).
- Carlson et al. (1991) J. M. Carlson, J. S. Langer, B. E. Shaw, and C. Tang, Phys. Rev. A, 44, 884 (1991).
- Carlson (1991) J. M. Carlson, Phys. Rev. A, 44, 6226 (1991).
- Lemaître and Caroli (2009) A. Lemaître and C. Caroli, Phys. Rev. Lett., 103, 065501 (2009).
- Maloney and Lemaître (2006) C. E. Maloney and A. Lemaître, Phys. Rev. E, 74, 016118 (2006).
- Picard et al. (2004) G. Picard, A. Ajdari, F. Lequeux, and L. Bocquet, The European physical journal. E, Soft matter, 15, 371 (2004).
- Tanguy et al. (2006) A. Tanguy, F. Leonforte, and J.-L. Barrat, The European physical journal. E, Soft matter, 20, 355 (2006).
- Maloney and Lemaître (2004) C. Maloney and A. Lemaître, Phys. Rev. Lett., 93, 195501 (2004b).
- Lemaître and Caroli (2007) A. Lemaître and C. Caroli, Phys. Rev. E, 76, 036104 (2007).
- Maloney and Robbins (2008) C. E. Maloney and M. O. Robbins, Journal of Physics: Condensed Matter, 20, 244128 (2008).
- Martys et al. (1991) N. Martys, M. Cieplak, and M. O. Robbins, Phys. Rev. Lett., 66, 1058 (1991b).
- Pázmándi et al. (1997) F. Pázmándi, R. T. Scalettar, and G. T. Zimányi, Phys. Rev. Lett., 79, 5130 (1997).
- Papanikolaou et al. (2012) S. Papanikolaou, D. M. Dimiduk, W. Choi, J. P. Sethna, M. D. Uchic, C. F. Woodward, and S. Zapperi, Nature, 490, 517 (2012), ISSN 1476-4687.
- Fisher et al. (1997) D. S. Fisher, K. Dahmen, S. Ramanathan, and Y. Ben-Zion, Phys. Rev. Lett., 78, 4885 (1997).
- Hentschel et al. (2010) H. G. E. Hentschel, S. Karmakar, E. Lerner, and I. Procaccia, Phys. Rev. Lett., 104, 025501 (2010).
- Pacheco et al. (1992) J. F. Pacheco, C. H. Scholz, and L. R. Sykes, Nature, 355, 71 (1992), ISSN 0028-0836.
- Shaw (2009) B. E. Shaw, Bulletin of the Seismological Society of America, 99, 871 (2009), http://www.bssaonline.org/content/99/2A/871.full.pdf+html .
- Pratt and Dennin (2003) E. Pratt and M. Dennin, Phys. Rev. E, 67, 051402 (2003).
- Lauridsen et al. (2002) J. Lauridsen, M. Twardos, and M. Dennin, Phys. Rev. Lett., 89, 098303 (2002).
- Tsamados et al. (2009) M. Tsamados, A. Tanguy, C. Goldenberg, and J.-L. Barrat, Phys. Rev. E, 80, 026112 (2009).
- Maloney (2006) C. E. Maloney, Phys. Rev. Lett., 97, 035503 (2006).
Appendix A Sum Rule Derivation
The sum rule in Eq. 5 follows from energy conservation. Each avalanche event, is accompanied by a potential energy density drop and shear stress drop This dissipated energy must be balanced by the work done on the system during segments where the system loads elastically. For a strain segment the work done on the system is .
The assumption that there is a well defined steady-state mean potential energy density allows us to equate the sum of the energy drops with the total work done
| (15) |
where the sum on the left is over all energy drops, and the sum on the right is over all elastic loading segments, which are equal in number.
As shown in Figs. 2, 10 and 11 there is also a well defined steady-state shear stress. Thus we can rewrite Eq. 15 as
| (16) |
introducing corrections proportional to the square of stress fluctuations, which go to zero as in the thermodynamic limit (Table 1). A steady state shear stress also implies that the stress rises during elastic loading balance the stress drops during avalanches over long strain intervals. The stress rise over each elastic interval can be written as where is the shear modulus, so that:
| (17) |
Other workers have found that above a length scale much smaller than our system sizes variations in the modulus between different elastic segments are small Tsamados et al. (2009).
In the main text we measure extensive stress and energy drops and in order to compare avalanches across different system sizes. Combining the relations above with the definitions of and allows us to relate total stress and energy drops
| (18) |
Since the summations are over the same set of avalanche events this also implies that the mean values are equal
Appendix B Distinguishing Plastic and Elastic Regions
As noted in the main text, the strain field around a local local plastic region decays as a power of the distance from the regionLemaître and Caroli (2009); Maloney (2006); Picard et al. (2004); Tanguy et al. (2006). The prefactor should be proportional to the magnitude of the plastic rearrangement, which we find scales as the stress drop. Since the spatial arrangements of plastic regions can be complicated, we consider instead the distribution of local strain values . From the scaling of the phase space with distance , we have Then the distribution of local strains scales as a power law in two and three dimensions
| (19) |
The cumulative distribution function (CDF) of strains larger than scales as:
| (20) |
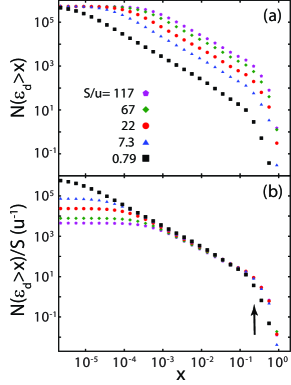
Figure 12(a) shows the averaged over avalanche events of a given stress drop . Events with damping rate are shown, and curves for other damping rates are similar. Above a minimum strain that grows with , each curve follows the power law scaling predicted by Eq. 20. Eq. 20 also predicts that the prefactor of the power law region should grow linearly with the size of the event. Fig. 12(b) tests this prediction. We find that events large enough to be in the scaling regime () collapse onto a universal curve with a power law regime that is cutoff at strains bigger than about . We associate this failure of the elastic prediction with the onset of plastic deformation in the main text. Note that smaller events are cutoff at slightly smaller strains, providing further evidence that they involve different types of displacement.
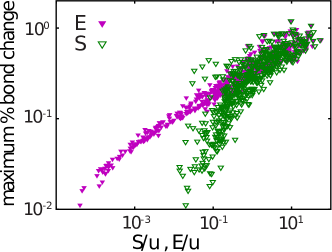
Changes in bond length are another measure of local deformation that can be used to identify plastic regions. Fig. 13 shows the maximum percentage change of any bond in the system as a function of event size. Note that there are almost no events where bonds change less than 2%. These are associated with extremely small events of order For events in the scaling regime where S and E are comparable (), the largest bond change is 20%. This is comparable to the displacements need to produce a local strain of
Even the largest events produce only 100% bond changes, corresponding to displacements of order a bond length relative to neighbors. This is consistent with the conclusion in the main text that larger events produce a uniform amount of dissipation over larger regions rather than larger deformations in a fixed spatial region. The very slow increase in the maximum bond length change with event size for the largest events may be attributed to sampling more bond changes from a fixed distribution. This is consistent with the collapse of the CDF in Fig. 12.