Obscuration effects in super-soft-source X-ray spectra
Abstract
Context. Super-soft-source (SSS) X-ray spectra are blackbody-like spectra with effective temperatures K and luminosities of erg s-1. Grating spectra of SSS and novae in outburst that show SSS type spectra display atmospheric absorption lines. Radiation transport atmosphere models can be used to derive physical parameters. Blue-shifted absorption lines suggest that hydrostatic equilibrium is an insufficient assumption, and more sophisticated models are required.
Aims. In this paper, we bypass the complications of spectral models and concentrate on the data in a comparative, qualitative study. We inspect all available X-ray grating SSS spectra to determine systematic, model-independent trends.
Methods. We collected all grating spectra of conventional SSS like Cal 83 and Cal 87 plus observations of novae during their SSS phase. We used comparative plots of spectra of different systems to find common and different features. The results were interpreted in the context of system parameters obtained from the literature.
Results. We find two distinct types of SSS spectra that we name SSa and SSe. Their main observational characteristics are either clearly visible absorption lines or emission lines, respectively, while both types contain atmospheric continuum emission. SSa spectra are highly structured with no spectral model currently able to reproduce all details. The emission lines clearly seen in SSe may also be present in SSa, hidden within the forest of complex atmospheric absorption and emission features. This suggests that SSe are in fact obscured SSa systems. Similarities between SSe and SSa with obscured and unobscured AGN, respectively, support this interpretation. We find all known or suspected high-inclination systems to emit permanently in an SSe state. Some sources are found to transition between SSa and SSe states, becoming SSe when fainter.
Conclusions. SSS spectra are subject to various occultation processes. In persistent SSS spectra such as Cal 87, the accretion disc blocks the central hot source when viewed edge on. In novae during their SSS phase, the accretion disc may have been destroyed during the initial explosion but could have reformed by the time of the SSS phase. In addition, clumpy ejecta may lead to temporary obscuration events. The emission lines stem from reprocessed emission in the accretion disc, its wind or further out in clumpy ejecta, while Thomson scattering allows continuum emission to be visible also during total obscuration of the central hot source.
Key Words.:
novae, cataclysmic variables - stars: individual (Cal 87) - stars: individual (Cal 83) - stars: individual (RXJ 0513-69) - stars: individual (T Pyx) - stars: individual (Nova LMC 2009a) - stars: individual (Nova LMC 2012) - stars: individual (V959 Mon) - stars: individual (QR And) - stars: individual (V4743 Sgr) - stars: individual (V2491 Cyg) - stars: individual (V723 Cas) - stars: individual (RS Oph) - stars: individual (KT Eri) - stars: individual (U Sco) - stars: individual (V1494 Aql) - stars: individual (V5116 Sgr) - AGN: individual (NGC 1068)1 Introduction
Supersoft X-ray sources (SSS) are a class of soft X-ray emitters
whose spectra resemble a blackbody in the temperature
range eV ( K) with luminosities above
erg s-1 (Greiner, 1996).
The first such sources were found with the Einstein
Observatory by Long et al. (1981)
and were later defined as a class after more were discovered with
ROSAT (Truemper, 1992; Kahabka et al., 1994; Greiner et al., 1991). The shape of the continuum
is caused by atmospheric thermal emission, but
blackbody models were initially used for spectral characterisations.
The first SSS were found in the LMC where X-ray emission is subject to
less photoelectric absorption along the line of sight than in the
case of most Galactic SSS.
In addition to the class of persistent SSS, classical novae (CNe) have
frequently been observed to emit an SSS
spectrum during the later phase of their outburst. It is now commonly
accepted that SSS emission originates in binary
systems containing a white dwarf primary that hosts nuclear burning of
material that is accreted from a secondary star; see
van den Heuvel et al. (1992) and Kahabka & van den Heuvel (1997), as well as Darnley et al. (2012)
for discussion of types and the role of the secondary star in nova
systems. In persistent SSS, the burning rate is roughly
the same as the accretion rate (van den Heuvel et al., 1992; Kahabka & van den Heuvel, 1997), while in novae
during outburst,
the burning rate is higher, eventually leading the SSS emission
to disappear once all hydrogen is consumed.
Before a nova explosion occurs, material from the companion is accreted
and accumulates on the white dwarf surface. The pressure and temperature
continuously increase until a thermonuclear runaway occurs, ejecting
a high fraction of the accreted material, together with some core material.
The ejecta initially form an expanding shell surrounding
the white dwarf, which prevents high-energy radiation from escaping.
CNe are optically bright until the density in the outer layers
decreases, exposing hotter layers in the outflowing gases. The
continuing shrinkage of the photosphere ultimately
leads to a shift in the peak of the spectral energy distribution
into the X-ray regime, producing an SSS spectrum when the
photospheric radius is close to a white dwarf radius. SSS emission
declines when nuclear burning ceases once all hydrogen in the
burning zones is either consumed or ejected. For more details we refer
to Starrfield et al. (2008).
Modelling SSS spectra is challenging, especially for novae.
The SSS spectra observed in low resolution, e.g., with CCDs, can often
be reproduced by a blackbody fit. While no meaningful physical
parameters can be obtained from this approach, it has been shown
that these systems are far from thermal equilibrium; see
e.g. Balman et al. (1998). The physics contained in NLTE atmosphere
models are more realistic, but CCD spectra are not adequate
for constraining LTE nor NLTE parameters because the spectral
resolution of CCDs does not match the complexity of atmosphere models
(e.g. Hartmann & Heise, 1996, 1997).
Parmar et al. (1998, 1997) have obtained different
results from blackbody fits and NLTE atmosphere models,
but the reproduction of the data is always the same.
Page et al. (2010) and Osborne et al. (2011) have obtained similar effective
temperatures from blackbody fits and NLTE atmosphere fits to
Swift/XRT spectra.
The true complexity of radiative transport models has often been
ignored, with only the effective temperature, surface gravity,
and some limited patterns in composition considered as variable
parameters, but the higher
resolution of X-ray grating spectrometers reveals that
this approach is invalid (e.g. Sala et al., 2008, 2010).
With the availability of the grating spectrometers
XMM-Newton/RGS (Reflection Grating Spectrometer), and
Chandra LETG/HETG (Low/High Energy Transmission Grating
Spectrometers), simple fitting of atmosphere models with a small
number of parameters is inadequate, and more sophisticated models
are needed.
Currently two approaches are being pursued. Hydrostatic
NLTE models such as TMAP benefit from extensive experience
and a mature understanding of NLTE approximations,
opacities, and atomic physics (e.g. Rauch et al., 2010).
However, considerable blue shifts of absorption lines
in nova spectra as reported by, e.g., Ness (2010)
are not reproduced by TMAP, requiring an artificial
correction. Their importance is controversial
because no clear signs of P Cyg profiles have been
found in observed spectra, suggesting a low mass loss
rate.
A self-consistent approach is attempted with the wind
model recently presented by
van Rossum (2012) which is based on spherically symmetric,
expanding, NLTE model atmospheres that have been applied by
Hauschildt et al. (1992) to novae during their early stages.
The possibility of line absorption caused by expanding
clumps far from the photosphere needs to be tested and
included in the atmosphere calculations if needed.
For this work, we bypass the complications of spectral
models and concentrate on the data themselves in a
comparative, qualitative study. Several X-ray grating
spectra of SSS have been obtained, including the two
prototypes Cal 83 and Cal 87
(Long et al., 1981; Crampton et al., 1987) and a number of
CNe as well as recurrent novae (RNe)
that have been observed during their X-ray bright SSS phase.
We extracted all available archival SSS X-ray grating spectra
to study commonalities between them and group them into two classes.
2 Observations
An overview of all targets discussed in this work is given in
Table 1. We only study SSS spectra, and
exclude all novae that were not observed with an X-ray grating
during their SSS phase. In addition other grating spectra
were extracted for comparison. In Table 1, the sources
are listed by class as defined in the footnotes, date of latest
outburst for novae, system inclination angle if known, and distance.
References for values taken from the
literature are given in the footnotes. Measurements of inclination
angle are not straightforward, yielding rather more secure
measurements for higher inclination angles
via observations of eclipses, illumination effects, or spectroscopic
evidence. Distance measurements
of Galactic sources beyond kpc are highly uncertain as no
direct parallax
measurements of the progenitor systems are available. The upcoming
ESA mission Gaia will give more precise measurements but
novae that have returned to their quiescent state may be too
faint. Empirical
methods such as maximum magnitude versus rate of decline (MMRD)
relationships are frequently used but are often inaccurate.
For more discussion and a collection of more system parameters,
we refer to Schwarz et al. (2011).
| Target Type/sub-typea | ||||
|---|---|---|---|---|
| persistent SSS | ||||
| Cal 83 | SSS/SSa | – | 20-30[1,2] | 48.12.9[3] |
| Cal 87 | SSS/SSe | – | 73-77[4,5] | 48.12.9[3] |
| RX J0513.9-6951 | SSS/SSa | – | 35[6] | 48.12.9[3] |
| QR Ande | SSS/SSe | – ; | 2.0[10] | |
| Classical Novae (CNe) | ||||
| HV Cetf | CN/SSe | 2008-10-07.4 | high[11]? | 4.52.0[12] |
| LMC 2012 | CN/SSa | 2012-03-26.4 | ? | 48.12.9[3] |
| V959 Mon | CN/SSe | 2012-08-09.8 | 826[16] | 1.5[17] |
| V1494 Aql | CN/SSe | 1999-12-01.8 | 78.5[18,19,20] | 1.60.1[21] |
| V5116 Sgr | CN/SSa,e | 2005-07-04.0 | high[24,26] | 113[25] |
| V723 Cas | CN/SSa | 1995-08-24.0 | 62[26,27] | 3.90.2[26] |
| V382 Vel | CN/neb | 1999-05-22.4 | 25-67[28] | 1.70.3[29] |
| V4743 Sgr | CN/SSa | 2002-09-19.8 | ? | 3.90.3[15] |
| KT Erig | CN/SSa | 2009-11-14.6 | 58 | 6.5[14] |
| V2491 Cygg | CN/SSa | 2008-04-10.7 | 80? | 10.5[23] |
| LMC 2009ag | RN/SSe | 2009-02-05.1 | ? | 48.12.9[3] |
| Recurrent Novae (RNe)b | ||||
| RS Oph | RN/SSa | 2006-02-12.8 | 30-40[30,31] | 1.60.3[32,33] |
| U Sco | RN/SSe | 2010-01-27.8 | 82[34,35] | 122[36] |
| T Pyx | RN/neb | 2011-04-14.3 | 4.80.5[37,40] | |
aCN=Classical Nova; RN=Recurrent Nova; SSS=persistent Super Soft Source. Sub-types are given indicating absorption-line dominated X-ray spectra (SSa: Sect. 3.2), emission line dominated spectra (SSe: Sect. 3.3), and post-outburst nebular spectra (neb: Sect. 3.6). The clearest cases are given in bold face while intermediate or less clear cases are given in italic. V5116 Sgr transitions between SSa and SSe, marked by SSa,e (Sect. 3.5).
bDiscovery date for CNe and RNe used as reference time (latest outburst for RNe)
cInclination angle in degrees
dDistance (kpc); for LMC novae, the distance to the LMC is given
eaka RX J0019.8+2156
faka CSS081007:030559+054715
gPossible RN
[1]Crampton et al. (1987); [2]Schmidtke & Cowley (2006); [3]Macri et al. (2006); [4]Schandl et al. (1997); [5]Ebisawa et al. (2001); [6]Hutchings et al. (2002); [7]Becker et al. (1998) (); [8]Kahabka (1996); [9]Tomov et al. (1998) (); [10]Beuermann et al. (1995); [11]Beardmore et al. (2012); [12]Schwarz et al. (2008); [13]Ribeiro et al. (2013a); [14]Ragan et al. (2009); [15]Vanlandingham et al. (2007); [16]Ribeiro et al. (2013b); [17]Munari et al. (2013); [18]Bos et al. (2001); [19]Barsukova & Goranskii (2003); [20]Hachisu et al. (2004); [21]Iijima & Esenoglu (2003); [22]Ribeiro et al. (2011); [23]Helton et al. (2008); [24]Dobrotka et al. (2008); [25]Sala et al. (2008); [26]Lyke & Campbell (2009); [27]Goranskij et al. (2007); [28]Shore et al. (2003); [29]Della Valle et al. (2002); [30]Dobrzycka & Kenyon (1994); [31]Ribeiro et al. (2009); [32]Bode (1987); [33]Barry et al. (2008); [34]Schaefer (1990); [35]Thoroughgood et al. (2001); [36]Schaefer (2010); [37]Chesneau et al. (2011); [38]Uthas et al. (2010); [39]Sokoloski et al. (2013); [40]Shore et al. (2011).
| Target | daya | ObsIDb Instrument | Start time Exp. time | CRc | |||||
| (UT) | (ks) | cts-1 | erg cm-2 s-1 | ||||||
| Cal 83 | 0077 | LETGS | 1999-11-29.27 | 51.2 | no detection | ||||
| 0123510101 RGS | 2000-04-23.84 | 45.0 | 0.43 | 2.07 | 1.87 | 0.21 | |||
| 1900 | LETGS | 2001-08-15.67 | 35.2 | 0.09 | 2.18 | 1.81 | 0.37 | ||
| 3402 | LETGS | 2001-10-03.48 | 61.4 | no detection | |||||
| 0500860601 RGS | 2007-11-24.90 | 22.1 | 0.23 | 2.12 | 1.93 | 0.18 | |||
| Cal 87 | 1896 ACIS/LETGS | 2001-08-13.84 | 93.9 | 0.03 | 2.20 | 1.94 | 0.26 | ||
| 0153250101 RGS | 2003-04-18.87 | 77.6 | 0.12 | 0.61 | 0.32 | 0.28 | |||
| QR And | 0075 | LETGS | 2000-09-28.42 | 51.4 | 0.01 | 0.99 | 0.65 | 0.35 | |
| 0047940101 RGS | 2001-12-31.77 | 56.6 | 0.07 | 0.42 | 0.34 | 0.09 | |||
| RX J0513.9-6951 | 3503 | LETGS | 2003-12-24.29 | 47.7 | 0.08 | 1.75 | 1.46 | 0.29 | |
| 5440 | LETGS | 2005-04-20.80 | 24.6 | 0.12 | 2.53 | 2.08 | 0.44 | ||
| 5441 | LETGS | 2005-04-27.95 | 25.0 | 0.40 | 5.93 | 5.33 | 0.60 | ||
| 5442 | LETGS | 2005-05-03.24 | 25.5 | 0.39 | 5.84 | 5.26 | 0.57 | ||
| 5443 | LETGS | 2005-05-13.82 | 22.5 | 0.25 | 4.19 | 3.62 | 0.57 | ||
| 5444 | LETGS | 2005-05-19.09 | 25.0 | 0.28 | 4.38 | 3.87 | 0.50 | ||
| All combinedh | 170 | 0.23 | 3.40 | 3.17 | 0.23 | ||||
| HV Cet | 72.2 | 9970 | LETGS | 2008-12-18.62 | 34.8 | 0.22 | 3.35 | 2.74 | 0.61 |
| KT Eri | 71.3 | 12097 | LETGS | 2010-01-23.91 | 14.9 | 11.52 | 164 | 163 | 0.76 |
| 79.3 | 12100 | LETGS | 2010-01-31.94 | 27.9 | 77.73 | 1031 | 973 | 58.5 | |
| 84.6 | 12101 | LETGS | 2010-02-06.27 | 47.8 | 37.48 | 509 | 503 | 6.35 | |
| 158.8 | 12203 | LETGS | 2010-04-21.45 | 32.4 | 106.5 | 1564 | 1406 | 158 | |
| LMC 2009a | 90.4 | 0610000301 RGS | 2009-05-06.43 | 37.5 | 0.23 | 1.84 | 1.71 | 0.14 | |
| 165.0 | 0610000501 RGS | 2009-07-20.03 | 56.7 | 1.80 | 16.8 | 14.4 | 2.41 | ||
| 196.5 | 0604590301 RGS | 2009-08-20.59 | 14.0 | 2.10 | 16.2 | 13.4 | 2.84 | ||
| 230.0 | 0604590401 RGS | 2009-09-23.02 | 51.0 | 1.23 | 11.0 | 9.42 | 1.56 | ||
| LMC 2012 | 31.5 | 14426 | LETGS | 2012-04-26.91 | 20.0 | 2.12 | 25.7 | 15.4 | 10.3 |
| V959 Mon | 116.0 | 15596 | LETGS | 2012-12-03.82 | 24.9 | 0.15 | 2.58 | 1.88 | 0.70 |
| V1494 Aql | 301.5 | 2308 | LETGS | 2000-09-28.29 | 8.1 | 0.72 | 10.5 | 9.22 | 1.26 |
| 304.7 | 0072 | LETGS | 2000-10-01.42 | 18.1 | 0.93 | 12.4 | 11.5 | 0.89 | |
| V2491 Cyg | 39.9 | 0552270501 RGS | 2008-05-20.59 | 39.2 | 12.6 | 90.1 | 67.2 | 22.9 | |
| 49.6 | 0552270601 RGS | 2008-05-30.35 | 29.8 | 2.7 | 17.5 | 12.8 | 4.68 | ||
| V4743 Sgr | 180.4 | 3775 | LETGS | 2003-03-19.40 | 24.7 | 38.91 | 540 | 528 | 11.4 |
| 196.14 | 0127720501 RGS | 2003-04-04.93 | 35.2 | 44.6 | 300 | 289 | 10.7 | ||
| 301.9 | 3776 | LETGS | 2003-07-18.90 | 11.7 | 37.16 | 499 | 481 | 18.1 | |
| 371.0 | 4435 | LETGS | 2003-09-25.99 | 12.0 | 19.78 | 276 | 266 | 9.68 | |
| 526.1 | 5292 | LETGS | 2004-02-28.06 | 10.3 | 3.61 | 54.4 | 53.2 | 1.21 | |
| V5116 Sgr | 609.7 | 0405600201 RGS | 2007-03-05.72 | 12.8 | 2.1 | 17.5 | 16.4 | 1.09 | |
| 781.8 | 7462 | LETGS | 2007-08-24.80 | 34.8 | 0.27 | 4.09 | 3.57 | 0.53 | |
| V723 Cas | 5481.7 | 0652070101 RGS | 2010-08-26.76 | 50.1 | 0.06 | 0.40 | 0.33 | 0.07 | |
| 6018.1 | 0673490101 RGS | 2012-02-14.02 | 90.0 | 0.07 | 0.35 | 0.27 | 0.08 | ||
| All combinedh | 140 | 0.07 | 0.32 | 0.26 | 0.07 | ||||
| RS Oph | 26.12 | 0410180201 RGS | 2006-03-10.96 | 11.7 | 2.5 | 14.8 | 9.89 | 4.92 | |
| 39.7 | 7296 | LETGS | 2006-03-24.52 | 10.0 | 30.16 | 312 | 192 | 120 | |
| 54.0 | 0410180301 RGS | 2006-04-07.88 | 18.6 | 134 | 864 | 457 | 407 | ||
| 66.9 | 7297 | LETGS | 2006-04-20.73 | 6.5 | 68.34 | 726 | 408 | 319 | |
| U Sco | 18.7 | 12102 | LETGS | 2010-02-14.49 | 23.0 | 0.38 | 5.57 | 4.89 | 0.68 |
| 22.9 | 0650300201 RGS | 2010-02-19.65 | 63.4 | 0.95 | 7.75 | 6.98 | 0.78 | ||
| 34.8 | 0561580301 RGS | 2010-03-03.61 | 54.3 | 1.1 | 6.74 | 3.35 | 3.40 | ||
| T Pyx | 203.6g | 12401 | LETGS | 2011-11-03.86 | 39.8 | 0.09 | 1.92 | 1.31 | 0.61 |
| V382 Vel | 267.9g | 958 | LETGS | 2000-02-14.27 | 24.4 | 0.13 | 2.08 | 1.34 | 0.74 |
| RS Oph | 111.7g | 7298 | LETGS | 2006-06-04.50 | 20.0 | 0.13 | 2.29 | 1.25 | 1.04 |
| NGC 1068 | 0111200101 RGS | 2000-07-29.73 | 42.3 | For comparison in Fig. 9 | |||||
aafter (Table 1)
bObservation Identifiers; those shown in bold indicate observations used for Fig. 1
cCount rate per second
dflux over total band 7-38 Å; eflux over hard range 7-23 Å; fflux over soft range 23-38 Å
gX-ray observation taken after nova had turned off
hFor RX J0513.9-6951 and V723 Cas, all available observations were combined.
The journal of X-ray observations used in this work is presented in
Table 2 with columns: days after discovery for CNe and RNe
relative to the respective reference
times given in Table 1, observation identifier, grating
instrument, start time of observation, and effective exposure time
(after all corrections). The Chandra LETGS has been used in
conjunction with the High Resolution Camera (HRC), except for the
observation of Cal 87, where the Advanced CCD Imaging Spectrometer
(ACIS) was used as the detector to record the dispersed photons.
For novae, only those observations are included that were
taken during the SSS phase. In the bottom of Table 2,
T Pyx is also marked as an observation after the nova had turned
off, along with V382 Vel and RS Oph. Further, we extracted an
XMM-Newton spectrum of the obscured Active Galactic Nucleus (AGN)
NGC 1068 (Kinkhabwala et al., 2002) for comparison.
Standard SAS 11.0 and CIAO 3.4 tools were used to obtain calibrated
spectra from the raw XMM-Newton and Chandra data, respectively. Newer
versions are available but re-extraction is only needed for
quantitative analysis which is not pursued in this work. The count
spectra are constructed by collecting the dispersed photons from
optimised extraction regions. They are then converted to calibrated
flux spectra by dividing the number of counts by the effective area
in each spectral bin which is taken from the calibration of
the respective instruments. For grating spectra, this procedure is
justified because the response matrices are sufficiently
diagonal to yield well-known photon energies for each
spectral channel. While instrumental line broadening
( Å) is not corrected, it is not important
for the qualitative analyses performed in this paper.
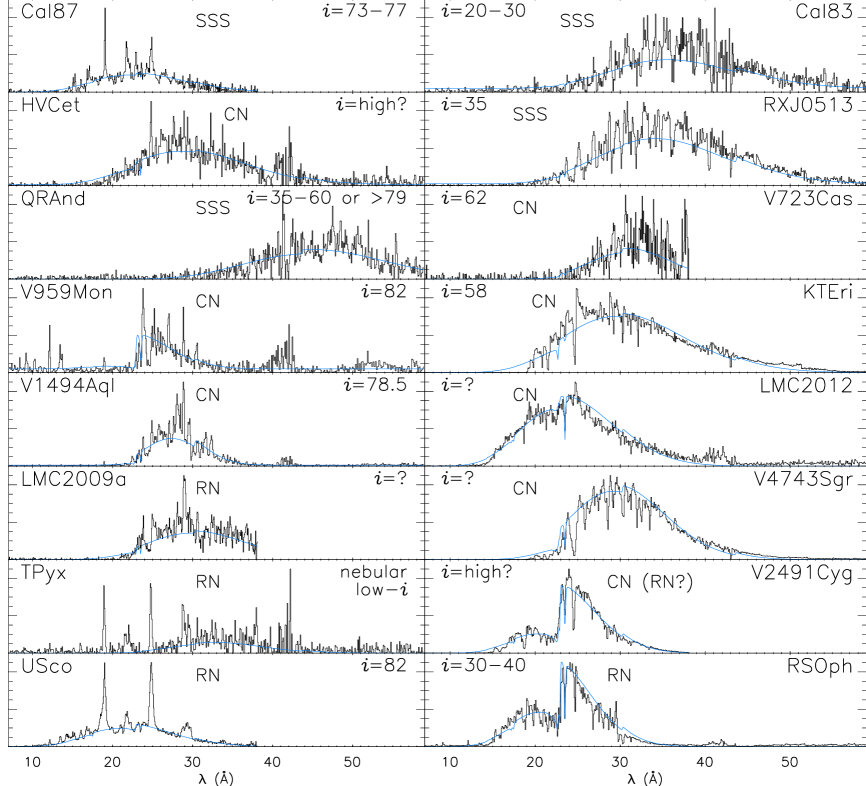
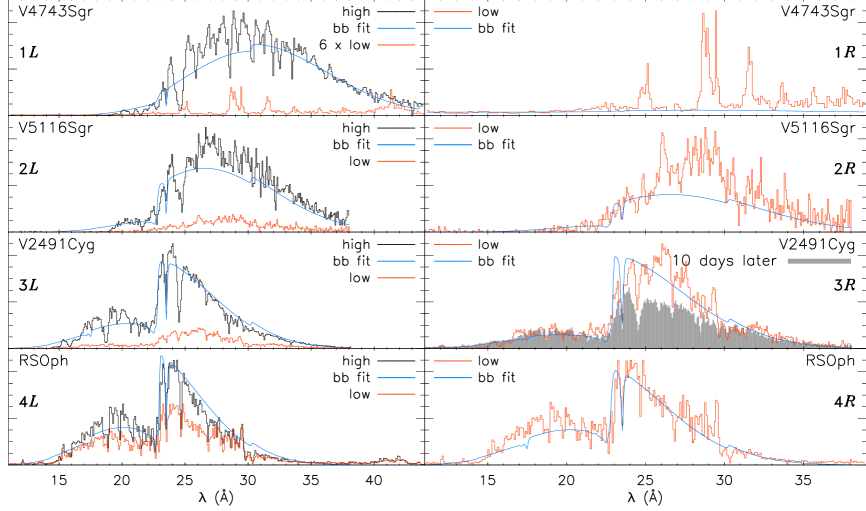
Selected calibrated grating spectra are shown in Fig. 1.
The absorbed blackbody curves are included in Fig. 5
only to guide the eye to the rough location of the continuum.
Two RGS spectra of V723 Cas have been combined using the
SAS task rgscombine, and all six Chandra spectra of
RX J0513.9-6951 are co-added.
3 Results
In this figure as well as in Figures 3, 4, 7, and 9, the top panel shows the entire wavelength range and legends with average error bars for each observation (left) and line/fill styles belonging to the corresponding target names (right) where the days in brackets are days after in Table 2. The panels below show details, with some overlap spectral ranges. Prominent bound-bound transitions are marked with vertical lines at their rest wavelengths, and a label on top of each line gives the corresponding element/ion descriptor.
Past X-ray observations of SSS have displayed a high degree of diversity of phenomena, and the objective of this work is to search for any systematic trends in the data. In light of the complexity of required models, which unavoidably comes with a high degree of uncertainty in model parameters, we base our approach directly on the data. In the following paragraphs, we show and describe SSS spectra of different systems.
3.1 Commonalities between SSS spectra
For comparison of SSS spectra from different systems or
different evolutionary phases, we plot 2-3 spectra in the
same graphs using a combination of lines and shadings of
different colours as marked in the respective legends of
Figures 2, 3,
4, 7, and 9.
Qualitative comparison of spectra is facilitated by
rescaling if needed, compensating, e.g., for different
intrinsic brightness or distance.
Selected line transitions are labelled at their rest wavelengths
without necessarily claiming the respective lines have been
detected.
Ness et al. (2011) found a remarkable similarity between two SSS
spectra of RS Oph and V2491 Cyg, taken on
days 39.7 and 39.9 after their respective outbursts (see their
figure 12). Both sources varied with time
(Ness et al., 2007b, 2011), and we compared other SSS spectra
of RS Oph and V2491 Cyg taken earlier and
later during their respective evolution and found those to be
different.
While Ness et al. (2011) reported fundamentally different spectra
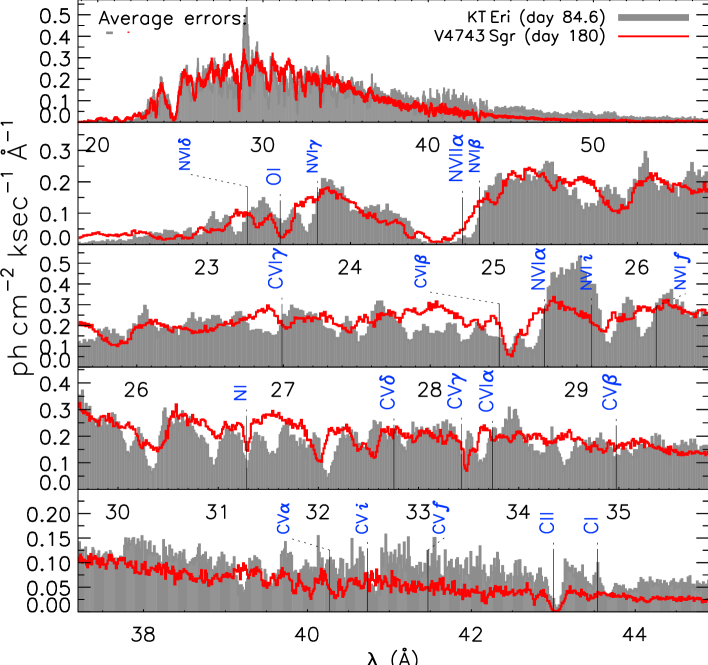
of RS Oph and V4743 Sgr, we show in
Fig. 2 that one of five SSS spectra
of V4743 Sgr is in fact remarkably similar to one out
of four SSS spectra of KT Eri; note that no rescaling
is needed!
Both novae were
observed multiple times, and their X-ray spectra varied on
different time scales with V4743 Sgr evolving much
slower. Their optical decline time scales show the same
trend, yielding and 6.6 days for V4743 Sgr and
KT Eri, respectively (Morgan et al., 2003; Hounsell et al., 2010). As in
RS Oph and V2491 Cyg, both novae evolved differently,
yielding a high degree of similarity only on days 180.4 and
84.6 of V4743 Sgr and KT Eri, respectively.
The two pairs of novae RS Oph/V2491 Cyg
and V4743 Sgr/KT Eri evolved differently
but also passed through an identical spectral phase.
3.2 The SSa subclass
The SSS X-ray spectra of the four systems RS Oph, V2491 Cyg,
V4743 Sgr, and KT Eri are dominated by a blackbody-like
continuum with deep absorption lines (figure 13 in
Ness et al. 2011 and Fig. 2 in this work).
We chose these characteristics to define a new subclass, SSa
(a for absorption lines). After inspection of a Chandra grating
spectrum of the recent nova LMC 2012, we also group this nova
into this subclass. In the left column of Fig. 1,
eight examples of SSa spectra are shown.
Another object that could be grouped into the SSa subclass
is Cal 83 but the spectrum is not as well exposed (owing to
the large distance to the LMC).
An NLTE atmosphere model by Lanz et al. (2005) could be fit to the
Chandra spectrum. Also the four SSa spectra of V4743 Sgr,
V2491 Cyg, RS Oph, and KT Eri have been
used to adjust preliminary atmosphere models with some success
(Rauch et al. 2010; van Rossum 2012; Ness et al. 2011; Nelson et al. 2008)
while for some other observations, spectral modelling has so
far not been successful, e.g. V1494 Aql (Rohrbach et al., 2009).
Possibly, all SSa spectra can be reproduced by atmosphere
models, in which case Cal 83 is also an SSa,
while V1494 Aql may not be an SSa.
With few exceptions, emission lines cannot easily be discerned in
the SSa subclass. The emission lines seen in RS Oph on day 39.7
(Ness et al., 2007b) need to be interpreted in the context of the
cooling shock that occurred between the stellar wind of the
companion and the nova ejecta. Schönrich & Ness (2008) report
that those lines above the SSS continuum appear enhanced compared
to those at shorter wavelengths, indicating line pumping.
For nova LMC 2012, Takei et al. (2012) report detections of emission lines,
and also the SSa spectrum of KT Eri contains additional
emission lines (Fig. 2). We consider a strong
possibility that some emission lines are always present in SSS
spectra, albeit not easy to see in SSa spectra.
The presence of emission lines complicates spectral modelling
with atmosphere models. More refined dynamic atmosphere models including
mass loss will reveal whether the emission lines are part of
P Cygni profiles (which cannot clearly be decided visually), or whether
they originate from outside of the atmosphere, requiring an independent
model component such as photoionised plasma.
In summary, the definition of a member of the SSa class is an X-ray spectrum that contains a blackbody-like continuum with clearly visible absorption lines. Additional emission lines may be present but difficult to see within the complex atmospheric SSa spectrum.
3.3 The SSe subclass
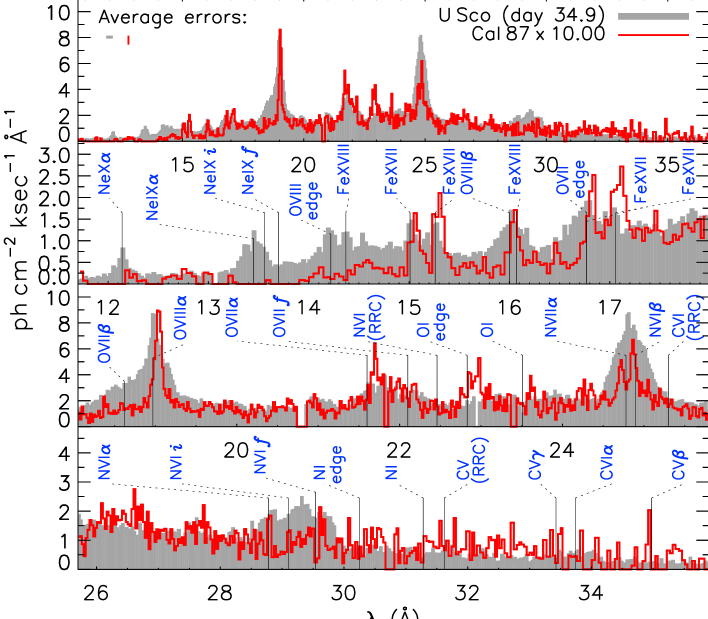
During a detailed analysis of XMM-Newton observations of U Sco,
Ness et al. (2012a) noted that this edge-on system resembles the
SSS Cal 87. This is demonstrated in Fig. 3
where the XMM-Newton grating spectrum of U Sco taken on day 34.9 is
shown in shades of grey and Cal 87, scaled by a factor of
10, as a red histogram line.
The strongest lines seen in U Sco are also seen
in Cal 87 but differ in their width. The Ne lines at 12 Å and
13.5 Å are only seen in U Sco while several Fe lines are present
in both sources.
The strengths of the emission lines seem to be related to the
strength of the underlying continuum at the wavelengths where
they arise. This can be seen in Fig. 3 and also
in figure 4 in Ness et al. (2012a).
The spectra of these two objects are the clearest examples of
those that differ from the subclass of SSa, and therefore, we
introduce the new subclass SSe, which are SSS spectra that contain
strong emission lines above a weak continuum. The spectra of Cal 87
and U Sco shown in Fig. 3 contain no clear signs
of absorption lines.
Ness et al. (2012a) concluded from the presence of blackbody-like
continuum emission during times of eclipse in U Sco that it results
from Thomson scattering in the electron-rich, ionised nova ejecta.
In summary, the definition of a member of the SSe class is an X-ray spectrum that contains a weak blackbody-like continuum without absorption lines and exhibits emission lines that are at least comparable in strength to the continuum. The emission lines in SSe are strongest where the continuum is strongest.
3.4 Intermediate cases
The spectral analysis of the grating spectra of the CN V1494 Aql
presented by Rohrbach et al. (2009) turned out to be extremely difficult,
and no satisfactory model was so far found. Some of the nova
X-ray spectra contain a complex mixture of emission- and absorption
lines which is illustrated with three examples in Fig. 4.
Emission lines can be seen to occur in all three spectra, including
some unidentified lines that arise at the same wavelengths were absorption
lines were seen in the SSa spectra of V2491 Cyg,
RS Oph, and V4743 Sgr (Ness et al., 2011).
The three spectra in Fig. 4 are sufficiently similar
to conclude that these sources belong to the same subclass, and
their characteristics place them more into the SSe subclass, although
these cases are not as clear as U Sco and Cal 87
(Fig. 3). Eight examples of SSe are shown in the left
column of Fig. 1.
3.5 Transitions between SSa and SSe
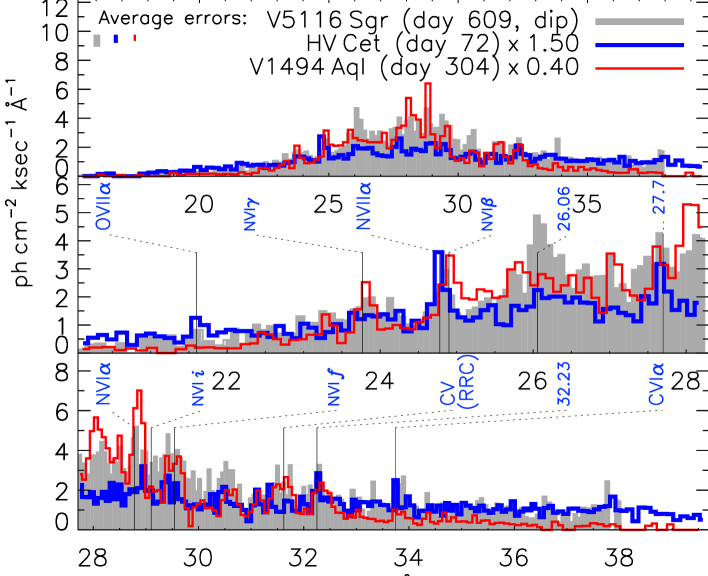
The CN V5116 Sgr was highly variable during the XMM-Newton observation
taken on day 609.7 (Sala et al., 2008, 2010).
During an interval of
hours (2/3 of the orbit), the integrated brightness was
more than an order of magnitude fainter than at the beginning of the
observation, and during this time, emission lines were present as
reported by Sala et al. (2010).
This could be an example of an SSS
switching between SSa and SSe states, possibly due to a temporary
obscuration event (Sala et al., 2008).
We have studied four novae with variable X-ray light curves
to investigate whether they have transitioned between SSa and
SSe and illustrate the outcome in Fig. 5.
From the light curves, we extracted spectra
from time intervals of brighter emission (shown in the
left) and fainter time intervals (right). To guide the eye,
blackbody curves are included with blue thin lines.
The most extreme case is V4743 Sgr (top) in which all
continuum emission was completely obliterated, leaving only
emission lines (Ness et al., 2003). We speculate that the source of
continuum X-rays either temporarily turned off or was completely
obscured leaving us with emission from only the ejected gas.
V2491 Cyg was observed twice by XMM-Newton with a
-hour dip in the first observation (see
figure 10 in Ness 2012).
Ness et al. (2011) subdivided this observation into
three time intervals a, b, c, and in the second row
of Fig. 5, we show parts c (panel 3)
and b (3). The grey shaded spectrum in panel 3
was taken 10 days later. The
dip spectrum and the later one are about equally bright
but differ decisively between 23-30 Å, with the
dip spectrum having some characteristics of an SSe spectrum
while the later spectrum is an SSa spectrum.
The excess in the dip spectrum could have arisen further
outside while the central continuum source was temporarily
obscured.
The Chandra grating observation of RS Oph taken on day
39 after outburst was variable (see figure 7 in Ness 2012).
This observation was taken during an episode of high-amplitude
variations discovered by Osborne et al. (2011) in the
Swift light curve.
The high- and low-state spectra of RS Oph shown in the
bottom of Fig. 5 are the same as
those shown in figure 9 in Ness et al. (2007b). Excess
emission is not as obvious, and this may not be
a transition between SSa and SSe. The similarity of the
brightness and hardness light curves noted by
Ness et al. (2007b) in their figure 8 suggests
that internal processes (as opposed to external obscuration)
may lead to the variability, perhaps similar to the on- and
off states in RX J0513.9-6951
(Schaeidt et al., 1993; Burwitz et al., 2008; Southwell et al., 1996; McGowan et al., 2005)
or in Cal 83 (Kahabka, 1997; Alcock et al., 1997; Rajoelimanana et al., 2013).
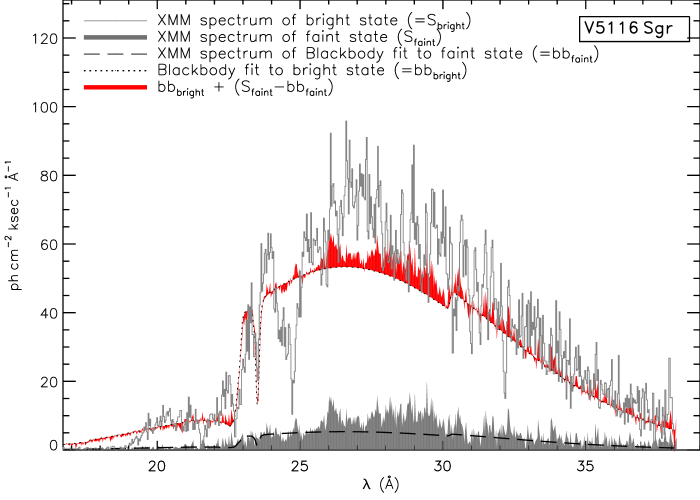
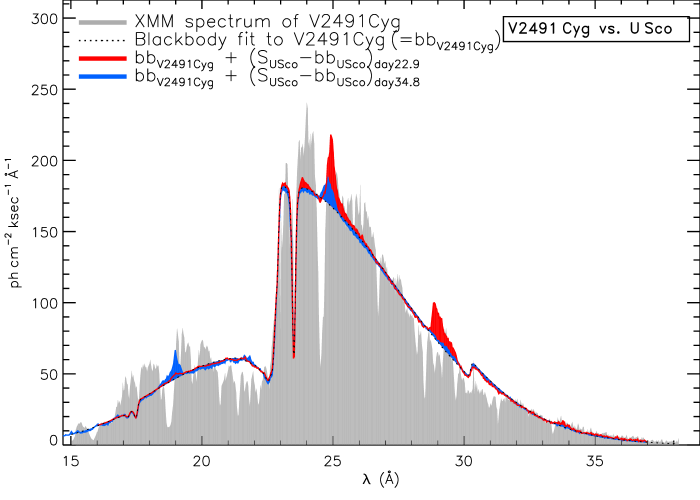
3.5.1 Comparison of SSa and SSe spectra
SSS spectra observed in grating resolution contain a multitude
of complex features that no coherent model can currently reproduce.
In order to put the dominant emission lines in SSe spectra
into context with the more complex SSa spectra, we show in
Fig. 6 direct comparisons between SSa
and SSe spectra. The continuum component of an SSe spectrum is
first estimated via a blackbody fit and then subtracted from
the same observed SSe spectrum. The remaining emission line
component is then added to the continuum component of an SSa
spectrum that was also determined via blackbody estimation.
We performed this operation for the bright/faint spectra of
V5116 Sgr (top of Fig. 6) and for
the SSa/SSe V2491 Cyg and U Sco (bottom
of Fig. 6).
For both cases, one can see that the emission lines in SSe
spectra are comparable in strength to various features
in SSa spectra. Emission lines appearing so dominant in SSe
may thus be present in SSa spectra as well but are hidden
between complex atmospheric features. Without the complex
continuum, the emission line component can be seen much better.
3.6 Pre-SSS and Post-outburst emission lines
Emission lines can arise in different contexts. Before the start of
the SSS phase in several novae, emission line spectra had frequently
been observed with CCD spectrometers. While their spectral resolution
is not high enough to resolve emission lines, the nature as emission
line spectra has been established by means of collisional
equilibrium models that reproduce these spectra
(e.g., Krautter et al., 1996; Balman et al., 1998; Mukai & Ishida, 2001; Orio et al., 2001; Ness et al., 2009a).
Distinct differences to SSe spectra are:
(1) The continuum component in collisional equilibrium originates
from bremsstrahlung, which has a different shape from a blackbody.
(2) The emission line fluxes increase in strength during the
SSS phase (Schönrich & Ness, 2008). For the SSe U Sco, only
extremely faint early hard emission was seen (Schlegel et al., 2010).
(3) The emission lines in pre-SSS spectra are in most cases too faint
for detection in grating spectra; exceptions are V959 Mon
(Ness et al., 2012b) and symbiotic novae such as RS Oph
(Ness et al., 2009b).
(4) The early hard X-ray component fades with time (Ness et al., 2009a),
leaving even less potential contributions to SSe spectra.
The spectral changes with the start of the SSS phase have
serendipitously been observed in an XMM-Newton observation of
RS Oph on day 26.12 after the 2006 outburst (see
Table 2) in which Nelson et al. (2008) discovered the
appearance of a new soft component and showed that this new
component is not yet atmospheric emission from the
white dwarf but a complex emission line spectrum. The time
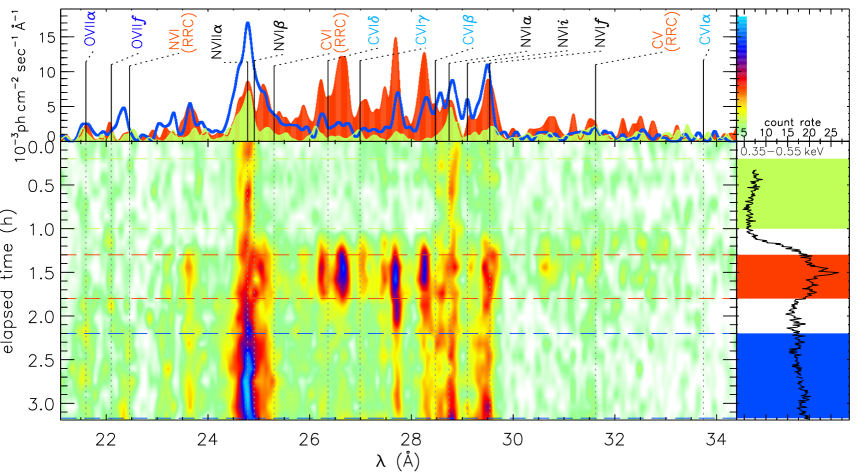
evolution is illustrated in Fig. 8. About one
hour after the start of the observation, an increase in count
rate had occurred that Nelson et al. (2008) identified as a new soft
component consisting of a complex emission line spectrum. The
transitions belonging to the emission lines between
Å are currently unknown, and our spectral time
map shows that they were transient in nature, lasting less than
one hour. At the same time as they disappeared, the N vii
1s-2p (Ly, 24.78 Å) line increased by a substantial
amount, apparently the same amount of flux contained in the
transient emission lines, preserving the integrated count rate
(see right panel). The C vi Ly line is not present,
suggesting that none of the transient emission lines originates
from carbon, even if line
shifts are assumed as proposed by Nelson et al. (2008). It is possible
that they all arise from nitrogen, although no
transitions of nitrogen are known in this wavelength range.
While a more coherent interpretation of these transient emission
lines is beyond the scope of this paper, the relevant
conclusion for this work is that the pre-SSS emission lines
at soft wavelengths have become significantly stronger with
the start of the SSS phase while harder emission lines have
remained the same; see figure 6 in Ness (2012). These could
be SSe features that are later hidden between complex atmospheric
structures in SSa spectra.
For the four reasons above, we do not consider the emission lines in SSe
as continuation of the early emission lines, and so, in particular
for the persistent SSS Cal 87, a different mechanism is
needed. We have restricted the definition of SSe in
Sect. 3.3 to the presence of emission lines that
coincide in strength with an underlying blackbody-like continuum.
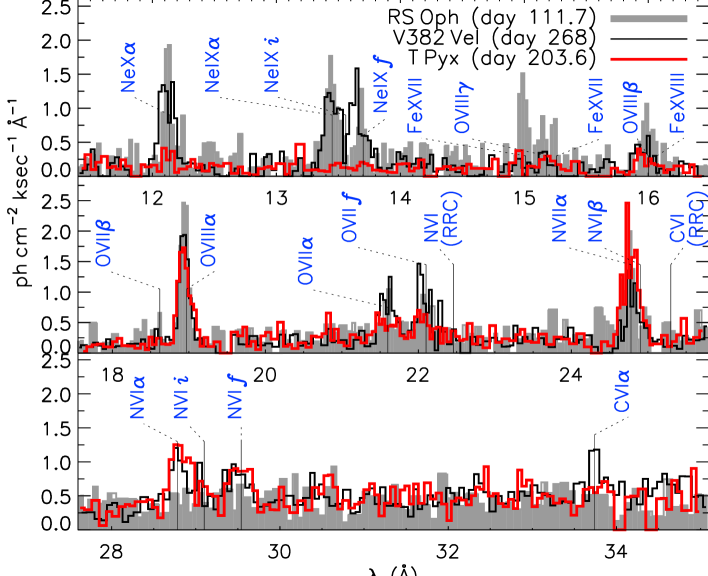
Post-outburst X-ray emission line spectra arise in the radiatively
cooling ejecta which has been shown for the post-outburst grating
spectra of V382 Vel by Ness et al. (2005) and of
RS Oph by Ness et al. (2009b).
These two grating spectra are shown in Fig. 7
in comparison to a Chandra spectrum of the RN T Pyx, taken
203.6 days after the 2011 outburst (Tofflemire et al., 2011). The three
spectra are qualitatively similar, suggesting a similar
origin. Since the Chandra spectrum of T Pyx was
taken during the decline of the SSS phase, this spectrum
may be a post-outburst spectrum that could arise from radiatively
cooling ejecta.
While pre- and post-SSS X-ray spectra are very similar in their
appearance, their origin may still be different. The presence of
high-velocity, dense ejecta during the early evolution of a nova
facilitates shocks with the environment or, in the case of internal
inhomogeneities, shocks within the ejecta. After the SSS phase has
ended, the ejecta have dispersed, leaving only radiative cooling of
optically thin plasma as X-ray production mechanism.
Both are collisional processes, allowing the same spectral models
to be applied, giving only different parameters (such as lower
electron temperature in post-SSS spectra).
We do not group post-outburst emission line spectra into the SSe class because the emission line strengths do not scale with the strength of the respective underlying SSS continuum. In V382 Vel, the SSS spectrum during the active phase did not exceed 0.6 keV (20 Å) (Orio et al., 2002; Burwitz et al., 2002b, a) while in Fig. 7, emission lines are also seen at shorter wavelengths. The situation is similar for RS Oph, and in both systems, an early hard component had been present before the start of the SSS phase (Mukai & Ishida, 2001; Ness et al., 2009b).
3.7 Dependence on Inclination Angle
The arrangement of the spectra in Fig. 1
is chosen to display SSe in the left and SSa spectra in the right,
although not all cases can unambiguously be classified (see
Sect. 3.4). We include the
inclination angles (if known) from Table 1 in the corners
opposite to where the source names are given. As discussed
above, higher inclination angles are more securely determined,
yielding more high values than low values. All inclination angles
above can be found in the left column, indicating
that SSe spectra are a common phenomenon in high-inclination
systems. The only exception may be the SSa V2491 Cyg that
was proposed by Ribeiro et al. (2011) to be a high-inclination
system, however, this has so far not been confirmed by observations
of eclipses.
The CN V723 Cas is viewed at an intermediate inclination
angle and contains a mixture of SSe and SSa emission, suggesting
that there is a trend with inclination angle. The spectrum
resembles that of QR And which lies at a similar
inclination angle.
4 Discussion
Based on the observed sample of SSS spectra, we introduced the two
sub-types SSa and SSe with the primary observational characteristics
being the predominance of absorption lines versus emission lines,
respectively (see definition at end of Sects. 3.2
and 3.3). Some sources transition between SSa and SSe
states, yielding SSe spectra during episodes of fainter emission.
We have shown an influence of inclination angle on the observed
type of SSS spectrum. All systems with known high inclination angle
(which is more securely measurable) display SSe spectra, while for
many SSa spectra, the inclination angle is not known or not
robustly confirmed. Emission lines in SSe spectra appear
comparable in strength to complex sub-structures in SSa spectra,
suggesting that they are always present and can better be
seen when the atmospheric continuum with its complex structure
is not present. SSe spectra
may be the result of obscuration of the continuum component,
exposing emission lines that probably originate from further away
from the white dwarf.
Ebisawa et al. (2001) argued that at the given high inclination angle
in Cal 87, the central source was blocked by the accretion disc,
and scattering through the accretion disc corona could explain the
observed spectrum (see also Ebisawa et al. 2010). Similarly,
Beardmore et al. (2012) argue that the apparently sub-Eddington white dwarf
luminosity in HV Cet is due to permanent obscuration of X-rays
by the accretion disc rim. A smooth periodic X-ray modulation
of nova V959 Mon (Page et al., 2013) also makes it likely that
this source is viewed at high inclination and has a white dwarf
surrounded by a scattering region.
In the following we discuss the origin of the continuum and the emission line components (4.1), obscuration effects in SSe (4.2) and resulting implications to determination of luminosities (4.2.2). Since most SSe spectra originate from high-inclination systems, the accretion disc likely plays a vital role but the novae in our sample do not necessarily possess an accretion disc. We discuss in Sect. 4.3 whether the disc has been destroyed during the initial nova explosion and how it could reform. Our main conclusion is that SSe are seen when a significant fraction of the photospheric emission is obscured, but not all X-ray variability is necessarily due to obscurations (see Sect. 4.4).
4.1 Origin of the continuum and emission lines in SSe
The continuum component in all SSS spectra is produced by the
photosphere of the white dwarf. A photospheric temperature of several
K implies R⊙.
The U Sco system configuration requires the
entire white dwarf be completely eclipsed, but Ness et al. (2012a)
found the continuum emission during eclipse centre reduced by
only 50%.
The only way to see this continuum emission also outside of
the binary orbit is Thomson scattering that preserves the
spectral shape. Thomson scattering can likely also explain
the presence of some if not all continuum emission in SSe.
The origin of the emission lines on top of a blackbody-like
continuum in SSe spectra is less clear. As discussed in
Sect. 3.6, we do not consider the emission lines
in SSe as a continuation of early emission lines sometimes
seen in novae.
The strongest emission lines in SSe arise at wavelengths where
the continuum is strongest. This is not typical of collisional
equilibrium spectra and is rather suggestive of photoexcitation
which should not be confused with photoionisation that
has been disfavoured by Orio et al. (2013) for U Sco. Ions in
excited states re-emit previously absorbed photons in all directions,
independently of the location of the ionising source. Continuum
photons emitted from the white dwarf into polar directions can
effectively be scattered into other directions via this process.
Because it is most efficient for resonance lines with
high oscillator strengths, it is called resonant line scattering
and has been proposed for Cal 87 by Greiner et al. (2004) and
for U Sco by Ness et al. (2012a). Depending on the
geometry of the scattering medium, photons can be scattered into
the line of sight or out of the line of sight. Since these processes
balance out in a spherically symmetric scattering medium, it needs
to be asymmetric to allow for observable effects of resonant line
scattering.
The contribution of resonant scattering to the emission lines
dominates that of recombination when the column density through
the absorber/re-emitter is low, but decreases as the column
increases (Kinkhabwala et al., 2002). The detection of Radiative Recombination
Continuum (RRC111RRCs are emission features reflecting the
released energy during recombination.) features is a sign of
recombination, but note that RRCs can be detected only
for low temperatures. If there is additional heating (on top of
photo-heating), which brings the gas to higher temperatures
(e.g., exceeding eV, and dependent on spectrometer used
and S/N), the RRCs would be broadened in the spectrum beyond
recognition. In that case, the plasma would be more collisional.
If the lines are the result of a mixture of processes, then it
is difficult to explore them for quantitative diagnostics.
In the case of pure resonance scattering, the line intensity
is a measure of how the scattering medium covers the source.
Based on the atomic cross section for the resonant
Ly2221s-2p transitions in H-like ions such as
O viii or C vi all have the same oscillator strength.
transitions,
for significant line absorption and scattering, an ionic column
density of at least cm-2 is needed (figure 7 of
Kinkhabwala et al. 2002), with some dependency on line broadening.
Hence, if all observed Ly emission is attributed to
resonant scattering, the H column is greater than
cm-2, assuming cosmic abundances.
The significance of a discrete RRC emission feature rises as the
column density of the scattering medium increases. In particular,
the flux ratio of the RRC to Ly
rises from to 1.0 as the column density increases from
cm-2 to cm-2. This is demonstrated
using an atomic-state kinetics model in figures 1 and 2 of
Behar et al. (2002). If we can estimate the luminosity and spectrum
of the central source when it is obscured, we could get a rough idea
of the covering fraction of the emitting gas.
For recombination or collisional line excitation the emission measure
formalism can be applied to derive the product of density square and
volume, , and independent measurement of either quantity gives
the other.
4.2 Obscuration of the continuum in SSe
Independent of the formation mechanisms of the emission lines,
the decisive difference between SSa and SSe is the brightness
of the continuum relative to the strengths of emission lines
which are about the same in both subclasses. The most likely
explanation for the weaker continuum emission in SSe is
obscuration of the central source while some continuum emission
can escape obscuration via Thomson scattering and reprocessing.
4.2.1 Comparison to obscured and unobscured AGN
Obscuration of the continuum with remaining predominant emission lines
as in our SSe spectra has also been observed in some Active Galactic
Nuclei (AGN). Indeed, this is the central concept of the unified model
of AGN, in which the spectrum observed is strongly dependant on whether
the accretion structures of the central supermassive black hole are
observed at low or high inclination, leading to a view which is
unobscured (type I) or obscured (type II) by a dusty torus at large
radii respectively (Antonucci & Miller, 1985).
For example, Kinkhabwala et al. (2002); Brinkman et al. (2002) describe such an emission
line spectrum from NGC 1068 and conclude that it is produced by
photoionisation and photoexcitation, followed by recombination
and de-excitation, respectively, either directly into the ground
state or into lower excited states from where they cascade into the
ground state. An AGN spectrum equivalent to an SSa is that of the
unobscured AGN NGC 3783.
Kaspi et al. (2002) report the detection of 135 absorption lines, 42
of which are unblended. In addition, they report
line emission ”filling in” the absorption, while the combination
of absorption and emission lines is not interpreted as a P Cygni
profiles. Their figure 1 around 19 Å looks like the SSS spectrum
of KT Eri around 24 Å with one single emission line
clearly detectable above the continuum (Fig. 2).
In the case of NGC 3783, there are clear emission lines at
longer wavelengths where there is no continuum which can
be explained by photoexcitation by the high-energy continuum.
On the other hand, emission lines belonging to transitions
with energies higher than the Wien tail of an SSS continuum
can not be photo-excited.
Detailed analysis of a mixture of continuum emission and
emission lines seen in NGC 1365 (figure 2 in Guainazzi et al. 2009)
reveals a mixture of collisional and photo-ionisation.
Important features in the X-ray spectra of obscured AGN arise from RRC features which Guainazzi et al. (2009) attribute to a photoionised plasma. Their width depends on the mean electron velocity, or kinetic electron temperature. RRCs can only be observed in a plasma of electron temperatures up to some 100 eV, not sufficient to reach the ionisation stages of observed lines such as O viii via collisional ionisation. The presence of narrow RRC features is a strong indicator for a cool plasma that reaches high ionisation stages via photoionisation.
The inverse process, absorption during ionisation, leads to absorption edges in the ionising continuum spectrum at the same energies as RRCs. In perfect ionisation equilibrium, neither RRC nor ionisation edges are observable. In obscured AGN, the ionisation source cannot be seen, and the recombination emission from the photoionised plasma is not balanced by the continuum emission with absorption edges from the source.
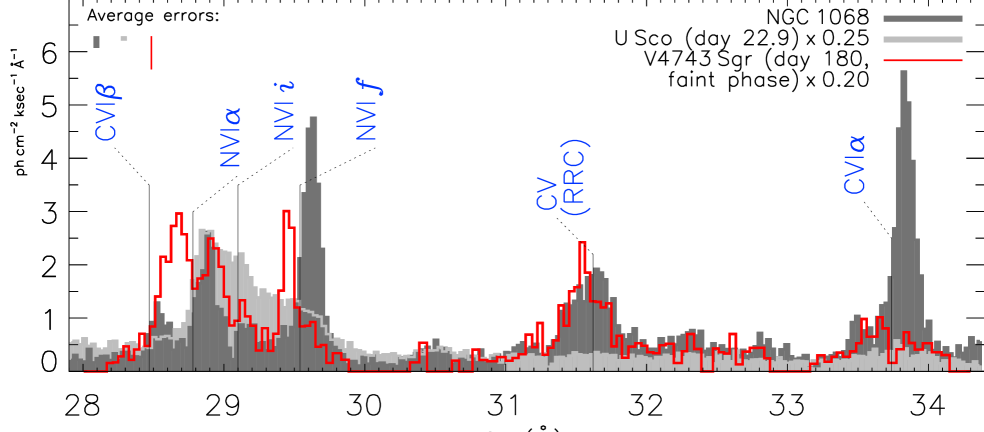
The only nova spectrum with RRC features was taken during the intermittent faint state in V4743 Sgr reported by Ness et al. (2003). In Fig. 9, we compare an XMM-Newton spectrum of the AGN NGC 1068 with U Sco and the faint spectrum of V4743 Sgr with scaling factors applied as given in the legend. Apart from a scaling factor, the C v RRC feature at 31.5 Å is identical in NGC 1068 and V4743 Sgr. The same width indicates similar electron temperatures. Also the strength in relation to the N vi lines is remarkably similar, however, the N vi lines are red shifted in NGC 1068 and blue shifted in V4743 Sgr while the C v RRC feature resides at the rest wavelength. The spectrum of U Sco contains no RRC features (Orio et al., 2013), suggesting a different formation origin.
4.2.2 Approximation of luminosity in SSa and SSe
To illustrate the effect of continuum obscuration further, we
compare the bolometric luminosities derived for SSa and SSe
spectra. To avoid the ambiguity from the large parameter space
of atmosphere models, we focus here
on blackbody fits to illustrate the effects.
Obtaining well constrained, credible parameters
from atmosphere models is not the purpose of this project.
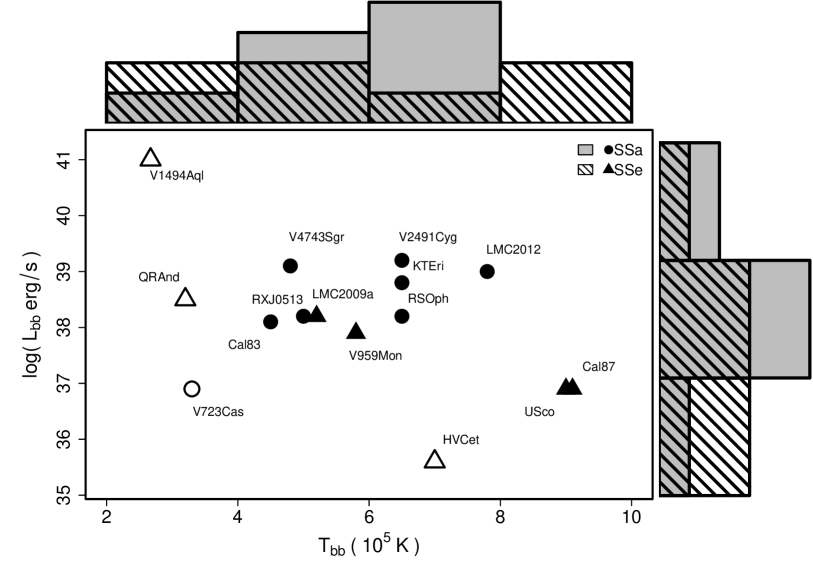
We use the parameters of the light blue blackbody curves
included in Fig. 1, and in the top panel of
Fig. 10, we
show the values of versus .
It is well known that blackbody fits can yield
unrealistic luminosities (Krautter et al., 1996) and
consequently also temperatures. We use the values
as indicators without giving error bars, as they are
not the result of a full-physics modelling of the data.
Atmosphere models have more flexibility to stay below
the Eddington luminosity (see, e.g., Balman et al. 1998; Page et al. 2010),
but there is no unique way of accomplishing that, and the
multitude of possibilities may obscure the point we are aiming
at. Major sources of uncertainty are the distance (values used are
given in Table 2) and contamination by
blending absorption and/or emission lines that complicate the
determination of an appropriate model which we caution again
was only done manually.
In addition, sources with high values
of suffer from a high degree of systematic uncertainty
as a large fraction of the radiation from the source is actually
not visible to us and thus not available to constrain models
that correspond to different values in bolometric luminosity and
effective temperature.
The results for the new subclasses SSa and SSe are plotted
with bullet and triangular symbols, respectively.
In the top and right of the plot, distribution histograms
are shown indicating that the distribution in temperature and
luminosity yields higher values for SSa spectra.
Clearly, the sample is too small to draw reliable conclusions,
and more sources are desirable to populate the diagram.
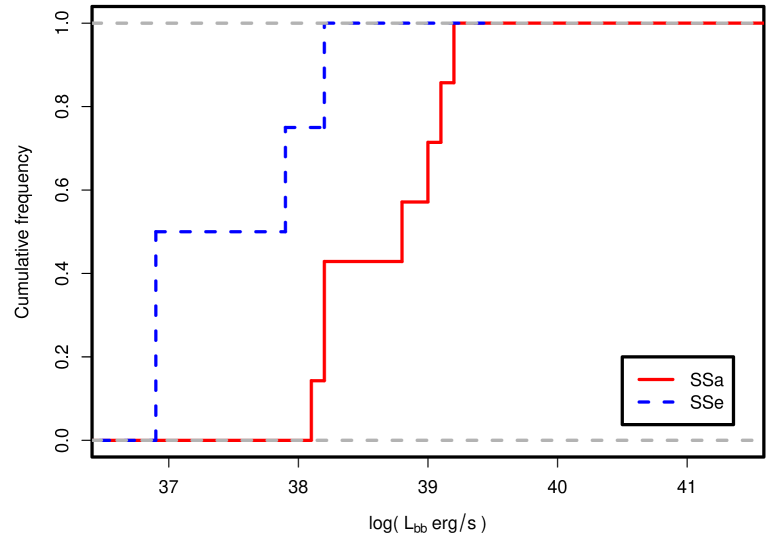
In the bottom panel of Fig. 10, cumulative distributions are shown for the luminosities derived from SSe (blue) and SSa (red) that have more secure values. The distributions clearly show that systematically lower luminosities are derived for SSe spectra. A Wilcoxon rank sum test rejects the null hypothesis that both luminosity distributions agree on the 95% confidence level, thus supporting the conclusion that the central source is obscured in SSe compared to SSa.
4.3 Effects from an accretion disc
We found a systematic trend of high-inclination systems
displaying SSe spectra with no confirmed case of an SSa
spectrum emitted by a high-inclination system. The most
obvious reason for obscuration of the central continuum
in high-inclination systems is the accretion disc if present.
The phenomenon of predominance of emission lines over weak
continuum in high-inclination systems has also been observed
dwarf novae (DNe) in outburst
(Hamilton et al., 2007), revealing similar conclusions drawn from
the X-ray grating spectrum of U Sco (Ness et al., 2012a).
Kuulkers et al. (2006) summarise that in DNe, eclipses affect
the continuum more strongly than the lines which is
consistent with our observation that SSe generally have
relatively weaker continuum than SSa. Eclipsing DNe
such as WZ Sge and OY Car are dominated more by emission
lines than systems with lower inclination angle such as
SS Cyg (Mauche, 2004).
Mauche & Raymond (2000) found good spectral fits to EUVE
spectra of OY Carinae using a model similar to obscured AGN
(=Seyfert 2 galaxies) wherein the EUV radiation from the central
regions and the disc is scattered into the line of sight by the
system’s photo-ionised disc wind. Similar processes were
also observed in Low Mass X-ray Binaries (LMXB) which contain a
neutron star that accretes via an accretion disc from a
low-mass companion star. Kallman et al. (2003) presented
X-ray grating spectra of the high-inclination LMXB
2S 0921-63
and also pointed out the analogous nature to obscured
AGN as we do in Sect. 4.2.1.
To determine the limiting angle above which the central source
is obscured by the accretion disc, we consider the ratio of the
disc radius and the outer disc edge which can be
estimated as a function of , (primary and secondary
masses, respectively) and orbital period. A standard thin -disc
approximation (Frank et al., 1992)
yields , thus is small compared to
(and also to the white dwarf), allowing occultation
only at extremely high inclination
angles. However, there are additional processes that lead to
a thicker outer edge of the disc such as the impact of the accretion
stream from the secondary star (e.g., Frank et al. 1987; Armitage & Livio 1998, invoked by Page et al. 2013)
or the presence of the hot central SSS source irradiating the
disc at a level of several
K (Suleimanov et al., 1999, 2003). Accounting for
the resulting ”spray” at the outer disc edge, can
reach values from 0.25 to 0.4 (see figure 3 in Schandl et al. 1997),
thus yielding large disc heights compared to the radius of
the central source. The spray can then eclipse the white dwarf also at
lower inclination angle. From simple trigonometry, the arctangent
of the ratio gives the angle between the disc plane and the white
dwarf-spray line. It is the angle below which the white dwarf is
obscured by the spray (assuming the white dwarf being
a point source). The resulting inclination ( this angle) is
approximately for and for
. The central source can then be obscured by the spray
above inclination, in the range from 333We
note that, if the accretion disc is tilted or warped, the lower limit
on the limiting angle can be even lower..
From trigonometric considerations, we find that for inclination
angles below , the white dwarf
is unobscured, yielding an SSa spectrum, while above , a
pure SSe spectrum is expected, which is confirmed by
Fig. 1. Between these two values, the white dwarf
is partially eclipsed, yielding hybrid spectra between SSa and
SSe. Since the spray is unlikely to be uniform in height above the
disc, transitions between SSa and SSe may vary with the orbit,
however, this can not be confirmed from the observations so far.
While an accretion disc is present in persistent SSS, CVs in
general, and in DNe, it might be absent in novae during their
SSS phase. The
initial explosion destroys the accretion disc. For
example for U Sco, Drake & Orlando (2010) performed
hydrodynamic simulations of the initial blast concluding that
the accretion disc was completely destroyed.
For the novae
in our sample, the disc may have either re-formed before our
spectra were obtained, or it was never destroyed in the first place
as proposed by, e.g., Walter & Battisti (2011).
First signs of re-establishment of the accretion disc in U Sco
were renewed optical flickering some 7 days after outburst
(Worters et al., 2010; Munari et al., 2010). While a time scale of 7 days
would be consistent with predictions of the mass loss rate from
the companion by Hachisu et al. (2000), any renewed disc build-up
needs to overcome the dynamic pressure of the radiatively driven
outflow from the evolving central object at this early time
(Drake & Orlando, 2010). Meanwhile, the X-ray studies during the
later SSS phase have shown that an accretion disc may have
reformed by the start of the SSS phase (Ness et al., 2012a).
At a later time, the wind from the central object may have
weakened. Furthermore, a disc may reform more rapidly after
a nova explosion because of the heating effect on the secondary
star that would cause enhanced Roche lobe overflow
(e.g. van den Heuvel et al., 1992).
4.4 Other sources of X-ray variability
The transitions between SSa and SSe were not seen during
fainter episodes of RS Oph (see Fig. 5),
and this system has in fact shown a correlation between
brightness and hardness, lagging by 1000 seconds
(Ness et al., 2007b; Schönrich & Ness, 2008). Associated changes in spectral
shape suggest a physical origin such as photospheric
expansion, leading to a decrease in brightness and
shift of the SED to longer wavelengths at which the
radiation is absorbed by the interstellar medium
(Ness et al., 2007a).
Also, the decline in brightness in V4743 Sgr has been accompanied with a softening of the X-ray spectrum (Ness et al., 2003), and it is also the only nova showing RRC features during a faint state (Fig. 9). Recently, Rajoelimanana et al. (2013) have studied X-ray on- and off states in Cal 83 which are inversely correlated with optical high- and low states. They found a softening of the X-ray spectrum when the source increases in optical brightness. Perhaps the underlying processes to this type of variability are related to the high-amplitude variations frequently seen in novae during the early SSS phase. While the discussion of variability deserves close inspection, this is beyond the scope of this paper.
5 Summary and Conclusions
Before XMM-Newton and Chandra revolutionised X-ray astronomy,
the observed SSS spectra seen as plain blackbodies with no
features in them that could be used to sensibly constrain
any more sophisticated models. The X-ray gratings that can
resolve lines are required to explore SSS spectra to deeper
limits. These limits have not yet been reached by
current-generation models, and we focus only on the
data.
Over the last 13 years, high-resolution grating spectra of SSS and various types of novae during their SSS phase have been obtained. Here, we studied all available grating spectra and found remarkable similarities between some of them, even when taken from different systems at different times since outburst. While some SSS spectra exhibit emission from a photosphere with absorption lines, others are dominated by emission lines on top of a weak blackbody-like continuum. We define two SSS classes SSa and SSe for the former and latter types, respectively:
-
•
The SSa class shows an X-ray spectrum of a blackbody-like continuum with clearly visible absorption lines. Emission lines may be present but are difficult to see.
-
•
The SSe class shows an X-ray spectrum that is clearly dominated by emission lines from well-known species. They also contain a weak blackbody-like continuum of comparable intensities to the emission lines but without clear absorption lines.
We found two pairs of almost identical SSa spectra,
RS Oph/V2491 Cyg and V4743 Sgr/KT Eri,
and one pair of identical SSe spectra, U Sco/Cal 87.
In addition, various intermediate spectra
have been observed that contain characteristics of
both.
All the evidence we gathered together points to an interpretation of obscuration of the central source in SSe spectra compared to SSa spectra:
-
•
Systems with high inclination angles are seen to have SSe spectra.
-
•
In some novae, we find both SSa and SSe states, where the SSe state was always seen during episodes of reduced brightness, indicating obscuration of the continuum component.
-
•
If the white dwarf is completely blocked, e.g. by the companion, blackbody-like continuum emission may still be observable because of Thomson scattering and reprocessing.
-
•
We observed stronger emission lines in SSe at wavelengths where the underlying continuum is stronger, indicating photoexcitations as part of resonant line scattering.
-
•
SSa spectra may contain emission lines of the same strengths as in SSe which are hidden between complex atmospheric features.
-
•
Blackbody fits to the continuum component yield systematically lower luminosities in SSe than in SSa.
-
•
Similar phenomena are known for other types of CVs, dwarf novae. Resemblance of an SSe spectrum with that of an obscured AGN supports an interpretation that central continuum emission is obscured in SSe.
Permanent obscuration in high-inclination angle systems implies
the presence of an accretion disc. In nova systems, the disc
may either have survived the initial explosion or it has
reformed by the time of the start of the SSS phase.
We caution, however, that not all observed variability need be attributed to obscuration. The high amplitude oscillations in RS Oph described by Osborne et al. (2011) have not shown the characteristic fading to an SSe spectrum, but associated hardness changes. Likewise, recent studies of on- and off states in Cal 83 point to physical effects as hardness changes also occur during transitions between on- and off states. These effects are not the subject of this work but deserve closer inspection.
Acknowledgements.
We thank the referee for a most inspiring and encouraging report. The authors appreciate useful discussions with M. Giustini about AGNs. We thank S.N. Shore who has helped with useful comments. This research has made use of data obtained with the gratings on board XMM-Newton and Chandra. XMM-Newton is an ESA science mission with instruments and contributions directly funded by ESA Member States and NASA. Software provided by the Chandra X-ray Center (CXC) in the application package CIAO was used to obtain science data. K.L. Page, J.P. Osborne, and A.P. Beardmore acknowledge financial support from the UK Space Agency. A. Dobrotka was supported by the Slovak Academy of Sciences Grant No. 1/0511/13 and by the ESA international fellowship. M. Henze acknowledges support from an ESA fellowship. V.A.R.M. Ribeiro acknowledges the South African SKA Project for funding the postdoctoral fellowship at the University of Cape Town. M. Hernanz acknowledges the Spanish MICINN grant AYA2011-24704 and FEDER funds. SS acknowledges partial support from NASA and NSF grants to ASU.References
- Alcock et al. (1997) Alcock, C., Allsman, R. A., Alves, D., et al. 1997, MNRAS, 286, 483
- Antonucci & Miller (1985) Antonucci, R. R. J. & Miller, J. S. 1985, ApJ, 297, 621
- Armitage & Livio (1998) Armitage, P. J. & Livio, M. 1998, ApJ, 493, 898
- Balman et al. (1998) Balman, S., Krautter, J., & Ögelman, H. 1998, ApJ, 499, 395
- Barry et al. (2008) Barry, R. K., Mukai, K., Sokoloski, J. L., et al. 2008, in Astronomical Society of the Pacific Conference Series, Vol. 401, RS Ophiuchi (2006) and the Recurrent Nova Phenomenon, ed. A. Evans, M. F. Bode, T. J. O’Brien, & M. J. Darnley, 52
- Barsukova & Goranskii (2003) Barsukova, E. A. & Goranskii, V. P. 2003, Astronomy Letters, 29, 195
- Beardmore et al. (2012) Beardmore, A. P., Osborne, J. P., Page, K. L., et al. 2012, A&A, 545, A116
- Becker et al. (1998) Becker, C. M., Remillard, R. A., Rappaport, S. A., & McClintock, J. E. 1998, ApJ, 506, 880
- Behar et al. (2002) Behar, E., Kinkhabwala, A., Sako, M., et al. 2002, in Astronomical Society of the Pacific Conference Series, Vol. 255, Mass Outflow in Active Galactic Nuclei: New Perspectives, ed. D. M. Crenshaw, S. B. Kraemer, & I. M. George, 43
- Beuermann et al. (1995) Beuermann, K., Reinsch, K., Barwig, H., et al. 1995, A&A, 294, L1
- Bode (1987) Bode, M. F. 1987, in RS Ophiuchi (1985) and the Recurrent Nova Phenomenon, ed. M. F. Bode, 241
- Bos et al. (2001) Bos, M., Retter, A., McCormick, J., & Velthuis, F. 2001, IAUcirc, 7610, 2
- Brinkman et al. (2002) Brinkman, A. C., Kaastra, J. S., van der Meer, R. L. J., et al. 2002, A&A, 396, 761
- Burwitz et al. (2008) Burwitz, V., Reinsch, K., Greiner, J., et al. 2008, A&A, 481, 193
- Burwitz et al. (2002a) Burwitz, V., Starrfield, S., Krautter, J., & Ness, J.-U. 2002a, in American Institute of Physics Conference Series, Vol. 637, Classical Nova Explosions, ed. M. Hernanz & J. José, 377–380
- Burwitz et al. (2002b) Burwitz, V., Starrfield, S., Krautter, J., & Ness, J.-U. 2002b, in High Resolution X-ray Spectroscopy with XMM-Newton and Chandra, ed. G. Branduardi-Raymont
- Chesneau et al. (2011) Chesneau, O., Meilland, A., Banerjee, D. P. K., et al. 2011, A&A, 534, L11
- Crampton et al. (1987) Crampton, D., Cowley, A. P., Hutchings, J. B., et al. 1987, ApJ, 321, 745
- Darnley et al. (2012) Darnley, M. J., Ribeiro, V. A. R. M., Bode, M. F., Hounsell, R. A., & Williams, R. P. 2012, ApJ, 746, 61
- Della Valle et al. (2002) Della Valle, M., Pasquini, L., Daou, D., & Williams, R. E. 2002, A&A, 390, 155
- Dobrotka et al. (2008) Dobrotka, A., Retter, A., & Liu, A. 2008, A&A, 478, 815
- Dobrzycka & Kenyon (1994) Dobrzycka, D. & Kenyon, S. J. 1994, AJ, 108, 2259
- Drake & Orlando (2010) Drake, J. J. & Orlando, S. 2010, ApJL, 720, 195
- Ebisawa et al. (2001) Ebisawa, K., Mukai, K., Kotani, T., et al. 2001, ApJ, 550, 1007
- Ebisawa et al. (2010) Ebisawa, K., Rauch, T., & Takei, D. 2010, AN, 331, 152
- Frank et al. (1992) Frank, J., King, A., & Raine, D. 1992, Accretion power in astrophysics.
- Frank et al. (1987) Frank, J., King, A. R., & Lasota, J.-P. 1987, A&A, 178, 137
- Goranskij et al. (2007) Goranskij, V. P., Katysheva, N. A., Kusakin, A. V., et al. 2007, Astrophysical Bulletin, 62, 125
- Greiner (1996) Greiner, J., ed. 1996, Lecture Notes in Physics, Berlin Springer Verlag, Vol. 472, Supersoft X-Ray Sources
- Greiner et al. (1991) Greiner, J., Hasinger, G., & Kahabka, P. 1991, A&A, 246, L17
- Greiner et al. (2004) Greiner, J., Iyudin, A., Jimenez-Garate, M., et al. 2004, in Revista Mexicana de Astronomia y Astrofisica Conference Series, Vol. 20, Revista Mexicana de Astronomia y Astrofisica Conference Series, ed. G. Tovmassian & E. Sion, 18
- Guainazzi et al. (2009) Guainazzi, M., Risaliti, G., Nucita, A., et al. 2009, A&A, 505, 589
- Hachisu et al. (2004) Hachisu, I., Kato, M., & Kato, T. 2004, ApJL, 606, L139
- Hachisu et al. (2000) Hachisu, I., Kato, M., Kato, T., Matsumoto, K., & Nomoto, K. 2000, ApJL, 534, L189
- Hamilton et al. (2007) Hamilton, R. T., Urban, J. A., Sion, E. M., et al. 2007, ApJ, 667, 1139
- Hartmann & Heise (1996) Hartmann, H. W. & Heise, J. 1996, in Lecture Notes in Physics, Berlin Springer Verlag, Vol. 472, Supersoft X-Ray Sources, ed. J. Greiner, 25
- Hartmann & Heise (1997) Hartmann, H. W. & Heise, J. 1997, A&A, 322, 591
- Hauschildt et al. (1992) Hauschildt, P. H., Wehrse, R., Starrfield, S., & Shaviv, G. 1992, ApJ, 393, 307
- Helton et al. (2008) Helton, L. A., Woodward, C. E., Vanlandingham, K., & Schwarz, G. J. 2008, CBET, 1379, 1
- Hounsell et al. (2010) Hounsell, R., Bode, M. F., Hick, P. P., et al. 2010, ApJ, 724, 480
- Hutchings et al. (2002) Hutchings, J. B., Winter, K., Cowley, A. P., Schmidtke, P. C., & Crampton, D. 2002, AJ, 124, 2833
- Iijima & Esenoglu (2003) Iijima, T. & Esenoglu, H. H. 2003, A&A, 404, 997
- Kahabka (1996) Kahabka, P. 1996, A&A, 306, 795
- Kahabka (1997) Kahabka, P. 1997, in Astronomical Society of the Pacific Conference Series, Vol. 121, IAU Colloq. 163: Accretion Phenomena and Related Outflows, ed. D. T. Wickramasinghe, G. V. Bicknell, & L. Ferrario, 730
- Kahabka et al. (1994) Kahabka, P., Pietsch, W., & Hasinger, G. 1994, A&A, 288, 538
- Kahabka & van den Heuvel (1997) Kahabka, P. & van den Heuvel, E. P. J. 1997, ARA&A, 35, 69
- Kallman et al. (2003) Kallman, T. R., Angelini, L., Boroson, B., & Cottam, J. 2003, ApJ, 583, 861
- Kaspi et al. (2002) Kaspi, S., Brandt, W. N., George, I. M., et al. 2002, ApJ, 574, 643
- Kinkhabwala et al. (2002) Kinkhabwala, A., Sako, M., Behar, E., et al. 2002, ApJ, 575, 732
- Krautter et al. (1996) Krautter, J., Ögelman, H., Starrfield, S., Wichmann, R., & Pfeffermann, E. 1996, ApJ, 456, 788
- Kuulkers et al. (2006) Kuulkers, E., Norton, A., Schwope, A., & Warner, B. 2006, X-rays from cataclysmic variables, ed. W. H. G. Lewin & M. van der Klis (Cambridge Astrophysics Series, No. 39, Cambridge University Press), 421
- Lanz et al. (2005) Lanz, T., Telis, G. A., Audard, M., et al. 2005, ApJ, 619, 517
- Long et al. (1981) Long, K. S., Helfand, D. J., & Grabelsky, D. A. 1981, ApJ, 248, 925
- Lyke & Campbell (2009) Lyke, J. E. & Campbell, R. D. 2009, AJ, 138, 1090
- Macri et al. (2006) Macri, L. M., Stanek, K. Z., Bersier, D., Greenhill, L. J., & Reid, M. J. 2006, ApJ, 652, 1133
- Mauche (2004) Mauche, C. W. 2004, in Revista Mexicana de Astronomia y Astrofisica, vol. 27, Vol. 20, Revista Mexicana de Astronomia y Astrofisica Conference Series, ed. G. Tovmassian & E. Sion, 174
- Mauche & Raymond (2000) Mauche, C. W. & Raymond, J. C. 2000, ApJ, 541, 924
- McGowan et al. (2005) McGowan, K. E., Charles, P. A., Blustin, A. J., et al. 2005, MNRAS, 364, 462
- Morgan et al. (2003) Morgan, G. E., Ringwald, F. A., & Prigge, J. W. 2003, MNRAS, 344, 521
- Mukai & Ishida (2001) Mukai, K. & Ishida, M. 2001, ApJ, 551, 1024
- Munari et al. (2010) Munari, U., Dallaporta, S., & Castellani, F. 2010, Information Bulletin on Variable Stars, 5930, 1
- Munari et al. (2013) Munari, U., Dallaporta, S., Castellani, F., et al. 2013, ArXiv e-prints
- Nelson et al. (2008) Nelson, T., Orio, M., Cassinelli, J. P., et al. 2008, ApJ, 673, 1067
- Ness (2010) Ness, J. 2010, Astronomische Nachrichten, 331, 179
- Ness et al. (2009a) Ness, J., Drake, J. J., Beardmore, A. P., et al. 2009a, AJ, 137, 4160
- Ness et al. (2009b) Ness, J., Drake, J. J., Starrfield, S., et al. 2009b, AJ, 137, 3414
- Ness et al. (2011) Ness, J., Osborne, J. P., Dobrotka, A., et al. 2011, ApJ, 733, 70
- Ness et al. (2012a) Ness, J., Schaefer, B. E., Dobrotka, A., et al. 2012a, ApJ, 745, 43
- Ness et al. (2007a) Ness, J., Schwarz, G. J., Retter, A., et al. 2007a, ApJ, 663, 505
- Ness et al. (2007b) Ness, J., Starrfield, S., Beardmore, A., et al. 2007b, ApJ, 665, 1334
- Ness et al. (2003) Ness, J., Starrfield, S., Burwitz, V., et al. 2003, ApJL, 594, L127
- Ness et al. (2005) Ness, J., Starrfield, S., Jordan, C., Krautter, J., & Schmitt, J. H. M. M. 2005, MNRAS, 364, 1015
- Ness (2012) Ness, J. U. 2012, Bulletin of the Astronomical Society of India, 40, 353
- Ness et al. (2012b) Ness, J.-U., Shore, S. N., Drake, J. J., et al. 2012b, The Astronomer’s Telegram, 4569, 1
- Orio et al. (2013) Orio, M., Behar, E., Gallagher, J., et al. 2013, MNRAS, 429, 1342
- Orio et al. (2001) Orio, M., Parmar, A., Benjamin, R., et al. 2001, MNRAS, 326, L13
- Orio et al. (2002) Orio, M., Parmar, A. N., Greiner, J., et al. 2002, MNRAS, 333, L11
- Osborne et al. (2011) Osborne, J. P., Page, K. L., Beardmore, A. P., et al. 2011, ApJ, 727, 124
- Page et al. (2010) Page, K. L., Osborne, J. P., Evans, P. A., et al. 2010, MNRAS, 401, 121
- Page et al. (2013) Page, K. L., Osborne, J. P., Wagner, R. M., et al. 2013, ApJL, 768, L26
- Parmar et al. (1997) Parmar, A. N., Kahabka, P., Hartmann, H. W., et al. 1997, A&A, 323, L33
- Parmar et al. (1998) Parmar, A. N., Kahabka, P., Hartmann, H. W., Heise, J., & Taylor, B. G. 1998, A&A, 332, 199
- Ragan et al. (2009) Ragan, E., Brozek, T., Suchomska, K., et al. 2009, The Astronomer’s Telegram, 2327, 1
- Rajoelimanana et al. (2013) Rajoelimanana, A. F., Charles, P. A., Meintjes, P. J., Odendaal, A., & Udalski, A. 2013, MNRAS, 432, 2886
- Rauch et al. (2010) Rauch, T., Orio, M., Gonzales-Riestra, R., et al. 2010, ApJ, 717, 363
- Ribeiro et al. (2013a) Ribeiro, V. A. R. M., Bode, M. F., Darnley, M. J., et al. 2013a, MNRAS, 433, 1991
- Ribeiro et al. (2009) Ribeiro, V. A. R. M., Bode, M. F., Darnley, M. J., et al. 2009, ApJ, 703, 1955
- Ribeiro et al. (2011) Ribeiro, V. A. R. M., Darnley, M. J., Bode, M. F., et al. 2011, MNRAS, 412, 1701
- Ribeiro et al. (2013b) Ribeiro, V. A. R. M., Munari, U., & Valisa, P. 2013b, ApJ, 768, 49
- Rohrbach et al. (2009) Rohrbach, J. G., Ness, J., & Starrfield, S. 2009, AJ, 137, 4627
- Sala et al. (2008) Sala, G., Hernanz, M., Ferri, C., & Greiner, J. 2008, ApJL, 675, L93
- Sala et al. (2010) Sala, G., Hernanz, M., Ferri, C., & Greiner, J. 2010, Astronomische Nachrichten, 331, 201
- Schaefer (1990) Schaefer, B. E. 1990, ApJL, 355, L39
- Schaefer (2010) Schaefer, B. E. 2010, ApJS, 187, 275
- Schaeidt et al. (1993) Schaeidt, S., Hasinger, G., & Truemper, J. 1993, A&A, 270, L9
- Schandl et al. (1997) Schandl, S., Meyer-Hofmeister, E., & Meyer, F. 1997, A&A, 318, 73
- Schlegel et al. (2010) Schlegel, E. M., Schaefer, B., Pagnotta, A., et al. 2010, The Astronomer’s Telegram, 2419, 1
- Schmidtke & Cowley (2006) Schmidtke, P. C. & Cowley, A. P. 2006, AJ, 131, 600
- Schönrich & Ness (2008) Schönrich, R. A. & Ness, J.-U. 2008, in Astronomical Society of the Pacific Conference Series, Vol. 401, RS Ophiuchi (2006) and the Recurrent Nova Phenomenon, ed. A. Evans, M. F. Bode, T. J. O’Brien, & M. J. Darnley, 291
- Schwarz et al. (2011) Schwarz, G. J., Ness, J., Osborne, J. P., et al. 2011, ApJS, 197, 31
- Schwarz et al. (2008) Schwarz, G. J., Ness, J.-U., Osborne, J. P., et al. 2008, The Astronomer’s Telegram, 1847, 1
- Shore et al. (2011) Shore, S. N., Augusteijn, T., Ederoclite, A., & Uthas, H. 2011, A&A, 533, L8
- Shore et al. (2003) Shore, S. N., Schwarz, G., Bond, H. E., et al. 2003, AJ, 125, 1507
- Sokoloski et al. (2013) Sokoloski, J. L., Crotts, A. P. S., Lawrence, S., & Uthas, H. 2013, ApJl, 770, L33
- Southwell et al. (1996) Southwell, K. A., Livio, M., Charles, P. A., O’Donoghue, D., & Sutherland, W. J. 1996, ApJ, 470, 1065
- Starrfield et al. (2008) Starrfield, S., Iliadis, C., & Hix, W. R. 2008, in Classical Novae, ed. M. Bode & A. Evans (Cambridge University Press), 77
- Suleimanov et al. (1999) Suleimanov, V., Meyer, F., & Meyer-Hofmeister, E. 1999, A&A, 350, 63
- Suleimanov et al. (2003) Suleimanov, V., Meyer, F., & Meyer-Hofmeister, E. 2003, A&A, 401, 1009
- Takei et al. (2012) Takei, D., Drake, J. J., Ness, J.-U., et al. 2012, The Astronomer’s Telegram, 4116, 1
- Thoroughgood et al. (2001) Thoroughgood, T. D., Dhillon, V. S., Littlefair, S. P., Marsh, T. R., & Smith, D. A. 2001, MNRAS, 327, 1323
- Tofflemire et al. (2011) Tofflemire, B., Orio, M., Kuulkers, E., et al. 2011, The Astronomer’s Telegram, 3762, 1
- Tomov et al. (1998) Tomov, T., Munari, U., Kolev, D., Tomasella, L., & Rejkuba, M. 1998, A&A, 333, L67
- Truemper (1992) Truemper, J. 1992, QJRAS, 33, 165
- Uthas et al. (2010) Uthas, H., Knigge, C., & Steeghs, D. 2010, MNRAS, 409, 237
- van den Heuvel et al. (1992) van den Heuvel, E. P. J., Bhattacharya, D., Nomoto, K., & Rappaport, S. A. 1992, A&A, 262, 97
- van Rossum (2012) van Rossum, D. R. 2012, ApJ, 756, 43
- Vanlandingham et al. (2007) Vanlandingham, K. M., Schwarz, G., Starrfield, S., et al. 2007, in Bulletin of the American Astronomical Society, Vol. 39, American Astronomical Society Meeting Abstracts #210, 99
- Walter & Battisti (2011) Walter, F. M. & Battisti, A. 2011, in Bulletin of the American Astronomical Society, Vol. 43, American Astronomical Society Meeting Abstracts #217, #338.11
- Worters et al. (2010) Worters, H. L., Eyres, S. P. S., Rushton, M. T., & Schaefer, B. 2010, IAUC, 9114, 1