Low-energy interband transitions in the infrared response of BaFe1-xCoAs2
Abstract
We studied the doping and temperature () dependence of the infrared (IR) response of BaFe1-xCoAs2 single crystals. We show that a weak band around 1000 cm-1, that was previously interpreted in terms of interaction of the charge carriers with magnetic excitations or of a pseudogap, is rather related to low-energy interband transitions. Specifically, we show that this band exhibits a similar doping and -dependence as the hole pockets seen by angle resolved photoemission spectroscopy (ARPES). Notably, we find that it vanishes as a function of doping near the critical point where superconductivity is suppressed in the overdoped regime. Our IR data thus provide bulk specific information (complementary to the surface sensitive ARPES) for a Lifshitz transition. Our IR data also reveal a second low-energy band around 2300 cm-1 which further emphasizes the necessity to consider the multiband nature of these iron arsenides in the analysis of the optical response.
pacs:
74.70.-b, 74.25.Gz, 78.30.-jInfrared (IR) spectroscopy is a powerful tool to study the charge carrier dynamics in materials with strongly correlated electrons BasovTimusk2005 ; BasovHaule2011 . Due to its accuracy and high energy resolution, its bulk sensitivity, and the existence of powerful sum-rules it can yield valuable information about the energy scales of the electronic interactions and superconducting (SC), charge density wave (CDW) or spin density wave (SDW) states. In the cuprate high- superconductors (HTSC) the IR spectra revealed a pronounced high energy tail of the Drude-like response which arises from a strong, inelastic interaction of the charge carriers with excitations that are widely believed to be of magnetic or electronic origin since their energy scale exceeds the one of the phonons BasovTimusk2005 ; HwangGu2004 ; vHeumenVdMarel2009 . Furthermore, in the underdoped part of the phase diagram, the IR spectra exhibit a gap-like dip feature that develops already in the normal state well above the SC transition at BasovTimusk2005 ; TimuskStatt1999 . This so-called pseudogap arises from a partial suppression of the low-energy charge (and spin) excitations whose origin is debated with explanations ranging from a precursor SC state that is lacking macroscopic phase coherence to alternative electronic or magnetic correlations that may even compete with SC BasovTimusk2005 ; HwangTimusk2008 ; DubrokaBernhard2011 . Despite the ongoing controversy, the pseudogap phenomenon is often considered a hallmark of the unconventional charge dynamics of the cuprates that may be key to the high- pairing mechanism.
In 2008 the discovery of SC with up to 55 K in the iron arsenides Kamihara2008 ; ChenFang2008 ; RenZhao2008 has drawn attention to their electronic properties. A central question is whether they share the same HTSC pairing mechanism with the cuprates. In particular, antiferromagnetic (AF) fluctuations appear as promising candidates since in both families HTSC develops in close proximity to an AF order PaglioneGreene2010 . This raises the question whether for the arsenides similar signatures of strong coupling of the charge carriers to high energy excitations (well above the phonon range) can be identified in the IR spectra and whether, possibly, even a pseudogap effect can be observed. Both features have indeed been previously reported and interpreted in terms of an interaction with AF spin fluctuations YangTimusk2009 ; MoonBasov2012 ; DaiLobo2012 ; KwonBang2012 .
However, unlike the cuprates the iron arsenides are multiband superconductors with several hole-like and electron-like bands crossing the Fermi level near the center and the boundary of the Brillouin zone (BZ), respectively PaglioneGreene2010 ; SinghDu2008 . This requires great care in interpreting the IR spectra which may exhibit significant deviations from a Drude-like response due to the presence of charge carriers with different scattering rates or low-energy interband transitions BenfattoBoeri2011 . Evidence for charge carriers with different scattering rates has already been reported TuHomes2010 ; Kim2010 ; vHeumenVdMarel2010 and at least two (possibly even three) different energy gaps have been identified in the SC state WuSchachinger2010 ; Kim2010 ; vHeumenVdMarel2010 ; TuHomes2010 .
These considerations motivated us to investigate in more detail the temperature and doping dependence of the IR response of a series of BaFe1-xCoAs2 single crystals. In particular, we focus here on the evolution of a normal state feature around 1000 cm-1 which was previously interpreted in terms of a pseudogap effect or an interaction with a bosonic mode MoonBasov2012 ; TuHomes2010 . Here we show instead that this feature most likely arises from low-energy interband transitions between the Fe bands around the center of the BZ. Notably, we find that this interband transition vanishes around just as SC is fully suppressed on the overdoped side of the phase diagram. In line with previous reports of such a Lifshitz transition from ARPES LiuKaminski2011 , this suggests that the charge and spin fluctuations arising from the scattering between the hole and electron pockets play a central role in the HTSC pairing mechanism.
A series of BaFe1-xCoAs2 crystals with and SrFe1-xCoAs2 with and has been grown at KIT in Karlsruhe by a self-flux method in glassy carbon crucibles as described in Refs. Hardy2009 ; Hardy2010 . Their chemical composition has been determined with energy dispersive x-ray spectroscopy. Ca1-xLaxFe2As2 crystals with and where grown in Hefei as reported in Ref. YingChen2012 .
The infrared optical response has been measured with a home built rotating analyzer ellipsometer attached to a Bruker 113v spectrometer with a globar light source in the mid-infrared (MIR) range ( cm-1) and to a Bruker 66v at the IR1 beamline of the ANKA synchrotron in the far-infrared (FIR) range ( cm-1) Bernhard2004 . The normal incidence reflectivity spectra in the FIR range were measured with a Bruker 113v spectrometer utilizing an in situ gold coating technique as described in Refs. Homes1993 ; Kim2010 .
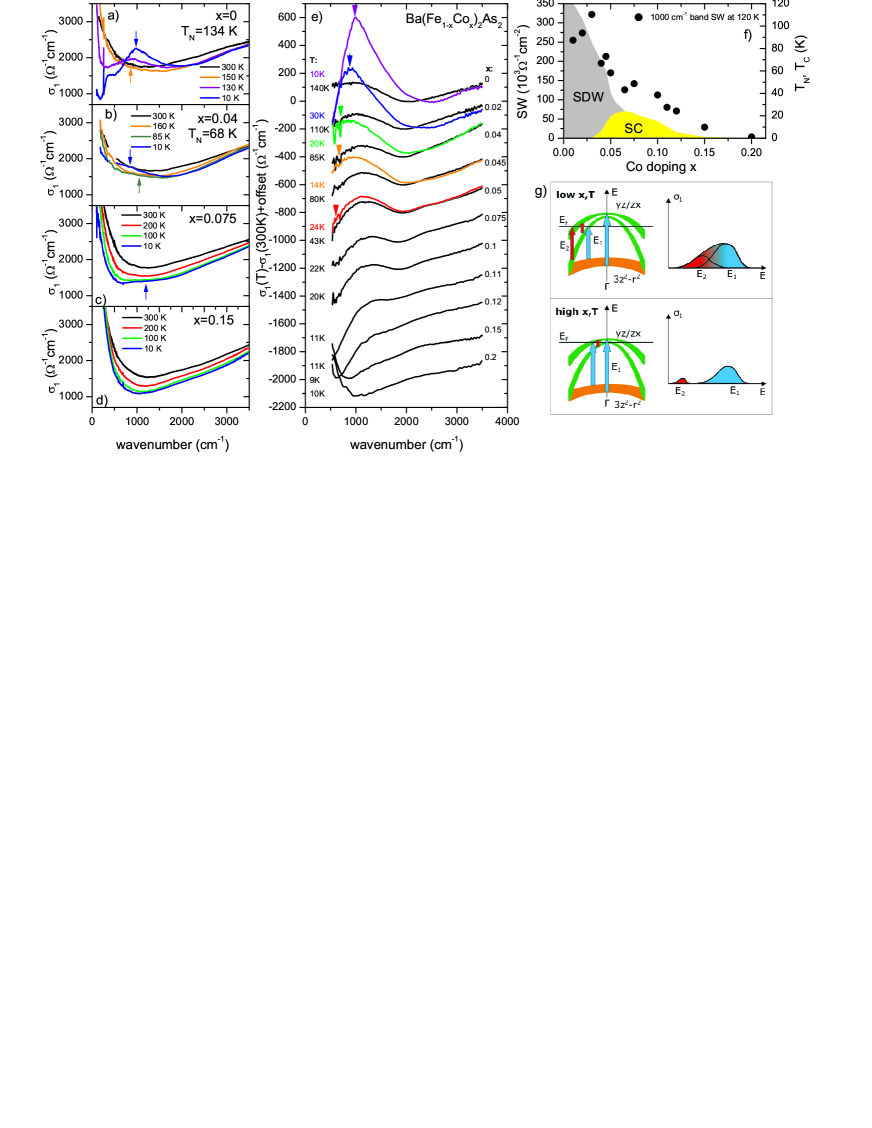
Figure 1 shows representative spectra of the in-plane optical conductivity, , of the BaFe1-xCoAs2 crystals at characteristic points of the doping phase diagram, (a) at for the undoped parent compound with a commensurate SDW state ( K), (b) at in the underdoped regime where SC ( K) and SDW order ( K) coexist, (c) at slightly beyond optimum doping ( K) where static magnetic order is already absent Bernhard2012 , and (d) at where SC has just vanished in the overdoped regime. The major features of these spectra are similar as in previous reports TuHomes2010 ; SchafgansBasov2012 ; NakajimaUchida2010 ; HuWang2008 . (i) The Drude-like upturn of toward low energy that contains (at least) two contributions due to charge carriers with smaller and larger scattering rates that have been assigned to the electron- and hole-like bands, respectively TuHomes2010 ; vHeumenVdMarel2010 ; Kim2010 ; (ii) The pronounced tail in the MIR range and the following upturn toward higher energy that were previously interpreted in terms of inelastic scattering of the charge carriers and an interband transition with a maximum around 5500 cm-1, respectively TuHomes2010 ; vHeumenVdMarel2010 . With decreasing the Drude peak becomes narrower and for all samples a sizeable spectral weight transfer occurs from the MIR region to higher energies, i.e. beyond the band at 5500 cm-1. The latter effect has been interpreted in terms of a strong Hund’s rule coupling scenario WangXiang2012 ; SchafgansBasov2012 ; GeorgesMravlje2013 .
The most prominent, additional features in the spectra develop in the SDW state. At in Fig. 1(a) the conductivity below exhibits a pronounced, gap-like suppression at low energies and two peaks that are likely due to transitions across the SDW gap (SDW peaks in the following), around 400 and 1000 cm-1 HuWang2008 . The remnant of a very narrow Drude peak below 100 cm-1 indicates that the SDW gap involves only parts of the Fermi surface and gives rise to a strongly reduced scattering rate in the remaining gapless regions. At these spectroscopic features of the SDW gap are already rather weak and incomplete. The higher SDW peak is significantly reduced in strength and shifted to a lower energy of cm-1 (marked by the upper arrow), whereas the lower peak is no more discernible Marsik2010 ; Sanna2011 . The signatures of the SC gap below cm-1 that have been previously described in Refs. NakajimaUchida2010 ; Kim2010 ; TuHomes2010 ; vHeumenVdMarel2010 ; WuSchachinger2010 ; Marsik2010 ; LucarelliDegiorgi2010 are not visible on the extended energy scale of Figs. 1(a)-1(d).
In the following we focus on the comparably much weaker normal state feature around 1000 cm-1 that is indicated by the upward arrows in Figs. 1(a)-1(c). Figure 1(e) details this feature in terms of the difference spectra, (,300 K). It shows that what appears as a plateau is indeed a well-defined band which is present over a broad range of doping starting from and disappearing around just as SC is fully suppressed in the overdoped regime.
As mentioned in the introduction, this feature was previously interpreted either in terms of a strong coupling of the charge carriers to a bosonic mode TuHomes2010 ; YangTimusk2009 or of a pseudogap effect MoonBasov2012 . In the following we present an alternative interpretation in terms of a low-energy interband transition. This interpretation arises from a detailed study of the doping and -dependence of the shape of this relatively weak peak feature which is readily well resolved in our MIR ellipsometry spectra thanks to the high precision and reproducibility of this self-normalizing technique.
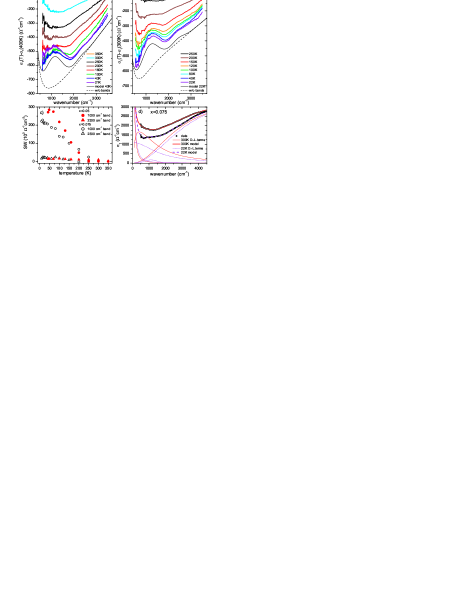
The difference spectra in Fig. 1(e) reveal that this feature corresponds to a relatively broad band with a maximum around 1000 cm-1 and a well-defined onset whose energy ( cm-1) is remarkably independent of doping. The spectral weigth, on the other hand, decreases with doping as is shown in Fig. 1(f). Figure 2 shows for the and samples that a similar trend holds for the -dependence of this band where the high energy onset once more remains almost unchanged whereas the peak intensity decreases and vanishes at K.
The relatively sharp and almost - and doping independent high energy onset of the band can be hardly reconciled with the scenario of a remnant of the SDW peak or of a strong coupling of the charge carriers to magnetic, orbital or nematic excitations. In these cases the band and its high energy onset eventually should be shifted to lower energy and become more gradual.
On the other hand, the observed trends can be readily understood in terms of interband transitions involving the hole like bands near the center of the Brillouin-zone (BZ) and along the vertical direction from to . As sketched in Fig. 1(g), likely players are the relatively flat Fe band that lies below the Fermi level and two narrower hole-like bands of which at least one reaches well above the Fermi level, as predicted by Valenzuela et al. (see Fig. 3(b) in Ref. Valenzuela2013 ). A normal state feature around 0.1 eV also appears in the conductivity spectra calculated by Yin, Haule and Kotliar YinKotliar2011 . The three bands are discernible in angle-resolved photoemission spectroscopy spectra DhakaKaminski2013 ; Sudayama2011 ; JensenColson2011 ; YiShen2009 ; Terashima2009 , for example in Fig. 1 of Ref. Terashima2009 and in Fig. 1 of Ref. Sudayama2011 . The energy difference between the lowest occupied and the highest unoccupied states of these bands is slightly in excess of 200 meV in good agreement with the onset of the interband transition in our IR spectra near 2000 cm-1 (or 250 meV). The sketch in Fig. 1(g) indicates that the 1000 cm-1 band contains two different types of interband transitions. This explains that the band is significantly broadened and does not exhibit a clearly discernible onset feature on the low energy side (in the experimental data the latter may also be obscured by the strong -dependence of the free carrier response). An additional broadening of the characteristic features of the interband transition may arise from the weak dispersion of the bands along the -direction that is predicted from band structure calculations (AndersenBoeri2011, ) and also seen in ARPES (DhakaKaminski2013, ).
The ARPES data also show that upon Co doping the hole bands are sinking below the Fermi level. The distance between these hole bands, and thus the high energy onset of the interband transition, remains almost constant as shown in Fig. 4 of Ref. Sudayama2011 . Just like the 1000 cm-1 band which vanishes around as shown in Fig. 1(f), the shrinking hole-pockets are reported to disappear near (at for point and at for point) LiuKaminski2011 . It was already pointed out in Ref. LiuKaminski2011 that this Lifshitz transition coincides with the critical point where SC vanishes on the overdoped side of the phase diagram.
A similarly good agreement with the published ARPES data exists for the -dependence of the 1000 cm-1 band. The ARPES shows that the hole-like bands in BaFe1-xCoAs2 exhibit an unusually large downward shift with increasing (by meV). The Fermi level shift is almost linear in and the hole pockets are vanishing around K DhakaKaminski2013 . A corresponding trend occurs in Fig. 2 for the 1000 cm-1 band for which the spectral weight also decreases linearly with and vanishes near 300 K. In the Supplementary online material som we show details of the model and SW estimates of Fig. 1(f) and 2(c).
The existing ARPES data and the band structure calculations therefore agree well with our interpretation of the 1000 cm-1 band in terms of low-energy interband transitions involving the hole-like bands at the center of the BZ and along the vertical direction from to . We note that our IR-spectra also show weak signatures of a second band with a maximum around 2300 cm-1. This band is not as well resolved as the band at 1000 cm-1, therefore it is difficult to make an assignment and to judge on its doping and -dependence.
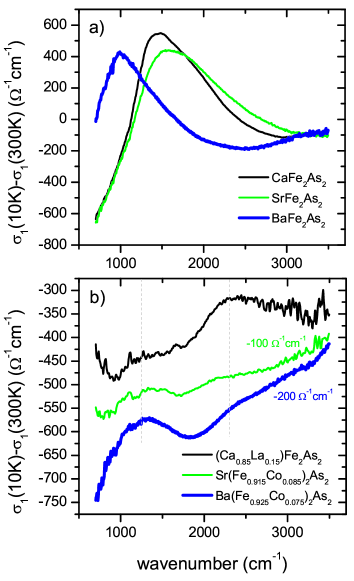
Finally, we demonstrate that the near coincidence of the peak energy of the 1000 cm-1 interband transition and the SDW peak in the undoped parent compound of the BaFe1-xCoAs2 system is accidental. This can be seen from Fig. 3 which shows the conductivity difference spectra for similar series of SrFe1-xCoAs2 and Ca1-xLaxFe2As2 crystals. The SDW peaks of the undoped CaFe2As2 and SrFe2As2 are shifted to higher energies of cm-1 roughly consistent with the increase of to 170 K and 190 K, respectively. In contrast, the two normal state peaks maintain their positions around 1000 cm-1 and 2300 cm-1, respectively. The only major difference concerns their spectral weight which varies significantly. While in BaFe0.925CoAs2 the 1000 cm-1 band has a significantly larger spectral weight, the opposite is true for Ca0.85La0.15Fe2As2 where the 2300 cm-1 band is more pronounced. The assignment of this second interband transition and the origin of its increased spectral weight in Ca0.85La0.15Fe2As2 as compared to BaFe0.925CoAs2 and SrFe0.915CoAs2 is presently unknown and should be addressed with theoretical calculations AndersenBoeri2011 .
With infrared spectroscopy, specifically with ellipsometry, we detailed the electron doping and -dependence of the optical conductivity in BaFe1-xCoAs2, SrFe1-xCoAs2 and Ca1-xLaxFe2As2 single crystals. We found that a weak band around 1000 cm-1, that was previously interpreted in terms of strong coupling of the charge carriers with magnetic excitations or of a pseudogap effect, is best explained in terms of a low-energy interband transition. This interband transition exhibits a very interesting doping dependence since it vanishes close to the critical point where SC is fully suppressed in the overdoped regime. A corresponding trend was observed in ARPES data which show that the hole pockets near the vertical axis of the BZ are shrinking with Co doping and vanish in two Lifshitz transitions located above and below the critical point. The combined, complementary information from the surface sensitive ARPES data and our truly bulk specific IR data therefore suggests that the hole pockets play an important role in the SC pairing mechanism, at least in this electron-doped 122 compound. A good agreement between our IR data and published ARPES data is obtained for the strong -dependence of these hole pockets which are shrinking with increasing and vanish at K. Our IR data reveal a second low-energy band with a maximum around 2300 cm-1 that further highlights the necessity to explicitly include the multiband nature in the analysis and interpretation of the optical response of these iron arsenide superconductors. Finally we note that our interpretation of the IR spectra does not exclude the possibility that the charge carriers are strongly interacting with magnetic, orbital or nematic fluctuations. These may be responsible for the unusually large - and doping dependent shifts of the bands near the Fermi level that are evident from the IR and ARPES data.
Acknowledgements.
This work is supported by the Schweizer Nationalfonds (SNF) grant 200020-140225. R.S. acknowledges support by the DFG project SCHU/2584/1-1. A.D. and D.M. were supported by the project CEITEC (CZ.1.05/1.1.00/02.0068). Finally, we acknowledge stimulating discussions with Dionys Baeriswyl, Belén Valenzuela and Jiří Chaloupka.References
- (1) D. N. Basov and T. Timusk, Rev. Mod. Phys. 77, 721 (2005).
- (2) D. N. Basov et al., Rev. Mod. Phys. 83, 471 (2011).
- (3) J. Hwang, T. Timusk and G. D. Gu, Nature 427, 714 (2004).
- (4) E. van Heumen et al., Phys. Rev. B 79, 184512 (2009).
- (5) T. Timusk and B. Statt, Rep. Prog. Phys. 62, 61 (1999).
- (6) J. Hwang, J. Yang, J. P. Carbotte and T. Timusk, J. Phys. Cond. Matter 20, 295215 (2008).
- (7) A. Dubroka et al., Phys. Rev. Lett. 106, 047006 (2011).
- (8) Y. Kamihara et al., J. Am. Chem. Soc. 130, 3296 (2008).
- (9) X. H. Chen et al., Nature 453, 761 (2008).
- (10) Z. A. Ren et al., Chin. Phys. Lett. 25, 2215 (2008).
- (11) J. Paglione and R.L. Greene, Nat. Phys. 6, 645 (2010).
- (12) J. Yang et al., Phys. Rev. Lett. 102, 187003 (2009).
- (13) S. J. Moon et al., Phys. Rev. Lett. 109, 027006 (2012).
- (14) Y. M. Dai et al., Phys. Rev. B 86, 100501(R) (2012).
- (15) Y. S. Kwon et al., New Journal of Physics 14, 063009 (2012).
- (16) D. J. Singh and M. H. Du, Phys. Rev. Lett. 100, 237003 (2008).
- (17) L. Benfatto, E. Cappelluti, L. Ortenzi and L. Boeri, Phys. Rev. B 83, 224514 (2011).
- (18) J. J. Tu et al., Phys. Rev. B 82, 174509 (2010).
- (19) K. W. Kim et al., Phys. Rev. B 81, 214508 (2010).
- (20) E. van Heumen, Y. Huang, S. de Jong, A. B. Kuzmenko, M. S. Golden, and D. van der Marel, Europhys. Lett. 90, 37005 (2010).
- (21) D. Wu et al., Phys. Rev. B 82, 184527 (2010).
- (22) C. Liu et al., Phys. Rev B 84, 020509(R) (2011).
- (23) F. Hardy, P. Adelmann, T. Wolf, H. v. Löhneysen, and C. Meingast, Phys. Rev. Lett. 102, 187004 (2009).
- (24) F. Hardy et al., Phys. Rev B 81, 060501(R) (2010).
- (25) J. J. Ying et al., Phys. Rev. B 85, 144514 (2012).
- (26) C. Bernhard, J. Humlíček, and B. Keimer, Thin Solid Films 455-456, 143 (2004).
- (27) C. C. Homes, M. Reedyk, D. A. Cradles, and T. Timusk, Appl. Opt. 32, 2976 (1993).
- (28) C. Bernhard et al., Phys. Rev. B 86, 184509 (2012).
- (29) A. A. Schafgans et al., Phys. Rev. Lett. 108, 147002 (2012).
- (30) M. Nakajima et al., Phys. Rev. B 81, 104528 (2010).
- (31) W. Z. Hu et al,. Phys. Rev. Lett. 101, 257005 (2008).
- (32) N. L. Wang et al., J. Phys.: Condens. Matter 24, 294202 (2012).
- (33) A. Georges, Annual Reviews of Condensed Matter Physics 4, 137-178 (2013).
- (34) P. Marsik et al., Phys. Rev. Lett. 105, 57001 (2010).
- (35) A. Sanna et al., Phys. Rev. B 83, 054502 (2011).
- (36) A. Lucarelli et al., New Journal of Physics 12, 073036 (2010).
- (37) B. Valenzuela, M. J. Calderón, G. León and E. Bascones, Phys. Rev. B 87, 075136 (2013).
- (38) Z. P. Yin, K. Haule and G. Kotliar, Nat. Phys. 7, 294 (2011).
- (39) T. Sudayama et al., J. Phys. Soc. Jpn. 80, 113707 (2011).
- (40) M. Fuglsang Jensen et al., Phys. Rev. B 84, 014509 (2011).
- (41) M. Yi et al., Phys. Rev. B 80, 174510 (2009).
- (42) R. S. Dhaka et al., Phys. Rev. Lett. 110, 067002 (2013).
- (43) K. Terashima et al., Proc. Natl. Acad. Sci. USA 106, 7330 (2009).
- (44) O. K. Andersen and L. Boeri, Ann. Phys 532, 8 (2011).
- (45) Supplementary online material.