Forward Neutral Pion Cross Section and
Spin Asymmetry Measurements at STAR
Abstract:
The STAR endcap electromagnetic calorimeter (EEMC) was designed to allow measurement of cross sections and spin observables in the forward direction, and with the full azimuth. Using the EEMC to measure double longitudinal spin asymmetries in photonic channels—such as inclusive neutral pions, prompt photon, and prompt photon + jet—allows access to within a low Bjorken- region ( at ) where is poorly constrained. Additionally, transverse spin asymmetries, shown to be zero at near zero and as large as 10% at near 4, occupy a previously unmeasured region in the 3D pseudorapidity, transverse momentum, and -Feynman phase space when measured with the EEMC. The neutral pion cross section measurement verifies that the signal of interest can be properly reconstructed and isolated from the background. Pion reconstruction techniques in the STAR EEMC will be discussed and preliminary cross-section and transverse single spin asymmetry measurements presented.
1 Introduction
The production of -mesons in collisions at GeV accesses quark and gluon distributions within the proton coupled with fragmentation functions. At intermediate pseudorapidity, the quark-gluon sub-process dominates over gluon-gluon and quark-quark sub-processes, and the lower Bjorken- is associated with the gluon. The measurements described in these proceedings, taken at an intermediate pseudorapidity (), cover previously unmeasured regions of the and transverse momentum phase space.
The longitudinal double-spin asymmetry is sensitive to the gluon polarization distribution . The longitudinal single-spin asymmetries are parity violating and are thus expected to be very small. While in the range is becoming more constrained [3], little is known for . The analyzed data cover at . Preliminary results for the longitudinal single-spin and double-spin asymmetries have been shown previously [4]. This document will focus on the new cross-section and transverse spin asymmetry results.
The measured cross section can be compared with perturbative QCD (pQCD) calculations and add information regarding the gluon to fragmentation function. Previous cross section measurements at nearby kinematics [1, 2] are typically within the pQCD prediction scale uncertainty, lying at about 0.6 to 0.8 of the central scale prediction in the region of GeV.
Several processes may contribute to the transverse single-spin asymmetry, , for , including the Sivers and Collins effects at twist-2 and higher twist effects. Measurements in different kinematic regions may help elucidate the underlying mechanisms. The measurements herein cover the previously unmeasured region and GeV.
2 Analysis
The data were taken during the 2006 RHIC run using the STAR detector [5]. A luminosity of 8.0 pb-1 was used for the cross section results and 2.8 pb-1 for the transverse asymmetry results. The average transverse beam polarization was 0.55. The endcap electromagnetic calorimeter (EEMC) is used to measure the energy and position of photons from decays. The EEMC is a lead-scintillator sampling calorimeter [6], with 60 azimuthal and 12 radial segments (denoted towers). Position information is determined through a shower maximum detector (SMD), consisting of two layers of tightly packed 1 cm wide scintillating strips. The response of each SMD plane is smoothed [7], and energy clusters are identified by a strip above 2 MeV with three strips of monotonically decreasing energy on either side. Clusters from each of the two SMD planes are paired to determine the 2D position on the EEMC, and energy deposited in the towers are used to determine the energy of the incident particles, with a tower energy resolution of . Pion candidates are formed by making all possible pairs of incident particles passing selection requirements.
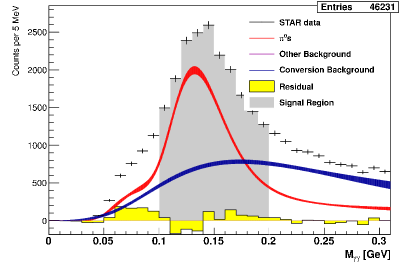
The signal fraction among the candidates was determined by fitting a linear combination of template functions to the two-photon invariant mass () distribution over the range GeV for each (or ) bin. A typical bin is shown in Figure 1. Three template functions were determined by fitting Pythia Monte Carlo data and represent (a) the signal, (b) the conversion background where the two reconstructed “photons” of the candidate were actually the two leptons from a photon that converted in upstream material, and (c) all other backgrounds, including combinatorial backgrounds. When fitting the weights of the three template functions an additional factor was also included to account for the energy scale difference between the data and the Monte Carlo.
To compute the cross section, the number of background-subtracted s was corrected for -bin smearing by applying the inverse of a smearing matrix, obtained from a Pythia/GEANT Monte Carlo simulation. The final cross section was then computed using Eq. 1,
| (1) |
where is the corrected number of s, is the sampled luminosity (including dead-time corrections), is the product of reconstruction and trigger efficiencies, BR is the branching ratio [8], is the average for the particular bin, is the width of the bin, and and are the and phase space factors. The trigger efficiency is below 10% for s with GeV, and plateaus above 40% at GeV/. The reconstruction efficiency is around 30% for GeV/, and decreases to around 20% for GeV/.
The transverse spin asymmetry was computed by binning with respect to , the angle between the azimuthal angles of the and the spin polarization vector. The raw cross ratio was computed per bin, using Eq. 2,
| (2) |
where is the number of counts and , denote the spin direction. In a right handed system where is defined by the beam momentum, spin up (down) points in the positive (negative) direction.” The quantity was fit to the equation . The background was subtracted from using the signal fraction per bin and an estimate of the background asymmetry, computed as the average of the asymmetry in the two sideband -mass regions. The background asymmetry was found to be less than from zero, with . The final result for was obtained by dividing by the luminosity weighted polarization.
3 Results
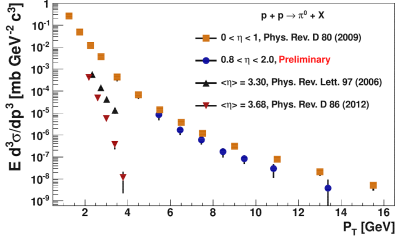
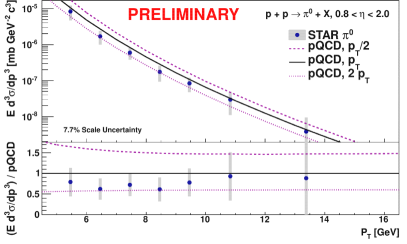
Figure 2 shows the cross section results of this analysis in comparison with previously published STAR results in other pseudorapidity and transverse-momentum regions, highlighting both the broad spectrum of coverage of the STAR detector and that this result lies in a previously unmeasured region. In Fig. 2, the cross section is also compared with a theory curved based on pQCD and global fits of distribution and fragmentation functions [10]. The EEMC cross section data points are observed to lie between the and scale. This is qualitatively consistent with published mid-rapidity STAR [1] and PHENIX results at GeV and GeV [2] where the cross section is lower than the -scale theory curve in the region of GeV.
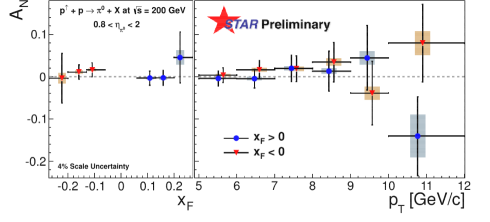
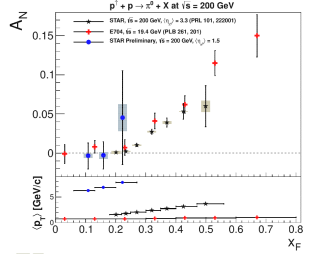
The results versus for and GeV/ are shown in Fig. 3. Systematic uncertainties include the uncertainty on the signal fraction and background asymmetry estimate, and single beam backgrounds. is consistent with zero for , as expected. As anticipated from the previous results at lower and similar [11, 12], is also consistent with zero for . The results versus , over the same range of and , are also shown in Fig. 3. Within the region of this measurement, is consistent with zero and no strong conclusions about the dependence can be made.
Acknowledgments.
The authors thank M. Stratmann for providing calculations and helpful discussions. We thank the RHIC Operations Group and RCF at BNL, our national funding agencies, and the national funding agencies of our collaborators. We also gratefully acknowledge a sponsored research grant for the 2006 run period from Renaissance Technologies Corporation.References
- [1] B. I. Abelev et al., (STAR Collaboration), Phys. Rev. D 80, 111108(R) (2009).
- [2] A. Adare et al. (PHENIX), Phys. Rev. D 76, 051106 (2007); A. Bazilevsky (PHENIX Collaboration), dependence of production in pp collisions at mid-rapidity from PHENIX (2010), presented at the American Physical Society, Spring Meeting.
- [3] D. de Florian, R. Sassot, and M. Stratmann, Phys. Rev. D 75, 114010 (2007).
- [4] S. Wissink (STAR Collaboration), in proceedings of 18th International Spin Physics Symposium, AIP Conf. Proc. 1149, 397 (2008).
- [5] K. Ackermann et al. (STAR Collaboration), Nucl. Inst. & Meth. A499, 624 (2003).
- [6] C. Allgower et al., Nucl. Inst. & Meth. A499, 740 (2003).
- [7] J. Friedman in Proc. of the 1974 CERN School of Computing, Norway, 11-24 August, 1974.
- [8] J. Beringer et al. (Particle Data Group), Phys. Rev. D 86, 010001 (2012).
- [9] J. Adams et al. (STAR Collaboration), Phys. Rev. Lett. 97, 152302 (2006); L. Adamczyk et al. (STAR Collaboration), Phys. Rev. D 86, 051101(R) (2012).
- [10] B. Jäger et al., Phys. Rev. D 67, 054005 (2003).
- [11] B. E. Bonner et al. (FNAL-E704 Collaboration), Phys. Rev. Lett. 61, 1918 (1988); D. L. Adams et al. (FNAL-E581/E704 Collaboration), Phys. Lett. B 261, 197 (1991).
- [12] B. I. Abelev et al. (STAR Collaboration), Phys. Rev. Lett. 101, 222001 (2008).