Tunable power law in the desynchronization events of coupled chaotic electronic circuits
Abstract
We study the statistics of the amplitude of the synchronization error in chaotic electronic circuits coupled through linear feedback. Depending on the coupling strength, our system exhibits three qualitatively different regimes of synchronization: weak coupling yields independent oscillations; moderate to strong coupling produces a regime of intermittent synchronization known as attractor bubbling; and stronger coupling produces complete synchronization. In the regime of moderate coupling, the probability distribution for the sizes of desynchronization events follows a power law, with an exponent that can be adjusted by changing the coupling strength. Such power-law distributions are interesting, as they appear in many complex systems. However, most of the systems with such a behavior have a fixed value for the exponent of the power law, while here we present an example of a system where the exponent of the power law is easily tuned in real time.
Since the discovery that chaotic systems may synchronize their trajectories in spite of the sensitive dependence to perturbations in each systemPecora and Carroll (1990), the subject of chaos synchronization has attracted the attention of many researchers, both from the fundamental and applied point of view, and many different forms of synchronization have been reported under diverse conditions. Likewise, the statistics of large events whose size-distribution follows power laws or other heavy-tailed models in complex systems has attracted the attention of multidisciplinary research. One of the difficulties arising in the study of many complex systems is the lack of reproducibility of the experiments under controlled conditions, issuing from the very complex nature of these usually large systems. Here we use imperfect chaos synchronization to generate rare events and further develop an analogy between heavy-tailed distributions appearing in complex systems and the statistics of desynchronization events in simple coupled chaotic systemsCavalcante et al. (2013).
I Introduction
Synchronization phenomena are widely studied in many real and idealized systems, such as electronic circuits Cuomo and Oppenheim (1993); Kim et al. (2006); Senthilkumar et al. (2010), lasers Zamora-Munt et al. (2010); Nixon et al. (2011); DeShazer et al. (2001), and maps Maritan and Banavar (1994); Pyragas (1996); Herzel and Freund (1995); Masoller, Cavalcante, and Rios Leite (2001). While one often studies the synchronization of nonlinear dynamical systems in periodic statesAcebrón et al. (2005), the synchronization of chaotic systems is even more interesting, due to the counterintuitive effect of synchronization between two systems whose trajectories are exponentially sensitive to perturbations in phase-spaceBoccaletti et al. (2002), and also due to potential applications, such as masked communications Pecora and Carroll (1990); Cuomo and Oppenheim (1993). Besides complete synchronization, one can find other generalizations to the concept, such as phase-synchronizationRosenblum, Pikovsky, and Kurths (1996) and generalized synchronizationRulkov, Sushchik, and Tsimring (1995); Kocarev and Parlitz (1996). When subject to a generic coupling, most systems will wander off the synchronized state because of noise or mismatched parameters. This is often the case of generic feedback-coupled nonlinear oscillators in which there are riddled basins of attractionAlexander et al. (1992); Ashwin, Buescu, and Stewart (1994); Maistrenko, Maistrenko, and Popovich (1998) that give rise to a phenomenon called attractor bubbling Ashwin, Buescu, and Stewart (1994); Heagy, Carroll, and Pecora (1995); Ashwin, Buescu, and Stewart (1996); Gauthier and Bienfang (1996); Venkataramani et al. (1996); Krawiecki, Hołyst, and Helbing (2002); Flunkert et al. (2009); Krawiecki (2009). As a consequence of attractor bubbling, the difference between the state variables, observed in the coupled elements (which we refer to as an error signal) shows long intervals of low values interspersed with sudden and brief departures to large values, which we call bubbles, bursts, or desynchronization events.
The distribution of sizes of these bursts have characteristic parameters similar to the ones observed in extreme events that occur in complex systems Bak (1999); Cavalcante et al. (2013). This similarity suggests that we can use coupled chaotic oscillators as a proxy for the study of extreme events in complex systems, motivated by the problem of catastrophic behavior of many natural and artificial systemsBak, Tang, and Wiesenfeld (1987); Bak (1999); White and Fornberg (1998); Solli et al. (2007); Bonatto et al. (2011). Such complex system variables usually present non-normal statistical distributions with large values of event sizes associated to the asymptotic behavior of the distribution, which can be a power law or other heavy-tailed distributionEstoup (1916); Willis and Yule (1922); Mercadier et al. (2009); Newman (2005); Sornette (1998). The value of this slope can reveal information about the mechanism producing the bursts. Complex systems typically follow power laws with a characteristic exponent . For instance, in neurological systems Klaus, Yu, and Plenz (2011), or , in coupled oscillators desynchronization Cavalcante et al. (2013), or in earthquakes analysis Christensen et al. (2002). Power-law distributions with exponents have finite first and second moments (average and variance, respectively), while for the second moment (variance) does not exist, and for even the first moment (average) is infinite. Here we show that, beyond the analysis of the probabilities of events of different sizes it is possible to tune the power law exponent itself, which has as a consequence the change of the value of the maximum event expected to occur during a given observation time. It is known that variables of many complex systems, including certain chaotic systems and systems on the edge of chaosBak (1999), follow power law statistics. Understanding the physical mechanisms for the origin of a heavy-tailed distribution of event sizes in a specific complex system may give important information about this system. For instance: power laws are scale-free, implying that large-, medium- and small-sized events all share a common mechanisms of formation. Such a lack of distinction affects the predictability of large events, as they are not discernible from the smaller ones in the earlier stages of formation.
We analyze here a nonlinear dynamical system formed by a pair of coupled chaotic oscillators and we show that the statistical distribution of one of the variables describing the state of this system presents a heavy-tailed behavior, with a very interesting property: it can evolve through a large range of the power-law exponent, which can be tuned through a control parameter. Systems with a tunable-exponent power law do not occur very often in Nature, and finding one example of a simple and rather generic system with this property can give a hint on how the exponent could be controlled in other systems where it is important. The system studied here is comprised of two electronic oscillators, each governed by a second-order differential equation driven by an external periodic force Gonçalves and Neto (2011). We use the difference between the values of the same dynamical variable in the two oscillators to generate a unidirectional feedback, coupling the oscillators in a drive/response configuration. We call error signal the difference between the variables of the oscillators, and we analyse its statistics for different values of the coupling strength. Our system exhibits three qualitatively different behaviors as we change the coupling strength: for strong coupling we observe perfect (or high-quality) synchronization; for weak or negligible coupling, the two subsystems are independent, while for intermediate ranges of coupling strength the distribution of burst sizes has a heavy tail, with large events becoming increasingly rare, as for example in power-law (Pareto) distributions found in Lévy Flights Lévy (1937); Mandelbrot (1982); Shlesinger, Zaslavsky, and Klafter (1993).
II Circuit Description

The schematic diagram of the circuit that we used as one of the chaotic oscillators (the drive system) is shown in Fig. 1. It is composed of commercial-grade resistors, capacitors, diodes and operational amplifiers. The values of the components in the drive circuit are: = 46.50 k, k, = 14.85 k, = 14.86 k, = 512 , = 14.85 k, = 14.73 nF, = 14.83 nF, = 14.83 nF. and are 2N4148 diodes and the operational amplifiers OP1 and OP2 are LF411CN.
Analysis of Kirchhoff’s laws reveals that the dynamical state of the circuit can be expressed in terms of the voltages , and , which obey a second-order differential equation with an external pumping when and Gonçalves and Neto (2011). This second-order differential equation can be written as two first-order equations:
| (1) | |||||
| (2) |
where , , , , and the characteristic time scale of the evolution of our system is , given by s. and are the voltages at the outputs of OP1 and OP2, respectively, is the external pump voltage with amplitude and frequency , and is the current passing through the diodes D1 and D2 and going to the inverting input of OP1, approximately given by
| (3) |
and plotted in Fig. 2.
Let us recall that, in order for a continuous, autonomous system to be chaotic its dynamics needs to i) be embedded in, at least, a three-dimensional (3D) phase space Strogatz (1994), and ii) have a nonlinear term. Our system has a nonlinearity in the current of Eq. (3), and the phase of the external forcing can be recast as a dynamical variable that provides for the third dimension.

By changing the values of frequency and amplitude of the external drive one can tune the system to periodic or chaotic states, in both the experimental circuit and in the numerical model. In the experimental setup, the system exhibits windows of chaotic dynamical state, for example for frequencies between 760 Hz and 820 Hz and between 950 Hz and 1.0 kHz, both with amplitude 4.0 V. Figure 3 shows a typical chaotic trajectory in phase space, acquired from the circuit (Fig. 3(a)), and obtained by numerical integration of the differential equations (1) and (2) (Fig. 3(b)). As we use a simplified model to describe the circuit of Fig. 1, we need to do a few adjustments on the parameters amplitude and frequency of the external pump voltage in the simulation in order to obtain a dynamical behavior similar to the one observed in the experiment. We are able to reproduce, in the model, all the observed oscillatory regimes, chaotic or periodic, with values of the parameters and slightly different from the ones used in the experiment. The values of resistors and capacitors are the same in the experiment and in the numerical integrations.

In order to couple two identical circuits, the voltage of the drive circuit is injected, through a feedback circuit, into the second chaotic system. In Fig. 4 we show the response circuit, highlighting the additional circuitry where the feedback signal is produced by a subtractor (operational-amplifier OP3) whose input voltages are and and the output voltage is . This feedback signal is added to the dynamics of the response subsystem, providing the coupling between the drive and the response. The parameter that measures the coupling level between the circuits is , where is a variable resistor placed at the output of the subtractor.
The values of the components of the response circuit are chosen to be as close as possible to their counterparts in the drive circuit, within a tolerance of 0.5%. Therefore, the components , , , , , , have the same values in the drive and in the response circuits, while = 14.87 nF, = 14.87 nF, = 511 have values measurably different in the response and drive circuits. The components of the subtractor circuit are: = 14.85 k, = 14.85 k, = 14.85 k, = 14.85 k. The response circuit counterparts of , , OP1 and OP2, are also the same models as in the drive circuit, and the operational amplifier OP3 is a LF411CN. A single signal generator provides the sinusoidal signal applied to both the drive and response systems.

The dynamic equations are the same for both circuits, except the coupling term, which is present only in the response circuit:
| (4) | |||||
| (5) |
In the numerical integration of the coupled system we used amplitude 3.0 V and frequency 720 Hz in Eqs. (1), (2), (4) and (5), with a parameter mismatch 1%, compound of the tolerances of the components. We set the parameters so that the experimental and numerical systems were both in the same chaotic state when uncoupled ().
In the experimental setup, the circuits were then coupled and we used a digital oscilloscope to acquire temporal series of the differences and . From these signals we obtained the distance between the drive and the response systems in the 3D phase-space. In order to facilitate the analog calculation of the distance, we used the L-1 norm to define this distance as 111In the L-1 norm the distance between two arbitrary points, and , is given by , instead of the square root of the sum of the squared differences, usual in the L-2 norm.. Time series of are shown in Fig. 5 for different values of the coupling parameter . Notice that the third dimension does not contribute to the distance, as both oscillators share the same value of (the full system is indeed 5D, instead of 6D). To compare the experimental and numerical results we used the same procedure in our integrations: we calculated the time series of , , and and then the distance (L-1 norm Note (1)) between the drive and response systems . The variable is then used to make the statistical analysis of the amplitudes of the dessynchronization bursts, discussed in the next section.

III Statistics of the error signal
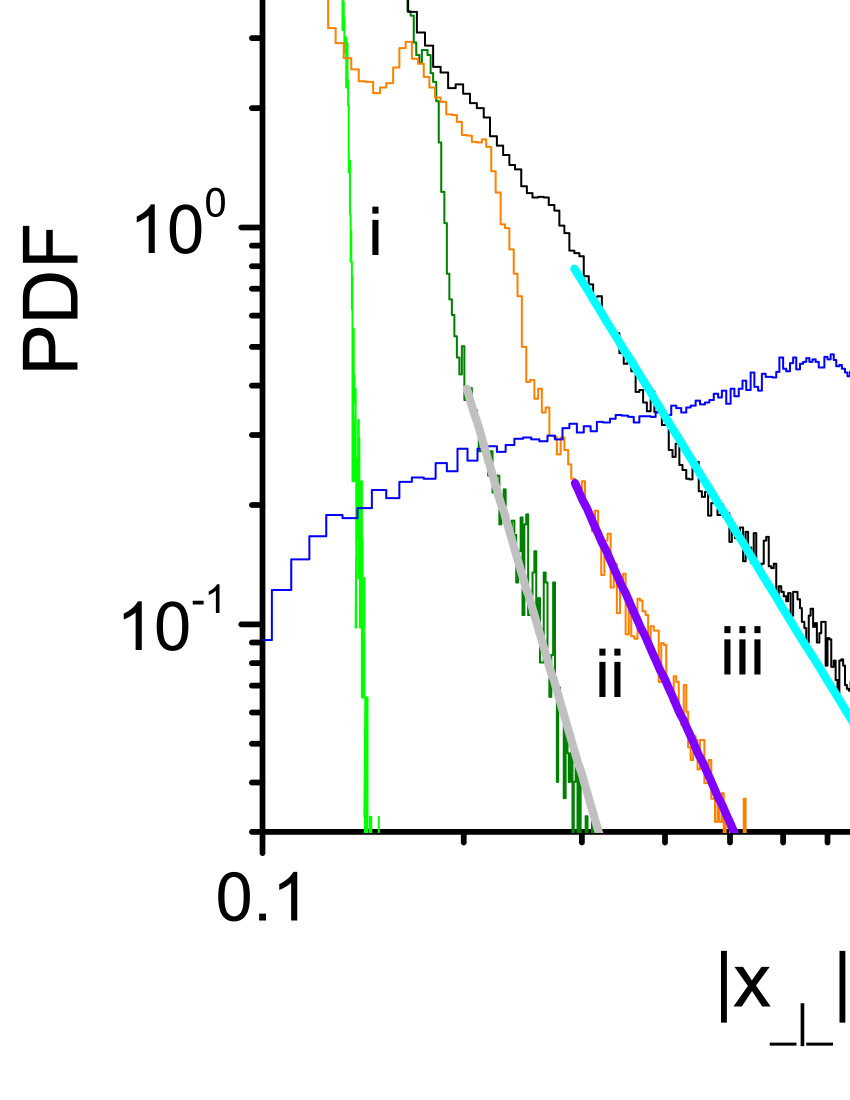
We acquired time series of with 107 points at a sample rate of 100 kHz (sampling time 10 s, series duration 100 s). To define a burst size, we first eliminate high-frequency fluctuations (noise) by applying a running average of 9 points to the time series of and build the temporal sequence of local maxima of the error signal. A maximum is detected by comparing a value of , above a threshold of 0.05 V, with its 8 nearest neighbors on both sides. The running average prevents the detection of undesired high-frequency features in the error signal (false maxima caused by noise), but the running window is shorter than the characteristic time-scale of the dynamics, so that it does not average out pulses that originate from the dynamics. The threshold in the values of accepted maxima eliminates maxima that are too small and are below the lower cutoff of the power law. The distributions of maxima are shown in Fig. 6 for different values of . These empirical distributions are obtained as normalized histograms that have unit area in a linear scale. The experimental and numerical maxima distributions present the same general behavior, as we can see in Figs. 6(a) and 6(b). The histograms show a qualitative change between three regimes when the coupling level is varied from 0.0 to 1.0. For weak coupling () the drive and response systems remain independent, and the shape of the histogram reflects the structures in the probability density function (PDF) of the two chaotic attractors, projected along the observed variable; for strong coupling () there is high-quality synchronization, with the distance between the systems fluctuating around the origin. As we tune the coupling strength from a (completely) unsynchronized state to a highly-synchronized state, , the system exhibits attractor bubbling, characterized by the occurrence of brief escapes from the state of high-quality synchronization and by a heavy-tailed distribution for .
In this regime of moderate coupling, the distributions are visually similar to power laws. They nearly follow a straight line in log-log scale, at least for a certain range of values of burst sizes. Many physical systems have limits to the maximum and minimum size produced by their variables, or to the sizes that can be observed experimentally Klaus, Yu, and Plenz (2011), hence it is common to find truncated power laws, both in the limit of large and small observables. We used such truncated power-law distributions to fit our data in log-log scale, yielding a single free parameter: the slope of the straight line, which gives the exponent of the power law. Notice that the slope of the straight-line fits in Fig. 6 changes with , indicating that it can be easily tuned. The values of the exponents obtained for different values of the coupling parameter are listed in Table 1. The error bars in this table only measure the uncertainty in the slope of the optimal linear fit (in log-scale), not the true error in the value of , which we estimate to be on the order of 15%. We see that, for between 0.5 and 0.6 the system crosses the critical value of exponent , which for the pure power law implies the divergence of the second moment of the distribution, although in our system the power law is truncated, because there is a maximum value of .
| (Experimental) | (Numerical) | |
|---|---|---|
| 0.5 | ||
| 0.6 | ||
| 0.7 |
The variation of the power-law exponents with the coupling level is confirmed by the numerical model. However, due to the simplicity of our model, the parameters and (respectively, amplitude and frequency of the external pumping) need to be adjusted to obtain better agreement between the experimental and numerical distributions. As we can see from Fig. 6(a), 6(b) and Table 1, by changing the value of in the regime of moderate coupling we are able to control the slope of the power-law distribution of the maxima series both in the experimental circuit and in the simplified numerical model. In other words, we tune the average value of , and the overall range of the distribution of this variable, turning the system more stable or unstable.

IV Conclusion
We investigated experimentally a pair of coupled chaotic oscillators and observed the regimes of high-quality synchronization, attractor bubbling and independent chaotic oscillation. The oscillators display attractor bubbling for moderate coupling strengths. The statistics of the size of the desynchronization events shows a heavy-tailed distribution, similar to truncated power laws appearing in many complex systems. Most interesting, we are able to tune the power-law exponent via the coupling parameter and, as a consequence, to change the range and the probability of large events. As far as we know there is no other reported system presenting such a property. The mechanisms responsible for the occurrence of large events and the variation of the power-law exponent have implications on the predictability of extreme events happening in complex systems. In other words, this simple system is a starting point in the search of predicting features of other, more complicated natural or artificial systems.
Acknowledgements.
We thank financial support from brazilian agencies CNPq, FINEP and CAPES. GFOJ, HLDSC, MO thank Daniel J Gauthier for useful discussions, and for pointing out the existence of bubbling in our system.References
- Pecora and Carroll (1990) L. M. Pecora and T. L. Carroll, “Synchronization in chaotic systems,” Phys. Rev. Lett. 64, 821–824 (1990).
- Cavalcante et al. (2013) H. L. D. S. Cavalcante, M. Oriá, D. Sornette, E. Ott, and D. J. Gauthier, “Predictability and suppression of extreme events in a chaotic system,” to be published (2013).
- Cuomo and Oppenheim (1993) K. M. Cuomo and A. V. Oppenheim, “Circuit implementation of synchronized chaos with applications to communications,” Phys. Rev. Lett. 71, 65–68 (1993).
- Kim et al. (2006) M.-Y. Kim, C. Sramek, A. Uchida, and R. Roy, “Synchronization of unidirectionally coupled Mackey-Glass analog circuits with frequency bandwidth limitations,” Phys. Rev. E 74, 016211 (2006).
- Senthilkumar et al. (2010) D. Senthilkumar, K. Srinivasan, K. Murali, M. Lakshmanan, and J. Kurths, “Experimental confirmation of chaotic phase synchronization in coupled time-delayed electronic circuits,” Phys. Rev. E 82, 065201 (2010).
- Zamora-Munt et al. (2010) J. Zamora-Munt, C. Masoller, J. Garcia-Ojalvo, and R. Roy, “Crowd synchrony and quorum sensing in delay-coupled lasers,” Phys. Rev. Lett. 105, 264101 (2010).
- Nixon et al. (2011) M. Nixon, M. Friedman, E. Ronen, A. A. Friesem, N. Davidson, and I. Kanter, “Synchronized cluster formation in coupled laser networks,” Phys. Rev. Lett. 106, 223901 (2011).
- DeShazer et al. (2001) D. J. DeShazer, R. Breban, E. Ott, and R. Roy, “Detecting phase synchronization in a chaotic laser array,” Phys. Rev. Lett. 87, 044101 (2001).
- Maritan and Banavar (1994) A. Maritan and J. R. Banavar, “Chaos, noise, and synchronization,” Phys. Rev. Lett. 72, 1451–1454 (1994).
- Pyragas (1996) K. Pyragas, “Weak and strong synchronization of chaos,” Phys. Rev. E 54, R4508–R4511 (1996).
- Herzel and Freund (1995) H. Herzel and J. Freund, “Chaos, noise, and synchronization reconsidered,” Phys. Rev. E 52, 3238–3241 (1995).
- Masoller, Cavalcante, and Rios Leite (2001) C. Masoller, H. L. D. S. Cavalcante, and J. R. Rios Leite, “Delayed coupling of logistic maps,” Phys. Rev. E 64, 037202 (2001).
- Acebrón et al. (2005) J. A. Acebrón, L. L. Bonilla, C. J. P. Vicente, F. Ritort, and R. Spigler, “The Kuramoto model: A simpler paradigm for synchronization phenomema,” Rev. Mod. Phys. 77, 137–185 (2005).
- Boccaletti et al. (2002) S. Boccaletti, J. Kurths, G. Osipov, D. Valladares, and C. Zhou, “The synchronization of chaotic systems,” Physics Reports 366, 1–101 (2002).
- Rosenblum, Pikovsky, and Kurths (1996) M. G. Rosenblum, A. S. Pikovsky, and J. Kurths, “Phase synchronization of chaotic oscillators,” Phys. Rev. Lett. 76, 1804–1807 (1996).
- Rulkov, Sushchik, and Tsimring (1995) N. F. Rulkov, M. M. Sushchik, and L. S. Tsimring, “Generalized synchronization of chaos in directionally coupled chaotic systems,” Phys. Rev. E 51, 980–994 (1995).
- Kocarev and Parlitz (1996) L. Kocarev and U. Parlitz, “Generalized synchronization, predictability, and equivalence of unidirectionally coupled dynamical systems,” Phys. Rev. Lett. 76, 1816–1819 (1996).
- Alexander et al. (1992) J. C. Alexander, J. A. Yorke, Z. You, and I. Kan, “Riddled basins,” Intl. J. Bifurcat. Chaos 2, 795 (1992).
- Ashwin, Buescu, and Stewart (1994) P. Ashwin, J. Buescu, and I. Stewart, “Bubbling of attractors and synchronisation of chaotic oscillators,” Phys. Lett. A 193, 126–139 (1994).
- Maistrenko, Maistrenko, and Popovich (1998) Y. L. Maistrenko, V. L. Maistrenko, and A. Popovich, “Transverse instability and riddled basins in a system of two coupled logistic maps,” Phys. Rev. E 57, 2713–2724 (1998).
- Heagy, Carroll, and Pecora (1995) J. F. Heagy, T. L. Carroll, and L. M. Pecora, “Desynchronization by periodic orbits,” Phys. Rev. E 52, R1253–R1256 (1995).
- Ashwin, Buescu, and Stewart (1996) P. Ashwin, J. Buescu, and I. Stewart, “From attractor to chaotic saddle: a tale of transverse instability,” Nonlinearity 9, 703 (1996).
- Gauthier and Bienfang (1996) D. J. Gauthier and J. C. Bienfang, “Intermittent loss of synchronization in coupled chaotic oscillators: Toward a new criterion for high-quality synchronization,” Phys. Rev. Lett. 77, 1751–1754 (1996).
- Venkataramani et al. (1996) S. C. Venkataramani, B. R. Hunt, E. Ott, D. J. Gauthier, and J. C. Bienfang, “Transitions to bubbling of chaotic systems,” Phys. Rev. Lett. 77, 5361–5364 (1996).
- Krawiecki, Hołyst, and Helbing (2002) A. Krawiecki, J. Hołyst, and D. Helbing, “Volatility clustering and scaling for financial time series due to attractor bubbling,” Phys. Rev. Lett. 89, 158701 (2002).
- Flunkert et al. (2009) V. Flunkert, O. D’Huys, J. Danckaert, I. Fischer, and E. Schöll, “Bubbling in delay-coupled lasers,” Phys. Rev. E 79, 065201 (2009).
- Krawiecki (2009) A. Krawiecki, “Microscopic spin model for the stock market with attractor bubbling on scale-free networks,” J. Econ. Interac. Coord. 4, 213–220 (2009).
- Bak (1999) P. Bak, How nature works: the science of self-organized criticality (Copernicus, New York, 1999).
- Bak, Tang, and Wiesenfeld (1987) P. Bak, C. Tang, and K. Wiesenfeld, “Self-organized criticality: An explanation of the noise,” Phys. Rev. Lett. 59, 381–384 (1987).
- White and Fornberg (1998) B. S. White and B. Fornberg, “On the chance of freak waves at sea,” J. of Fluid Mech. 355, 113–138 (1998).
- Solli et al. (2007) D. R. Solli, C. Ropers, P. Koonath, and B. Jalali, “Optical rogue waves,” Nature 450, 1054–1057 (2007).
- Bonatto et al. (2011) C. Bonatto, M. Feyereisen, S. Barland, et al., “Deterministic optical rogue waves,” Phys. Rev. Lett. 107, 053901 (2011).
- Estoup (1916) J.-B. Estoup, Gammes Sténographiques (Institut Sténographique de France, Paris, 1916).
- Willis and Yule (1922) J. Willis and G. U. Yule, “Some statistics of evolution and geographical distribution in plants and animals, and their significance,” Nature 109, 177–179 (1922).
- Mercadier et al. (2009) N. Mercadier, W. Guerin, M. Chevrollier, and R. Kaiser, “Lévy flights of photons in hot atomic vapours,” Nature Physics 5, 602–605 (2009).
- Newman (2005) M. E. Newman, “Power laws, pareto distributions and Zipf’s law,” Contemp. Phys. 46, 323–351 (2005).
- Sornette (1998) D. Sornette, “Multiplicative processes and power laws,” Phys. Rev. E 57, 4811 (1998).
- Gonçalves and Neto (2011) C. Gonçalves and L. Neto, “Electrical implementation of a complete synchronization dynamic system,” in Journal of Physics: Conference Series, Vol. 285, IOP (IOP Publishing, 2011) p. 012013.
- Lévy (1937) P. Lévy, Théorie de l’addition des variables aléatoires (Gauthier-Villars, Paris, 1937).
- Mandelbrot (1982) B. B. Mandelbrot, The Fractal Geometry of Nature (Freeman, New York, 1982).
- Shlesinger, Zaslavsky, and Klafter (1993) M. F. Shlesinger, G. M. Zaslavsky, and J. Klafter, “Strange kinetics,” Nature 363, 31–37 (1993).
- Strogatz (1994) S. Strogatz, Nonlinear Dynamics and Chaos (Perseus Books, Cambridge, Massachusetts, 1994).
- Note (1) In the L-1 norm the distance between two arbitrary points, and , is given by , instead of the square root of the sum of the squared differences, usual in the L-2 norm.
- Klaus, Yu, and Plenz (2011) A. Klaus, S. Yu, and D. Plenz, “Statistical analyses support power law distributions found in neuronal avalanches,” PLoS One 6, e19779 (2011).
- Christensen et al. (2002) K. Christensen, L. Danon, T. Scanlon, and P. Bak, “Unified scaling law for earthquakes,” Proc. Natl. Acad. Sci. 99, 2509–2513 (2002).