11email: M.Salaris@aljmu.ac.uk 22institutetext: Institute of Astronomy, University of Cambridge, Madingley Road, Cambridge, UK, CB3 0HA 33institutetext: Kapteyn Astronomical Institute, University of Groningen, Postbus 800, 9700 AV Groningen, The Netherlands 44institutetext: Dipartimento di Fisica e Astronomia, Universit degli Studi di Bologna, Viale Berti Pichat 6/2, I40127 Bologna, Italy 55institutetext: INAF Osservatorio Astronomico di Collurania, Via M. Maggini, I64100 , Teramo, Italy
The Horizontal Branch of the Sculptor Dwarf galaxy
We have performed the first detailed simulation of the horizontal branch of the Sculptor dwarf spheroidal galaxy by means of synthetic modelling techniques, taking consistently into account the star formation history and metallicity evolution as determined from the main sequence and red giant branch spectroscopic observations. The only free parameter in the whole analysis is the integrated mass loss of red giant branch stars. This is the first time that synthetic horizontal branch models, consistent with the complex star formation history of a galaxy, are calculated and matched to the observations. We find that the metallicity range covered by the star formation history, as constrained by observations, plus a simple mass loss law, enable us to cover both the full magnitude and colour range of HB stars. In addition the number count distribution along the observed horizontal branch, can be also reproduced, provided that the red giant branch mass loss is mildly metallicity dependent, with a very small dispersion at fixed metallicity. The magnitude, metallicity and period distribution of the RR Lyrae stars are also well reproduced. There is no excess of bright objects that require enhanced-He models. The lack of signatures of enhanced-He stars along the horizontal branch is consistent with the lack of the O-Na anticorrelation observed in Sculptor and other dwarf galaxies, and confirms the intrinsic difference between Local Group dwarf galaxies and globular cluster populations. We also compare the brightness of the observed red giant branch bump with the synthetic counterpart, and find a discrepancy – the theoretical bump being brighter – similar to what is observed in Galactic globular clusters.
Key Words.:
galaxies: dwarf – galaxies: evolution – galaxies: stellar content – Hertzsprung-Russell and C-M diagrams – stars: horizontal branch1 Introduction
The Horizontal Branch (HB) is a luminous feature seen in the Colour-Magnitude Diagrams (CMDs) of all galaxies and globular clusters, corresponding to the central He-burning phase of low mass stars. Its shape – in a given bandpass combination – varies significantly, with an obvious dependence upon the age and metallicity range of the stellar populations of the system. However, several detailed investigations of the HB morphology in globular clusters have since long demonstrated that age and metallicity alone do not allow a unique interpretation of the HB (see, e.g., Dotter et al. 2010, for a recent study, and references therein).
The most critical problem is that it is not possible to predict from first principles the mass loss during the Red Giant Branch (RGB) phase, which determines the location along the HB for a star with a fixed initial mass and chemical composition. Other factors, such as the initial helium abundance, also appear to play a crucial role in determining the form of the observed HB in Galactic globulars (see, e.g., Rood 1973; D’Antona et al. 2002; Dalessandro et al. 2011, and references therein). The role played by He appears to be related to the recently emerged new picture of the globular cluster origin and evolution, whereby each cluster hosts first generation (FG) stars with normal He (mass fraction roughly equal to the cosmological He abundance) and -enhanced metal mixtures, and second generation objects with C-N, O-Na (and sometimes Mg-Al) anticorrelations and enhanced He (see, e.g. Gratton et al. 2012, and references therein for a review).
So far both these critical parameters – RGB mass loss and initial He of individual stars – have proven hard to measure (see, i.e., Origlia et al. 2002; Villanova et al. 2009, 2012; Dalessandro et al. 2013, for some determinations on a small sample of globular clusters), and thus the HB is usually carefully avoided in the interpretation of either the age or the metallicity properties of a resolved stellar population.
This is particularly unfortunate for the study of the ancient (10 Gyr old) stellar populations in nearby galaxies. These populations are the fossil record of the early stages of galaxy evolution, and provide crucial information about the epoch of formation of cosmic structures. The standard age diagnostics for these stars are to be found at faint magnitudes in a CMD, compressed into the oldest main sequence (MS) turn off region. This region of the CMD, apart from being small (in terms of magnitude and colour extension) and thus very sensitive to photometric errors, may also contain overlapping younger populations. Also, the age-metallicity degeneracy, although much better behaved than on the RGB, may still create problems in determining a unique solution for the ages and metallicities of the ancient stars.
Stellar evolution suggests that, at least in principle, the detailed properties of stars older than 10 Gyr could be recovered by analyzing the much more luminous and extended HB, if only its morphology could be sorted out in terms useful for understanding the relation to the star formation history and metallicity evolution of the galaxy.
The purpose of this work is to see whether it is possible to accurately model the resolved HB of the Sculptor dwarf spheroidal galaxy taking into account its past star formation history (SFH – Here we denote with SFH the star formation rate as a function of age and metal content). Sculptor has an exceptionally detailed SFH determination – derived without considering the HB – obtained by combining CMD analysis with detailed spectroscopic metallicities along the RGB (de Boer et al. 2012). We also use the well measured RR Lyrae properties and the optical CMD of non variable objects, as constraints to determine the best synthetic HB populations that match the observed CMD, using BaSTI stellar models Pietrinferni et al. (2004, 2006). The only free parameter in our analysis is the total amount of mass lost along the RGB, given that age and metal abundance distributions are fixed by the SFH. To the best of our knowledge this is the first time that a complete and detailed modelling of the HB of a resolved galaxy has been performed; our investigation is therefore a first step to assess the potential of synthetic HB modelling to add further constraints on a galaxy SFH, an issue particularly important when studying galaxies so distant that only RGB and HB stars can be resolved.
Any mismatch between the observed and predicted magnitude distribution along the HB may be a signature of the presence of enhanced-He populations – the counterpart of second generation stars in Galactic globulars – not included in the SFH determinations. This will provide an important additional piece of information regarding the comparison of photometric and chemical properties of dwarf galaxies and globular clusters. To date, comparisons of chemical abundance patterns between Galactic globulars and dwarf galaxies reveal that these latter lack the abundance anticorrelations (e.g. O-Na) typical of second generation stars in individual globular clusters (see, i.e., Geisler et al. 2007), that are associated to varying degrees of He enhancement (see, i.e., Pasquini et al. 2011). By enhanced-He populations we mean stars born with initial He mass fractions (Y) larger than the cosmological He abundance Y=0.246 (see Coc et al. 2013, for a recent reevaluation). The BaSTI models employ initial Y values that scale with the metal mass fraction Z as dY/dZ1.4, derived by considering a cosmological Y0.245 and the initial solar Z and Y as derived from a calibration of the standard solar model (see, e.g. Pietrinferni et al. 2004). In the metallicity regime of Sculptor the resulting Y values are practically constant – ranging between 0.245 and 0.248 – and essentially equal to the cosmological He. It is important to notice that the determination of the SFH – see next section – employed the same dY/dZ scaling, hence approximately the cosmological He, across the whole Z range covered by the galaxy population.
The RGB mass loss law derived from the HB modelling – eventually a function of initial metallicity and/or age – will also provide baseline values to be compared with analogous determinations on globular clusters, and to be tested on the HB of other dwarf galaxies. As a byproduct of our investigation we will compare in the appendix the observed difference between RGB bump and HB magnitudes, with the theoretical prediction based on the galaxy SFH, and verify whether a discrepancy exists, as found in Galactic globulars (see, e.g., Di Cecco et al. 2010).
The paper is structured as follows. Section 2 describes briefly the data and the SFH used in this investigation, whilst the next two sections present our synthetic HB analysis and results, followed by our conclusions.
2 Data
The Sculptor dwarf galaxy is well known to contain a predominately old stellar population (see, e.g., Da Costa 1984), so the contamination of populations 10 Gyr old along the MS and overlapping the HB is minimal. Early work on the Sculptor HB by Majewski et al. (1999) was mainly qualitative and made use of simple ZAHB fitting, to assess the galaxy metallicity distribution. It was later confirmed that the red and blue HBs in Sculptor exhibit differences in spatial distribution that correspond to differences in ages and metallicities within the oldest population (Tolstoy et al. 2004; de Boer et al. 2011). These previous works simply highlighted that the HB is complex, and age and metallicity spreads play a role in creating the complexity.
A healthy HB extended in colour from the red to the blue indicates that a significant number of RR Lyrae variable stars must populate the instability strip, as is observed. The most complete survey to date comes from Kaluzny et al. (1995), where 226 RR Lyrae stars were identified and their light curves classified. Their properties are consistent with a spread in metallicities, and [Fe/H]. This was confirmed by Clementini et al. (2005) low resolution spectroscopy of 107 variables, which showed the metallicity to peak at [Fe/H], with a range covering [Fe/H] .
For the accurate modelling of the resolved HB of the Sculptor dwarf spheroidal, we make use of a deep optical B,V CMD presented in de Boer et al. (2011). In the V-(B-V) CMD the HB is the most horizontal, hence most sensitive to potential He variations. The observed HB extends to (B-V)0 in the blue, and even at these colours a change of Y (at fixed Z) affects both the luminosity of the zero age HB (ZAHB) and the luminosity of the end of the HB phase, thus enabling to test the presence of enhanced-He stars also along the bluest part of the galaxy HB.
The photometry was obtained using the CTIO 4-m MOSAIC II camera, and carefully calibrated using observations of Landolt standard fields (Landolt 2007, 1992). This resulted in an accurate photometric catalogue, covering a region ranging from the Sculptor centre out to an elliptical radius rell1 deg. The HB of Sculptor can be seen not have an extended blue tail in the optical, and the hottest is lower than the observed limit ( 12000 K) for the onset of radiative levitation.
The synthetic HB calculations also make use of the detailed SFH of Sculptor determined by de Boer et al. (2012). This SFH is obtained using the same optical photometry presented in de Boer et al. (2011), combined with detailed spectroscopic metallicities along the RGB, not using the observed HB stars. The distance modulus =19.72 and reddening E(B-V)=0.018 used in the SFH determination are also employed in the HB modelling. This SFH determination uses the DSEP stellar evolution models (Dotter et al. 2008) – that employ the same value as BaSTI for the cosmological He, and a very similar dY/dZ1.5, that produces essentially the same initial Y for Sculptor metallicity range – and there is good agreement between the Sculptor SFH determined with DSEP or BaSTI models, as also shown by (de Boer et al. 2012).
The SFH is provided for 5 annuli, extending from the centre out to a radius =1 deg. The region of interest for our simulation comprises the innermost two annuli, with 0.183 deg, that include the survey of RR Lyrae variable stars by Kaluzny et al. (1995). The adopted star formation rate within 0.183 deg is displayed in Figs. 2 and 13 of de Boer et al. (2012); it is provided in terms of solar masses per year in 1 Gyr age bins, between 5 and 14 Gyr. Broadly speaking, the star formation rate peaks in the oldest age bin, and then declines slowly with time; it reaches half the peak value between 9 and 10 Gyr ago, and decreases down to zero between 5 and 6 Gyr ago. The low star formation rate means that the age bins between 5 and 8 Gyr have a negligible impact on the resulting synthetic HB.
For each age bin the SFH is further subdivided into 8 [Fe/H] bins 0.2 dex wide, covering the range between [Fe/H]=2.5 and 0.9. The mean value of [Fe/H] increases slowly with the mean age of the population. A range of [/Fe] values (0.2 or 0.3 dex wide) is associated to each [Fe/H] bins (see Fig. 2 of de Boer et al. 2012). The values of [/Fe] decrease slowly with increasing [Fe/H] and are generally positive, but for the more metal rich bins, where [/Fe] also reaches negative values down to 0.2 dex for the higher [Fe/H] bin.
The properties of RR Lyrae stars are taken into account using Kaluzny et al. (1995) survey in the centre of Sculptor. The survey employed many short expsoure images covering a wide range in time to identify the RR Lyrae stars in the central region of Sculptor and determine the light curve profiles. Their sample can be considered complete in terms of photometric and temporal sampling of the variable objects on the HB. Intensity-weighted magnitudes are provided in the V band, averaged over the pulsation period of each pulsator. Furthermore, to prevent contamination of non-variable HB features by the presence of variable stars at random phase, we have identified and removed the confirmed RR Lyrae variable stars from de Boer et al. (2011) data – being taken at random phase, these objects were scattered to the blue, red and within the instability strip – based on spatial position. Due to the square field of view of the Kaluzny et al. (1995) fields, compared to the elliptical region considered here, the area covered by the SFH is 30% larger than the area for which RR Lyrae measurements are available. Therefore, we will apply a 30% reduction of the number of synthetic stars in the instability strip, in comparisons with the observed RR Lyrae populations, to account for the different size of the area covered by Kaluzny et al. (1995) observations. This also implies that there could be a relatively low number of undetected RR Lyrae variables taken at random phase (about 70 at most) scattered along and around the HB, that however do not affect appreciably the number distributions used for our analysis. As suggested by the referee, we have performed the full analysis described in the next sections also for the objects with 0.116 deg, e.g., within the innermost region of de Boer et al. (2012) SFH determinations. This reduces by a factor 2 the observed number of HB objects used in the analysis. In this case Kaluzny et al. (1995) field covers the whole region, implying that the RR Lyrae sample is essentially complete and also all variables can be removed from de Boer et al. (2011) photometry. The results we obtain are completely consistent with what found for the case of 0.183 deg, that will be detailed in the next sections.
3 Methods
We describe in this section the methods employed in our theoretical modelling of Sculptor HB.
3.1 Synthetic CMD generation
In a complex old stellar population, the morphology of the HB will depend on both the chosen RGB mass loss and the input SFH. For this reason we have completely rewritten the BaSTI synthetic CMD generator (SYNTHETIC MAN – Pietrinferni et al. 2004) to account for both a generic SFH and an arbitrary RGB total mass loss. The code now produces a full synthetic CMD that includes also – for old populations – a HB of arbitrary morphology.
Briefly, the code reads first the full grid of models – tracks from the MS to the tip of the RGB and HB tracks – from the BaSTI database for varying Z and a scaled solar metal distribution (Pietrinferni et al. 2004), and the SFH of the population – in our case the SFH by de Boer et al. (2012). For each age and [Fe/H] bin the synthetic CMD generator first draws randomly a stellar mass , within the range 0.1 and 120 (for consistency with de Boer et al. 2012), according to a Kroupa (2001) initial mass function. A value of the age and are then drawn randomly according to uniform probability distributions (in agreement with the derivation of the SFH by de Boer et al. 2012), within the ranges associated to the selected age and [Fe/H] bin. In addition, a value of is also drawn randomly (uniform probability distribution) within the range prescribed by the SFH for the selected age and [Fe/H] bin.
If the model corresponding to and the selected metal composition has a lifetime at the first thermal pulse or at carbon ignition – the relevant age range for Sculptor SFH is fully covered by the BaSTI models – shorter than , the star won’t appear in the synthetic CMD, and a new set of , , and is drawn. We remark that for a given and we consider scaled solar models with total metallicity , that closely mimic models with the same [M/H] and varying [/Fe] in the low mass, low metallicity regime covered by the stars currently evolving in this galaxy (Salaris et al. 1993).
If the lifetime of the model with mass is larger than , and is smaller than the model age at He-ignition, interpolation in age and Z amongst the BaSTI tracks will determine the CMD location of this synthetic star. If is larger than the lifetime at He-ignition, but smaller than the lifetime at the first thermal pulse, the code subtracts from a specified value of the total mass loss along the RGB , to provide a value for , e.g., the HB mass of the synthetic star with initial mass . Interpolations in mass, Z and age amongst the BaSTI HB tracks provide the CMD location of the synthetic star.
Finally, the synthetic magnitudes determined with the described procedures, are perturbed by a mean Gaussian photometric error to approximate the observational error of de Boer et al. (2011) data. For the magnitude range of the HB stars, the typical 1 photometric uncertainty of non-variable stars is 0.007 mag in B and V.
The values of are added, until the total mass of stars formed in each SFH bin satisfies the derived star formation rates. We have often arbitrarily multiplied the star formation rates in each bin by constant factors, to have a larger population of HB stars and minimize the Poisson noise in the simulations.
It is clear from this brief sketch of the synthetic CMD calculation, that the only free parameter entering our analysis is .
3.2 Modelling RR Lyrae stars
For the RR Lyrae stars observed by Kaluzny et al. (1995) only the mean V magnitudes of individual pulsators are available. Therefore, we had to employ theoretical determinations of the instability strip (IS) colour boundaries in our synthetic CMDs, together with the pulsational equation (Di Criscienzo et al. 2004b) that provides the fundamental period (P) of a synthetic object as a function of its mass, metallicity, bolometric luminosity and effective temperature. First overtone periods () are related to the fundamental ones by the relation P=+0.13 (Di Criscienzo et al. 2004b). The boundaries of the fundamental (F) and first overtone (FO) strips were taken from Di Criscienzo et al. (2004b), with small adjustments – within the quoted theoretical uncertainties – to account for the empirical constraints given by the period distribution determined by Kaluzny et al. (1995), that poses strong constraints on the width of the IS. As an example, if the theoretical red boundary is too red, the synthetic objects reach too long periods. We have therefore adjusted the boundaries of the F and FO regions in order to match as well as possible the period range covered by the observed F and FO pulsators. When using the standard IS boundaries provided by Di Criscienzo et al. (2004b) from calculations with mixing length ml=1.5, the synthetic objects reached too long periods. This constraint forced us to consider a larger value of ml in the pulsational results, and that shifts the red edge of the FF region to hotter temperatures, and lowers the upper boundary of the F periods. Thus we have employed the derivatives provided by Di Criscienzo et al. (2004b), to determine the IS edges at varying ml. However, an increased ml tends to move the blue edge of the FO region to the red, narrowing down too much the portion of the IS populated by FO pulsators. We therefore further adjusted the F and FO boundaries at fixed ml, within their nominal uncertainties of the order of 50-100 K (Marconi et al. 2003).
The final V magnitudes of the synthetic stars that lie within the IS will be compared to the RR Lyrae observations (their mean V magnitudes) by Kaluzny et al. (1995) paper. The photometric uncertainty on the V magnitude of the observed variables is greater then the photometric uncertainty of de Boer et al. (2011) data, due to the shorter exposure times employed by Kaluzny et al. (1995). In the comparison with the RR Lyrae V distribution, to match the observational conditions of these data, the V magnitudes of the synthetic stars that lie within the IS have been perturbed by a Gaussian photometric error with =0.05 mag, as determined from Fig. 1 of Kaluzny et al. (1995).
3.3 Comparing models and observations
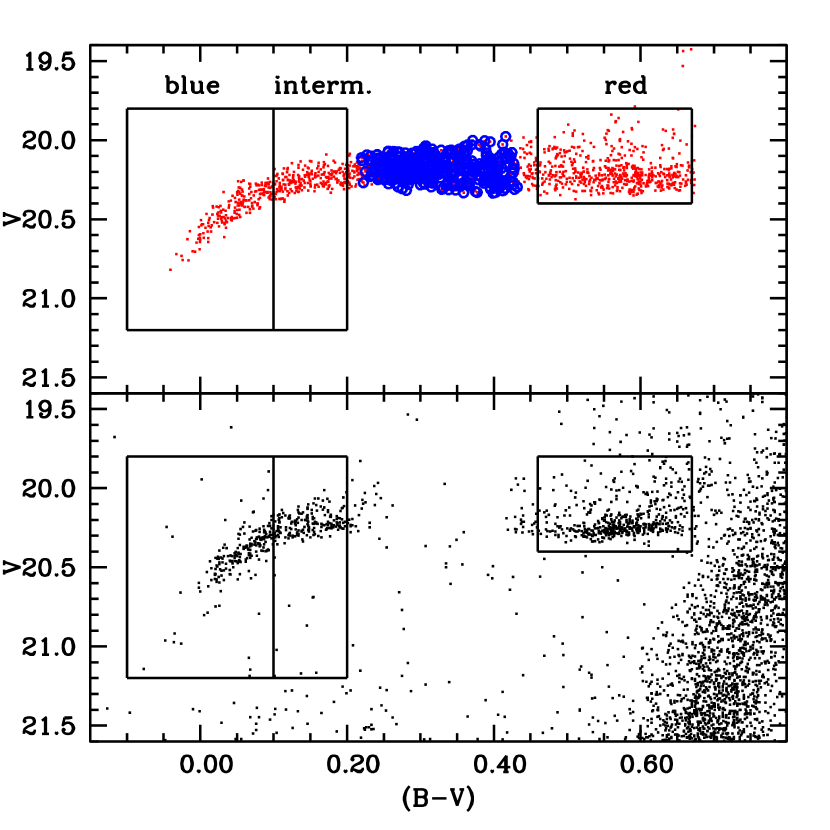
The bottom panel of Fig. 1 displays the observed HB, divided into three regions, delimited by rectangular boxes, that we denote as red, intermediate and blue. These boxes contain, respectively, 457, 194, and 401 stars. The bluer boundary of the red box and the red boundary of the intermediate box have been drawn at the approximate colours of the boundaries of the instability strips in Galactic globular cluster CMDs. The region between the red and intermediate box contains mainly RR Lyrae variables, but also a few non variable stars displayed in the CMD111In case of our simulations for the innermost region with 0.116 deg, that is fully covered by Kaluzny et al. (1995) RR Lyrae observations, we find also some stars in the CMD region between red and intermediate boxes. This strenghtens the case for the small number of objects with 0.183 deg lying in the same CMD region, to be mostly non-variable stars, rather then – another viable possibility – RR Lyrae objects taken at random phase and not covered by Kaluzny et al. (1995) field of view. We considered a synthetic HB model for a given choice to be satisfactory match to the observations when:
-
1.
the relative number of stars in the three boxes and within the region containing the RR Lyrae IS is reproduced within the Poisson uncertainty;
-
2.
the observed mean V-magnitude of the non variable stars in each of the three boxes is matched within 0.01 mag;
-
3.
the total (B-V) extension of the observed HB is well reproduced.
When these conditions were satisfied, we also checked that there was general agreement with the overall shapes of the histograms of observed star counts as a function of both V and (B-V) for the non variable stars, and with the mean level of the RR Lyrae brightness (averaged over a pulsational cycle).
Two points must be mentioned regarding these additional constraints.
First, we could in principle have enforced the constraint of perfect statistical agreement between the theoretical and observed star counts as a function of both V magnitude and colour for the non variable objects. However, a perfect fit depends on a precise knowledge of the functional dependence of (and eventually the initial Y) on one or more stellar parameters. Given the current lack of solid theoretical and empirical guidance, this dependence may be extremely complicated, discontinuous or involving additional physical processes not included in stellar models. We have therefore used simple parametrizations that, as we will see in the next section, produce synthetic CMDs that are able to satisfy our three main criteria listed above. In this way we put strong constraints on and Y.
Regarding the RR Lyrae mean magnitudes, they were determined from independent observational data. The calibrated V magnitudes have a maximum zero point systematic uncertainty of 0.03 mag, according to Kaluzny et al. (1995), whilst this uncertainty is much smaller for the non variable star photometry (de Boer et al. 2011). Given a possible small zero-point mismatch between the two photometries, we have simply checked that, when the main criteria were satisfied, the mean level of the synthetic RR Lyrae sample matched the observed one within the uncertainty on the relative zero-point of the two photometries. As a final, albeit weaker consistency check, we also compared the predicted and observed period distributions, and the predicted RR Lyrae [Fe/H] distribution, with the spectroscopic observations of Clementini et al. (2005).
4 Results
We have calculated several synthetic CMDs, each one with typically much larger numbers of stars than observed – by scaling appropriately the SFH – to minimize the Poisson error on the synthetic star counts. For each test we fixed , and checked the agreement between synthetic and observed HB morphology. As a zero order approximation, we tried with a standard Gaussian and mean value (and 1 spread) independent of [M/H] and age. This mass loss prescription did not match the observations, for any choices of the mean value and spread around the mean. Also the use of a uniform probability with varying mean values and spread, both independent of [M/H] and age did not help. The analysis of these failed attempts demonstrated that must be made dependent on [M/H], and also that only a small dispersion around these metallicity dependent mean values is consistent with the observations.

The simulations that matched the observed HB according to the criteria described in the previous section had a Gaussian distribution of with mean values:
-
1.
=0.10, for [M/H] 1.8
-
2.
=0.14 , for [M/H]1.6
-
3.
=0.14 - 0.15 , for [M/H]1.4
-
4.
=0.14 - 0.16 , for [M/H]1.3
-
5.
=0.16, for [M/H]1.3
and a very small dispersions, also metallicity independent, =0.005 . We determined taking into account the error bars on the best-fit star formation rates – as provided by de Boer et al. (2012) – hence the range of values for [M/H]1.3. In the other metallicity ranges the uncertainty on the star formation rates causes variations below 0.01. All discussions and figures that follow display results obtained from simulations with the best-fit value of the star formation rate.
In place of step functions for vs [M/H] we tried also linear or quadratic analytical expressions as a function of only [M/H] or both [M/H] and age, but the match to the observations got generally worse.
Although the Reimers law (Reimers 1975) – still widely employed to calculate RGB mass loss rates – predicts slightly increasing values of at increasing metallicity, when the free parameter that enters Reimers formula is kept fixed, the variations necessary to model Sculptor HB are larger. To this purpose, using the BaSTI models, we checked how our derived values can be transposed into values of the parameter . For [M/H] 1.8 is slightly higher than what predicted by =0.2 (that provides integrated RGB mass loss values between 0.06 and 0.07, depending on the age), whilst for [M/H]1.8 is close to what is predicted by =0.4.
With this mass loss calibration the mean V magnitudes in the red, intermediate and blue boxes are equal to, respectively, 20.20, 20.25 and 20.33, identical within 0.01 mag to the observed values. The mean brightness of the RR Lyrae IS is within 0.03 mag (the simulation being fainter) of the observed value, equal to 20.14 mag. The top panel of Fig. 1 displays one realization of the HB, without scaling the galaxy SFH. The total absolute number of HB objects and the absolute number counts (not just the relative ones) in the three boxes and the region of the IS turn out to be equal – within the Poisson errors on the star counts – to the observations (again, considering the scaling factor for the limited area of the observed RR Lyrae population). This is an extremely important independent check of the derived star formation rates.
Figure 2 displays [Fe/H] (more directly linked to observations than [M/H]) as a function of (B-V), for the HB stars in the simulation of Fig. 1. There is a general trend of decreasing [Fe/H] with decreasing colour, in agreement with the early analysis by Majewski et al. (1999) that made use of ZAHB fitting to the observed HB. However, the [Fe/H] dispersion at a given (B-V) is very large. If we split the synthetic sample into objects older than 10 Gyr and younger ones, we obtain for the old sample, and a much steeper dependence for the young objects, as is also clear from Fig. 2. The dispersion of [Fe/H] around these mean relationships is equal to 0.31 dex for the old sample, and 0.18 dex for the young one.
Figures 3 and 4 compare observed and synthetic star counts as a function of V and (B-V), respectively. Here we used simulations with a much larger number of objects than observed, and rescaled the star counts appropriately, to compare with observations.
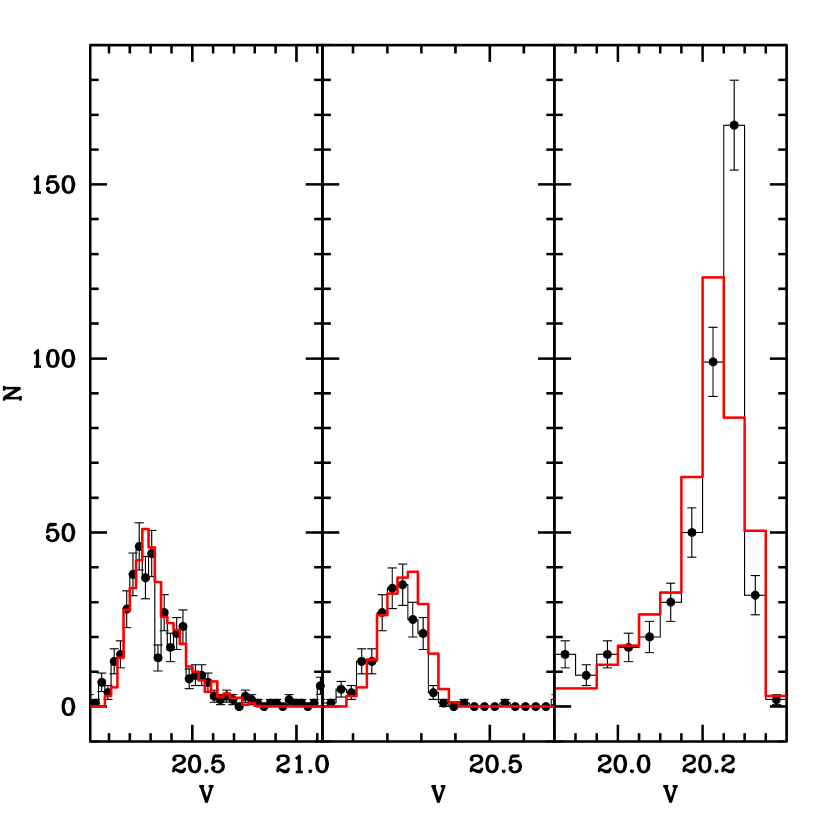
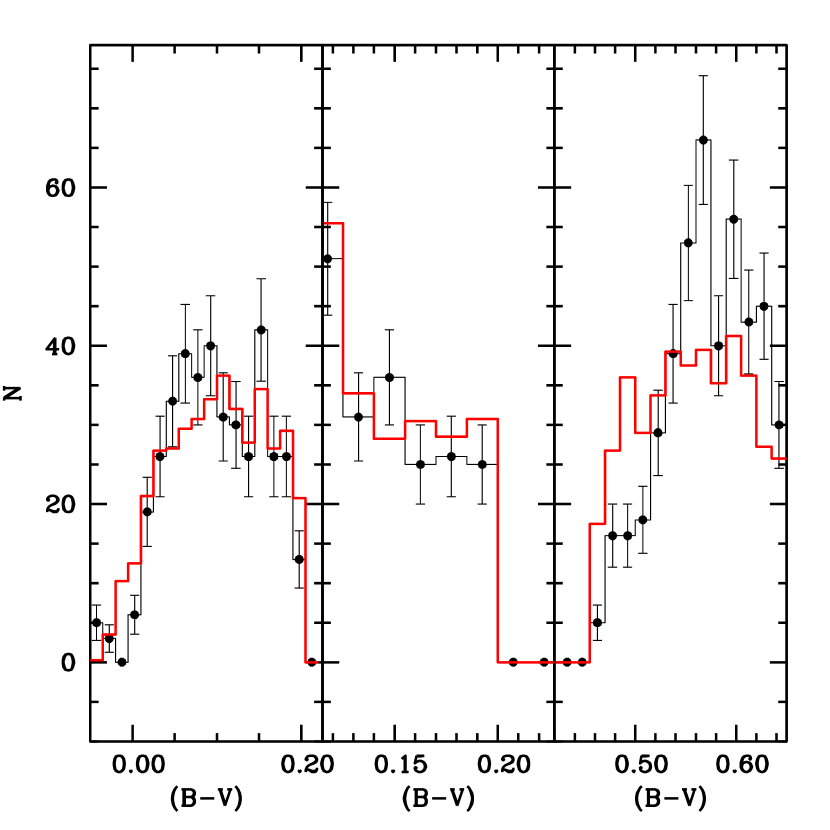
The overall shape of the theoretical histograms reproduces very closely the observed one. The comparison is worse for the star counts as a function of colour in the red box. It is remarkable that the magnitude distributions, very sensitive to the initial chemical composition, are well matched by the simulations, not just the mean values of V in the three boxes. There is no significant excess of stars brighter than what is predicted by the simulations, hence there is no clear evidence of He-rich stars.
We now consider comparisons with the RR Lyrae IS, for which not only mean V magnitudes, but also [Fe/H] estimates from Clementini et al. (2005) are available, to provide an additional consistency check of the HB simulations. These authors determined [Fe/H] for about half of the variables observed by Kaluzny et al. (1995), using a revised version of the method (Preston 1959), calibrated on both the Zinn & West (1984) and Carretta & Gratton (1997) (hereafter ZW and CG, respectively) globular cluster [Fe/H] scales. Typical errors on individual [Fe/H] estimates are equal to 0.15 dex.
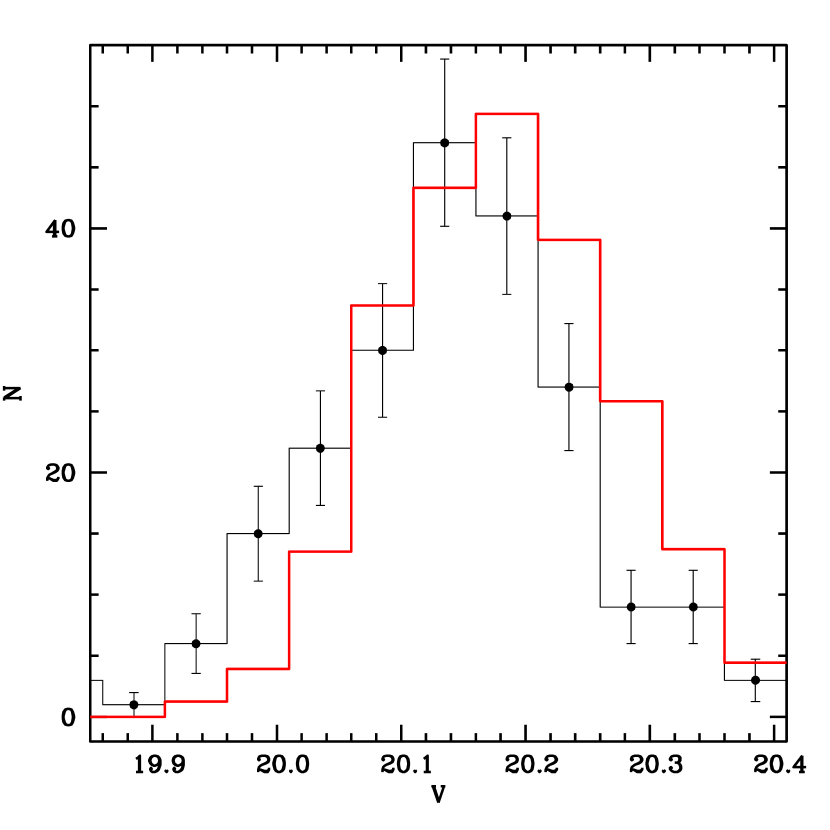
Figure 5 compares observed and synthetic RR Lyrae star counts as a function of V. The overall shapes of the histograms are very similar, with just a slight offset of the synthetic sample towards fainter magnitudes, as indicated by the mean brightness, fainter by 0.03 mag. This offset is equal to the estimated maximum zero point error on the calibration of the observations (Kaluzny et al. 1995).
Period (data from Kaluzny et al. 1995) and [Fe/H] distributions for the sample of variables are displayed in Fig. 6. The theoretical star counts have been rescaled to account for the smaller number of objects with [Fe/H] determinations, compared to the photometric sample of RR Lyare stars. The fit to the period distribution is not perfect even after tuning – within the constraints imposed by pulsational models – the boundaries of the IS to match as well as possible the range covered by the observations. Only an ad hoc tuning of the F and FO boundaries would provide a better match. As noticed by Di Criscienzo et al. (2004a), the IS boundaries would be probably better determined with a lower ml for FO pulsators compared, to F ones. This would certainly improve the fit of the P histogram, that displays a substantial discrepancy for the ratio of FO to F pulsators, such that it is too low in the simulation. In this respect one also has to consider that we could not take into account the objects that are in the so called OR zone of the IS, where stars pulsate FO or F depending on where they evolved from (FO or F region). This adds an additional uncertainty when trying to match precisely the observed period distribution.
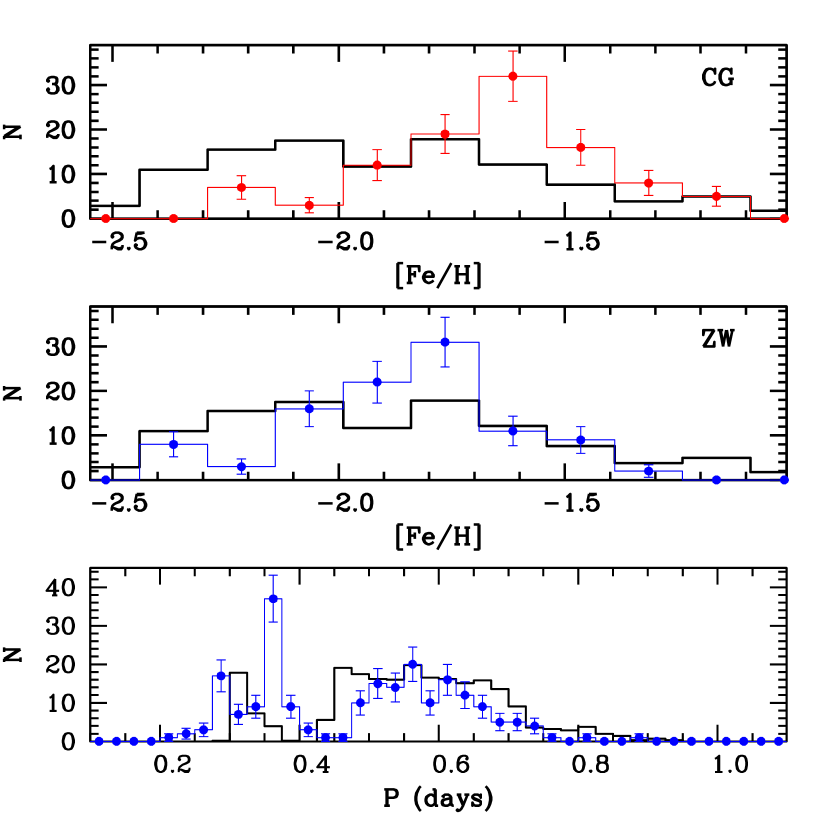
Regarding the metallicity distribution, we display the results for both the ZW and CG [Fe/H] scales. On the whole, the synthetic sample matches the observed values on the ZW scale fairly well. The average [Fe/H] of the synthetic sample is 1.88, very close to the observed one on the ZW scale, equal to 1.84. For comparison, the observed mean value on the CG scale is 1.65
All these results are based on CMD simulations of the central regions of the galaxy, covered by the RR Lyrae photometry. It is impossible to constrain completely the synthetic HB models without information about the variable star population within the IS. We can however check whether our mass loss calibration based on the inner regions, is able to match the mean magnitudes and observed number of HB stars in the blue, intermediate and red boxes of Fig. 1, when the whole observed area from the centre out to an elliptical radius 1 deg is considered222We cannot eliminate from the observed CMD the RR Lyrae stars taken at random phase, located at 0.183 deg, because we cannot identify them. To this purpose we calculated synthetic CMDs as described, considering the appropriate SFH for the whole observed area, using the same integrated RGB mass loss prescription of our best fit to the HB of the inner region. As a result, we can match within 0.01 mag the observed mean V magnitudes of stars in the three boxes, and the empirical star counts (within the associated Poisson error) in these three regions of the CMD.
5 Conclusions
We have performed the first detailed simulation of the HB of a resolved dwarf galaxy, taking consistently into account the SFH determined from MS and RGB photometric and spectroscopic observations, and using synthetic HB techniques usually applied to study the HB in globular clusters. The number of HB stars predicted by our simulations is consistent with observations, within the Poisson error on the star counts. The colour and V-magnitude distribution of all non-variable HB stars in Sculptor is matched well by the synthetic model, for simple choices of the integrated RGB mass loss. This latter needs to be metallicity dependent – with a stronger dependence than predicted by the Reimers law at fixed – to satisfy the observational constraints, and also must have a very small dispersion at fixed metallicity. The magnitude, metallicity (on the ZW scale) and period distribution of the RR Lyrae stars are also satisfactorily reproduced, when taking into account the current uncertainties on the IS boundaries.
There is no indication of enhanced-He subpopulations along the HB from the V-magnitude distribution of the non-variable and variable stars – within the uncertainty on the relative photometric zero-point. The metallicity range covered by the SFH, as constrained by spectroscopy of RGB stars, plus a simple RGB mass loss law, enable to cover both the full magnitude and colour range of HB stars. There is no excess of bright objects to be matched with enhanced-He populations. The agreement of the synthetic model with observations dictates that any enhancement of He – if present – has to be lower than Y=0.01. The good agreement of the synthetic sample with the [Fe/H] distribution of the RR Lyrae stars (on the ZW scale) lend additional support to the results of our simulations.
The lack of signatures of enhanced-He stars along the HB is consistent with the lack of the O-Na anticorrelation observed in Sculptor and other dwarf galaxies, and confirms the intrinsic difference between Local Group dwarf galaxies and globular cluster populations.
Regarding the RGB integrated mass loss , our simulations suggest a very simple prescription for the case of Sculptor, with slowly increasing with increasing [M/H]. We also find an extremely small spread around these mean values. It is natural to try and compare determined from our analysis, with similar estimates in globular clusters to assess whether, at least in case of FG stars, the RGB mass loss is approximately the same as in this galaxy. We compare here with the results by Dalessandro et al. (2011, 2013), who used synthetic HB models (using BaSTI models) to determine initial Y and mass distribution of HB stars in a few globular clusters. For NGC 2808, a cluster with [Fe/H]1.2 ([M/H]1.0, when considering a standard value [/Fe]=0.3-0.4), =0.15 for FG stars, that compares well with the value obtained for Sculptor at this metallicity. In case of M3 and M13, both with [Fe/H]1.6, the HB analysis provides =0.12 and 0.21, respectively. Whereas the value for M3 is reasonably close to what we derive for Sculptor at the appropriate metallicity (0.14), the result for M13 is obviously very discrepant. On the other hand, even when values are similar to Sculptor, the dispersion around these mean values is usually larger in the globular clusters. Before drawing any strong conclusions about the similarity (or lack) of the integrated RGB mass loss in globular cluster FG stars and dwarf galaxies, it is clearly necessary to extend analyses like ours and Dalessandro et al. (2011, 2013) to much larger samples of objects.
In summary, our results show that in case of Sculptor a simple mass loss law is able to explain the observed detailed HB morphology. The next obvious step is to verify whether synthetic HB models with the same mass loss law can reproduce the HB of other resolved dwarf galaxies, with well established and diverse SFHs. If this is the case, the combined analysis of the RGB (strongly affected by the initial metallicity) and the HB in distant galaxies where only these phases can be resolved, will be able to provide constraints on the age and metallicity distributions of their oldest populations.
Finally, as a byproduct of our simulations, we have been able to compare the observed magnitude of the RGB bump with theory. As detailed in the appendix, we find a discrepancy between observed and theoretical RGB bump, consistent with results for Galactic globulars, that point towards a too bright bump in stellar models, at least for intermediate metallicity and metal poor clusters. This is at odds with recent results by Monelli et al. (2010) for Sculptor, that were however based on older photometric data. We are able to explain the difference with our results for this galaxy, but the analysis of the RGB bump brightness in dwarf galaxies clearly deserves further detailed investigations.
Acknowledgements.
We thank the anonymous referee for several comments that improved the presentation of our results. MS wishes to dedicate this paper to the memory of his father, who sadly passed away a few months ago. He also thanks the Kapteyn Astronomical Institute for their hospitality and support of a visit, during which an important point of this analysis was clarified. SC is grateful for financial support from PRIN-INAF 2011 ”Multiple Populations in Globular Clusters: their role in the Galaxy assembly” (PI: E. Carretta), and from PRIN MIUR 2010-2011, project ‘The Chemical and Dynamical Evolution of the Milky Way and Local Group Galaxies’, prot. 2010LY5N2T (PI: F. Matteucci).Appendix A The RGB bump of Sculptor
The RGB bump is produced when the advancing H-burning shell encounters the H-abundance discontinuity left over by the outer convection at its maximum depth reached during the first dredge-up. The consequent sudden increase of the H-abundance in the shell alters the efficiency of the H-burning shell, and causes a temporary drop in the surface luminosity. After the shell has crossed the H-abundance discontinuity, the luminosity starts to increase again. As a consequence, a low-mass RGB star crosses the same luminosity interval three times, and a bump (a local maximum) appears in the star counts per magnitude bin (see, i.e., Iben 1968; Salaris & Cassisi 2005).
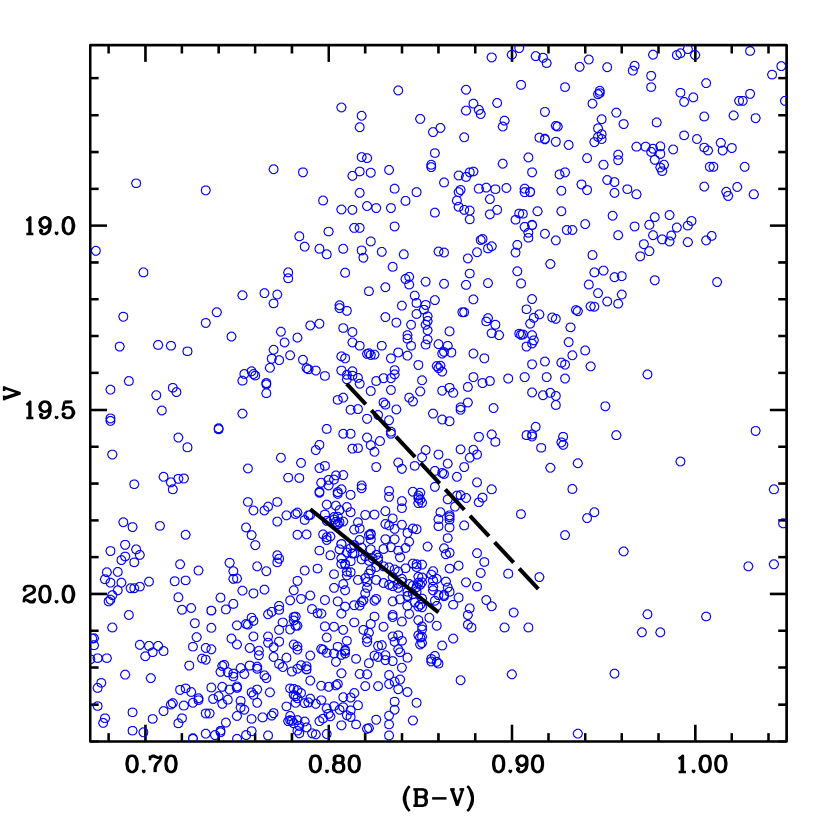
The analysis of the photometry by Majewski et al. (1999) disclosed the presence of two distinct RGB bumps; a bright blue bump at V19.3-19.4, and a faint red bump one at V20.0-20.1. Figure 7 displays our differential and cumulative RGB luminosity functions for Sculptor RGB and AGB stars, with 0.183 deg. The break in the slope of the cumulative luminosity function displayed by dashed lines, points to the location of the RGB bump (Fusi Pecci et al. 1990). This is strongly corroborated by the CMD of Fig. 8, that displays along the RGB a tilted strip with a strong concentration of stars, approximately centred around the magnitude of the break in the slope of the luminosity function. We thus find a single, very extended – in both V and (B-V) – and continuous bump region whose ridge line is marked in Fig. 8. The magnitude range agrees approximately with the brightness of the fainter bump claimed by Majewski et al. (1999). The bump gets fainter towards red colours as expected, given that more metal rich populations are redder along the RGB and have a fainter bump (at constant age). The spread of the bump over a large range of magnitudes makes the feature somewhat not well defined in the differential luminosity function.
We do not find any signature of an additional bump at V19.3-19.4, as it is quite clear by just examining the CMD, although we find a discontinuity in the slope of the cumulative luminosity function at V19.4 – approximately the magnitude of the bright bump claimed by Majewski et al. (1999) – that we are going to discuss later.
Figure 8 also displays the ridge line of the bump region from our simulations calculated with the galaxy SFH. There is a clear offset of 0.35 mag in V, where the theoretical is brighter. Notice that there is no freedom to shift the simulated CMD to fainter magnitudes, because it would destroy the agreement of the synthetic HB with observations. Using the simulated CMD as a guide, the colour range of the observed bump corresponds to [Fe/H] values ranging between 1.5 and 2.0. This disagreement is consistent with the discrepancy found in a sample of Galactic globular clusters, in approximately the same metallicity interval, by Di Cecco et al. (2010); Cassisi et al. (2011)333 Synthetic CMDs considering the appropriate SFH for the whole observed area within 1 deg, confirm that the theoretical RGB bump is systematically brighter than the observed one, and the position of both bumps is substantially the same as for the case of 0.183 deg.

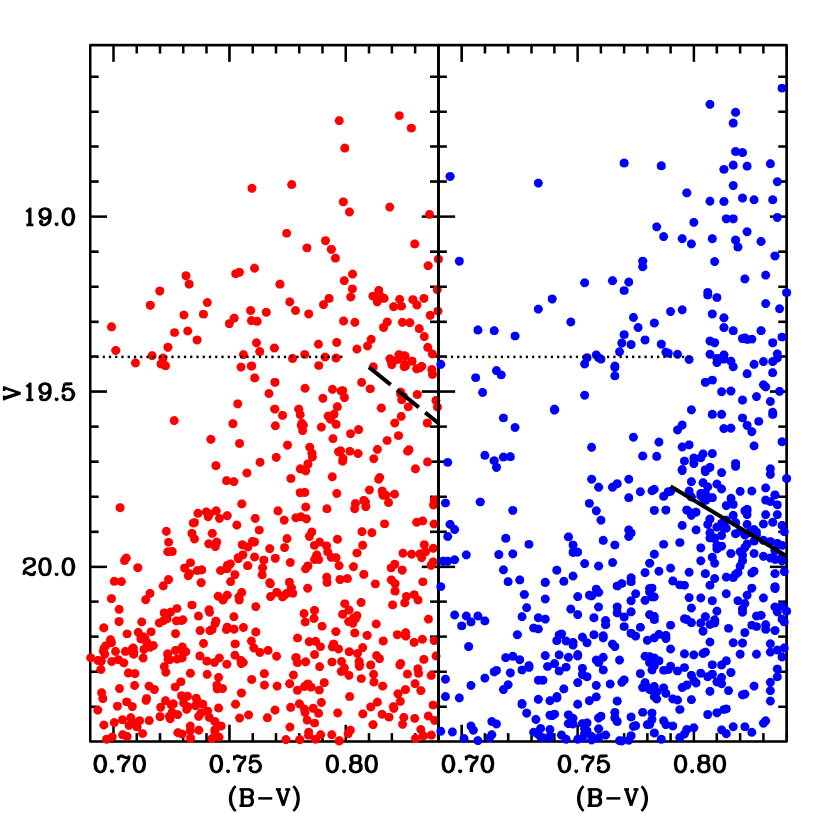
A previous analysis by Monelli et al. (2010) compared the difference between the V magnitude of the RGB bump and the HB at the level of the RR Lyrae instability strip (taken at the ZAHB) observed in Sculptor, with results from the BaSTI models. They used data from the literature that were available at that time, and considered two values of , associated to the two bumps found by Majewski et al. (1999). As mentioned before, we do not find any trace of the bright bump in our adopted photometry (and there is no double RGB bump in the synthetic CMDs either), and we speculate that this may correspond to the asymptotic giant branch (AGB) clump, that marks the first ignition of the He burning shell around the inert CO core. Essentially AGB stars begin to contribute more substantially to the population of red giants from the level of the clump, when the evolutionary speed tends to (relatively) slow down.
Figure 9 displays a synthetic CMD for the population with =0.183 deg – and approximately the same number of stars as observed – compared to the observations. The dotted horizontal line marks the magnitude of the discontinuity of the RGB+AGB cumulative luminosity function, brighter than the RGB bump, disclosed by Fig. 7. The AGB clump in the synthetic diagram appears in the region (B-V)0.70-0.75, on the blue side of the RGB, and V19.1-19.4. 444The clump appears slightly better defined, at the position predicted by the simulations, in the observed CMD of the whole region with 1 deg. The dotted line essentially marks the lower envelope of AGB clump stars and agrees with the magnitude of the brighter and bluer bump claimed by Majewski et al. (1999).
Let’s consider the case of the fainter bump, roughly consistent with the bump region found in our data, that gives =0.350.21 This was derived from Majewski et al. (1999) data, by considering the ZAHB level of the red HB – that agrees with our CMD – and the faint bump, and an average [M/H]1.300.15 from Kirby et al. (2009). With these values and associated error bars, the observed appears broadly consistent with theoretical models, for ages between 10 and 14 Gyr (see Fig.5 of Monelli et al. 2010). Our analysis suggests instead that the theoretical is smaller than observations (the theoretical bump is too bright with respect to the HB level, taken as reference).
The difference with our result may be traced back to a combination of factors. First of all, [Fe/H] for the stars that define the bump region, turns out to lie in the range . The [/Fe] values from the SFH, combined with these [Fe/H], give a range of [M/H] values lower than the [M/H]1.300.15 assumed by Monelli et al. (2010), and hence a brighter theoretical bump. In second instance, our HB simulations show that for the red HB (stars within the red box in our analysis) the ZAHB level, taken as lower envelope of the observed stellar distribution, is determined by the more metal rich population, at variance with the metallicity range that dominates the bump region. Both these factors go in the direction of reducing the theoretical to be used against the observed value, compared to the theoretical values in Monelli et al. (2010) study.
References
- Carretta & Gratton (1997) Carretta, E. & Gratton, R. G. 1997, A&AS, 121, 95
- Cassisi et al. (2011) Cassisi, S., Marín-Franch, A., Salaris, M., et al. 2011, A&A, 527, A59
- Clementini et al. (2005) Clementini, G., Ripepi, V., Bragaglia, A., et al. 2005, MNRAS, 363, 734
- Coc et al. (2013) Coc, A., Uzan, J.-P., & Vangioni, E. 2013, ArXiv e-prints
- Da Costa (1984) Da Costa, G. S. 1984, ApJ, 285, 483
- Dalessandro et al. (2011) Dalessandro, E., Salaris, M., Ferraro, F. R., et al. 2011, MNRAS, 410, 694
- Dalessandro et al. (2013) Dalessandro, E., Salaris, M., Ferraro, F. R., Mucciarelli, A., & Cassisi, S. 2013, MNRAS, 430, 459
- D’Antona et al. (2002) D’Antona, F., Caloi, V., Montalbán, J., Ventura, P., & Gratton, R. 2002, A&A, 395, 69
- de Boer et al. (2012) de Boer, T. J. L., Tolstoy, E., Hill, V., et al. 2012, A&A, 539, A103
- de Boer et al. (2011) de Boer, T. J. L., Tolstoy, E., Saha, A., et al. 2011, A&A, 528, A119
- Di Cecco et al. (2010) Di Cecco, A., Bono, G., Stetson, P. B., et al. 2010, ApJ, 712, 527
- Di Criscienzo et al. (2004a) Di Criscienzo, M., Marconi, M., & Caputo, F. 2004a, Mem. Soc. Astron. Italiana, 75, 190
- Di Criscienzo et al. (2004b) Di Criscienzo, M., Marconi, M., & Caputo, F. 2004b, ApJ, 612, 1092
- Dotter et al. (2008) Dotter, A., Chaboyer, B., Jevremović, D., et al. 2008, ApJS, 178, 89
- Dotter et al. (2010) Dotter, A., Sarajedini, A., Anderson, J., et al. 2010, ApJ, 708, 698
- Fusi Pecci et al. (1990) Fusi Pecci, F., Ferraro, F. R., Crocker, D. A., Rood, R. T., & Buonanno, R. 1990, A&A, 238, 95
- Geisler et al. (2007) Geisler, D., Wallerstein, G., Smith, V. V., & Casetti-Dinescu, D. I. 2007, PASP, 119, 939
- Gratton et al. (2012) Gratton, R. G., Carretta, E., & Bragaglia, A. 2012, A&A Rev., 20, 50
- Iben (1968) Iben, Jr., I. 1968, ApJ, 154, 581
- Kaluzny et al. (1995) Kaluzny, J., Kubiak, M., Szymanski, M., et al. 1995, A&AS, 112, 407
- Kirby et al. (2009) Kirby, E. N., Guhathakurta, P., Bolte, M., Sneden, C., & Geha, M. C. 2009, ApJ, 705, 328
- Kroupa (2001) Kroupa, P. 2001, MNRAS, 322, 231
- Landolt (1992) Landolt, A. U. 1992, AJ, 104, 340
- Landolt (2007) Landolt, A. U. 2007, AJ, 133, 2502
- Majewski et al. (1999) Majewski, S. R., Siegel, M. H., Patterson, R. J., & Rood, R. T. 1999, ApJ, 520, L33
- Marconi et al. (2003) Marconi, M., Caputo, F., Di Criscienzo, M., & Castellani, M. 2003, ApJ, 596, 299
- Monelli et al. (2010) Monelli, M., Cassisi, S., Bernard, E. J., et al. 2010, ApJ, 718, 707
- Origlia et al. (2002) Origlia, L., Ferraro, F. R., Fusi Pecci, F., & Rood, R. T. 2002, ApJ, 571, 458
- Pasquini et al. (2011) Pasquini, L., Mauas, P., Käufl, H. U., & Cacciari, C. 2011, A&A, 531, A35
- Pietrinferni et al. (2004) Pietrinferni, A., Cassisi, S., Salaris, M., & Castelli, F. 2004, ApJ, 612, 168
- Pietrinferni et al. (2006) Pietrinferni, A., Cassisi, S., Salaris, M., & Castelli, F. 2006, ApJ, 642, 797
- Preston (1959) Preston, G. W. 1959, ApJ, 130, 507
- Reimers (1975) Reimers, D. 1975, Memoires of the Societe Royale des Sciences de Liege, 8, 369
- Rood (1973) Rood, R. T. 1973, ApJ, 184, 815
- Salaris & Cassisi (2005) Salaris, M. & Cassisi, S. 2005, Evolution of Stars and Stellar Populations, Wiley
- Salaris et al. (1993) Salaris, M., Chieffi, A., & Straniero, O. 1993, ApJ, 414, 580
- Tolstoy et al. (2004) Tolstoy, E., Irwin, M. J., Helmi, A., et al. 2004, ApJ, 617, L119
- Villanova et al. (2012) Villanova, S., Geisler, D., Piotto, G., & Gratton, R. G. 2012, ApJ, 748, 62
- Villanova et al. (2009) Villanova, S., Piotto, G., & Gratton, R. G. 2009, A&A, 499, 755
- Zinn & West (1984) Zinn, R. & West, M. J. 1984, ApJS, 55, 45