THE CHEMICALLY-CONTROLLED SYNTHESIS OF DUST
IN TYPE II-P SUPERNOVAE
Abstract
We study the formation of molecules and dust clusters in the ejecta of solar metallicity, Type II-P supernovae using a chemical kinetic approach. We follow the evolution of molecules and small dust cluster masses from day 100 to day 1500 after explosion. We consider stellar progenitors with initial mass of 12, 15, 19 and 25 that explode as supernovae with stratified ejecta. The molecular precursors to dust grains comprise molecular chains, rings and small clusters of silica, silicates, metal oxides, sulphides and carbides, pure metals, and carbon, where the nucleation of silicate clusters is described by a two-step process of metal and oxygen addition. We study the impact of the 56Ni mass on the type and amount of synthesised dust.
We predict that large masses of molecules including CO, SiO, SiS, O2, and SO form in the ejecta. We show that the discrepancy between the small dust masses detected at infrared wavelengths some 500 days post-explosion and the larger amounts of dust recently detected with Herschel in supernova remnants can be explained by the non-equilibrium chemistry linked to the formation of molecules and dust clusters in the ejected material. Dust gradually builds up from small ( ) to large masses ( ) over a 5 yr period after explosion. Subsequent dust formation and/or growth is hampered by the shortage of chemical agents participating in the dust nucleation and the long time scale for accretion. The results highlight the dependence of the dust chemical composition and mass on the amount of 56Ni synthesised during the explosion. This dependence may partly explain the diversity of epochs at which dust forms in supernovae. More generally, our results indicate that type II-P supernovae are efficient but moderate dust makers with an upper limit on the mass of synthesised dust ranging from 0.03 to 0.09 . Other dust sources must then operate at high redshift to explain the large quantities of dust present in young galaxies in the early universe.
1 Introduction
Stars with an initial mass on the main sequence comprised between 8 and 30 usually end their life as Type II-P supernovae (hereafter SNe). Despite the huge amount of energy released by the explosion ( erg), and the harsh physical conditions that characterise the ejected stellar gas (hereafter referred as the ejecta), dust and molecules have been detected in many SNe a few hundred days after the explosive event. The first evidence for dust synthesis in a SN ejecta was brought with the explosion of SN1987A in the Large Magellanic Cloud more than twenty five years ago. The extensive observational coverage of the event at mid-infrared (IR) wavelengths allowed the detection of the fundamental and overtone transitions of a few molecules, specifically carbon monoxide, CO, and silicon monoxide, SiO, as early as 120 days post-explosion. The observations also highlighted the formation of dust grains after day 400 (Spyromilio et al., 1988; Lucy et al., 1989; Meikle et al., 1989; Moseley et al., 1989; Roche et al., 1991; Danziger et al., 1991; Wooden et al., 1993).
Since then, warm dust has been detected in several SNe (e.g. Elmhamdi et al., 2003a; Kotak et al., 2005, 2006, 2009; Sugerman et al., 2006; Inserra et al., 2011; Gallagher et al., 2012). An excess in the mid-IR, combined with a decrease of several magnitudes in the optical light curve, and blue-shifted emission lines are the usual indicators of the synthesis of dust in the ejecta. The fundamental band of SiO has been detected in a few SNe, e.g., SN2004et, and the gradual fading of the transition over time was ascribed to the depletion of SiO in the condensation process of dust grains in the ejecta 400 days post-outburst (Kotak et al., 2009). Most important are the small amounts of warm dust derived from modelling the mid-IR excess in SNe with masses that range from to . These values are usually derived assuming a homogenous ejecta and a mixture of silicates and carbon, the prevalent types of dust in galaxies, while other condensates such as metal sulphides and oxides may be present in SN ejecta (Cherchneff & Dwek, 2010). Larger dust masses arise from the assumption of a clumpy ejecta (Ercolano et al., 2007), but the final values always remain small between 200 and 600 days post-outburst. These results do not support the hypothesis that SNe are important dust contributors to galaxies locally and at high redshift. If SN explosions were to provide the large amounts of dust needed to reproduce the reddening of distant quasars and metal measurements in damped Ly systems (Pei et al., 1991; Pettini et al., 1994; Bertoldi et al., 2003), the dust yield per SN needs to be as high as 1 (Dwek et al., 2007). Such a high value is difficult to reconcile with the small masses of warm dust detected in the IR.
The latest data on SN remnants (SNRs) obtained with the submilimetre (submm) Herschel telescope have cast a new light on the dust released by SN events. A large mass of cold ejecta dust amounting to 0.08 has been derived in the 330 yr old SNR Cas A (Barlow et al., 2010; Sibthorpe et al., 2010). In the Crab Nebula, a 1050 yr old pulsar wind SNR, cool dust was recently detected in the filaments and the derived dust masses amount to 0.1 0.24 , depending on the type of dust assumed (Gomez et al., 2012). Finally, of cool, ejecta dust have been inferred from submm flux data in the young remnant SN1987A (Matsuura et al., 2011). These cold dust masses are large compared with those derived from IR observations, and imply that either dust grains continue to form in the SN remnant decades after their initial condensation at day 400, or the IR observations only probe the dust content of the ejecta at early time when the ejecta dust may still form at later epochs in the nebular phase. The first scenario is unlikely because high gas temperatures are required to overcome the activation energy barriers characterising the neutral processes involved in the nucleation of dust, and large densities are also necessary to ensure the efficiency of these reactions (Cherchneff, 2010). These two conditions are not met in the SNR gas.
In the present paper, we report on new physico-chemical models of the stratified ejecta of SNe with different progenitor masses and solar metallicity. We study the formation of molecules and small molecular clusters implicated in the nucleation phase of the synthesis of dust, and describe the different steps involved in dust nucleation following a chemical kinetic approach, following previous studies of the chemistry of primeval SNe (Cherchneff & Lilly, 2008; Cherchneff & Dwek, 2009, 2010). We include the new nucleation chemistry of small silicate clusters as described by Goumans & Bromley (2012). These clusters set an upper limit to the final dust mass formed since they represent a bottleneck to the condensation phase of dust. In §2, we describe the physical and chemical model of stratified ejecta. The results on elements, molecules and dust clusters are presented in §3, where we discuss the impact of the 56Ni mass and compare our results to existing studies. A discussion follows in §4.
2 THE PHYSICAL AND CHEMICAL MODEL
The helium core of a massive star exploding as a supernova is crossed by a blast wave that deposits energy in the gas. When encountering the progenitor envelope, this wave triggers a reverse shock at the base of the envelope that propagates inward and produces Rayleigh-Taylor instabilities and macroscopic mixing in the helium core. The mixing ceases after a few days (Joggerst et al., 2010) and the partial fragmentation of the helium core proceeds with time. Radioactive 56Ni decays into 56Co on a time scale of a few days. In turn, 56Co decays into 56Fe with a half-life of 113 days, creating a flux of photons that pervades the ejecta. The degradation of -rays to X-rays and ultraviolet (UV) photons occurs by Compton scattering and creates a population of fast Compton electrons in the ejecta. These fast electrons ionise the gas, and produce ions such as Ar+, Ne+, and He+, that are key species in the ejecta chemistry. The physical models of the stratified ejecta are presented in the next section, followed by a section on the chemistry.
2.1 Physical Model
Stratified ejecta are considered for massive stellar progenitors of masses 12, 15, 19, and 25 . This choice of progenitor masses is based on the availability of SN nucleosynthesis models in the literature, and corresponds to values derived from the estimate of 56Ni mass from the SN light curve. Most Type II-P SNe originate from the explosion of massive stars with typical masses of 12 15 . In the cases of SN1987A and Cas A, a progenitor of mass 19 has been inferred (Woosley, 1988; Krause et al., 2008). The most massive progenitor, 25 , is considered as a surrogate of the massive SNe characterising the explosion of Population II stars at high redshift (Tumlinson, 2006), whereas the 12 progenitor represents low-mass SNe, including some members of the faint SN subclass characterised by a low mass progenitor ( ), and a low mass of processed 56Ni. In these faint SNe, e.g., SN2011ht (Mauerhan et al., 2012), dust forms as early as 100 days after explosion.
The stratified ejecta is described by the mass zones of the progenitor core given by the explosion models, and we assume that the gas within each zone is fully-microscopically mixed. No gas leakage between different zones is assumed. The initial chemical composition of the ejecta in the form of the elemental mass yields are taken from Rauscher et al. (2002) for the 15, 19, and 25 progenitors, while that of the 12 progenitor is from Woosley & Heger (2007). The elemental mass yields for all progenitors are summarised in table 3.
Synthetic ejecta temperature and number density profiles were constructed based on the explosion model for a Type II-P supernova with a 17 progenitor provided by Nozawa et al. (2010). For the sake of simplicity, we choose this model for all SN progenitor studied, and the gas parameters are listed in table 4 for the 15 progenitor as a function of post-explosion time and ejecta zoning. The temperature variation as a function of post-explosion time is given by
| (1) |
where T is the gas temperature 100 days after explosion, is the mass coordinate, and is the time. In the explosion model of Nozawa et al. (2010), the gas temperature varies with the mass coordinate over the ejecta owing to differential deposition of energy in the helium core. We then assume different initial temperatures with mass zones at 100 days for all progenitor models; the initial T values are given in table 4.
Assuming homologous expansion, the gas density is given by
| (2) |
where and are the gas density 100 days post-outburst and the gas mean molecular weight at time in the mass zone of coordinate , respectively. According to the gas density profiles in Figure 2 of Nozawa et al. (2010), we assume a constant, initial gas density independent of mass coordinate for all progenitor masses, with g cm-3. All progenitor masses are characterised by an explosion energy of erg, while the effective -ray optical depth at 100 days has been estimated according to Cherchneff & Dwek (2009) and are 13.5, 17.5, 23, and 29 for the 12, 15, 19, and 20 progenitor, respectively.
2.2 Chemical Model
The various atoms, molecules, and ions assumed to form in the SN ejecta and considered in our chemical scheme are summarised in table 5. We model the chemistry in the ejecta considering all possible types of chemical reactions relevant to hot and dense environments. All chemical pathways that lead to the formation of linear molecules, carbon chains and rings, and small dust clusters include neutral-neutral processes such as termolecular, bimolecular, and radiative association reactions, and charge exchange reactions, whereas destruction is described by thermal fragmentation, neutral-neutral processes (i.e., oxidation reactions of carbon chains and all reverse processes of the formation reactions), ion-molecule recombination processes and charge exchange reactions.
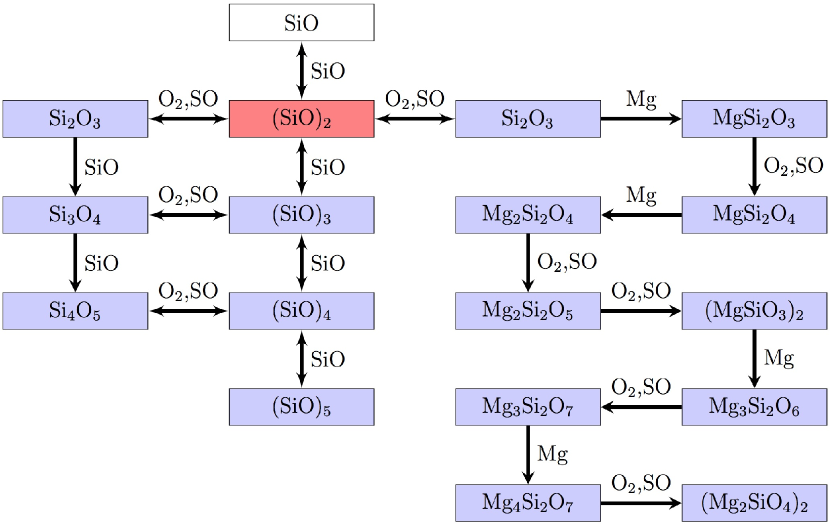
The nucleation scheme to silica and silicate clusters is illustrated in Figure 1 and the full chemical network describing the nucleation of silicate clusters is listed in table A1 in the Appendix. Small silica clusters form according to the processes described by Cherchneff & Dwek (2010), where the study of SiO dimerisation by Zachariah & Tsang (1993) was used. In the present study, we consider as ”silica”, the ensemble of (SiO)n clusters that form, as these small clusters will condense to form amorphous silica. A possible disproportionation into SiO2 and Si2 components in the condensed amorphous compound is to be expected (Reber et al., 2008), but we ignore a separation of these two phases in the present study. The description of the growth pathways of small silicate clusters, namely forsterite dimer (Mg2SiO4)2 and enstatite dimer (MgSiO3)2, is based on the work by Goumans & Bromley (2012). This study indicates possible chemical routes to the formation of the silicate dimers involving the formation of the SiO dimer (SiO)2 ring and its growth to Si2O3 through the reaction with O2 and SO. The subsequent pathway involves the addition of a Mg atom into the Si2O3 structure. The later growth of clusters is described by one oxygen-addition step followed by one Mg inclusion as a recurrent growth scenario. We consider different oxidising agents, including atomic O, O2 and SO, and find that reactions with O2 and SO are prevalent. Atomic oxygen is very abundant in the O-rich zones 1B and 2, but its inclusion in clusters proceeds through slow reactions such as termolecular (cluster + O + M [cluster+O] + M) and radiative association (cluster + O [cluster+O] + h) processes. Both processes have low reaction rates compared with the bimolecular reaction with O2 (typically 10-31 cm6 and 10-17 cm3 s) and the net formation rate is lower by a factor 104 and 10-100 for termolecular and radiative processes, respectively. According to Goumans & Bromley (2012), both oxygen and magnesium addition processes to grow silicate clusters are down-hill and no activation barrier is considered for the rates.
Ionisation of atoms in the ejecta occurs via collision with Compton electrons. The radioactive decay of 56Ni, to 56Co, and 56Fe creates -rays that degrade to X rays and UV photons through collision with thermal electrons, thus inducing the creation of a population of Compton electrons in the gas. These fast electrons ionise atoms and destroy chemical species in the ejecta. The time-dependent destruction rate by Compton electrons for species in s-1 is calculated using Eq. 4 of Cherchneff & Dwek (2009). The rate is re-scaled according to the amount of 56Ni produced by the explosion of the various progenitors, and following Cherchneff & Dwek (2009), the rate values are converted to a Arrhenius temperature-dependent form whose parameters are listed in table A2 in the Appendix. The interaction of the Compton electrons with molecules leads to their dissociation, ionisation and fragmentation into ionic products. The branching ratios for the different processes depend on , the mean energy per ion-pair for a given species. Available values of for molecules that form in the ejecta are listed in table A2. When data are not available, we simply assume values similar to those for O for elements and CO for molecules. The impact on molecules and dust clusters of the ultra violet (UV) radiation field resulting from the degradation of -rays was assessed by Cherchneff & Dwek (2009), who found that the destruction of molecules and dust precursors by this UV radiation field was not important compared with destruction by Compton electrons. We thus ignore UV radiation for the rest of the present study.
3 RESULTS
To better understand the chemical composition of several post-explosion ejecta reflecting the evolution and nucleosynthesis of massive stars, we model the formation of molecules and dust clusters in the ejecta of four SNe with progenitors of mass 12, 15, 19, and 25 . The mass of 56Ni is either 0.075 or 0.01 . The 15 progenitor with M(56Ni) is chosen as the ”standard case”, for which results on molecules and dust are presented in $ 3.1. The impact of varying the 56Ni mass is studied in $ 3.2. More massive progenitors are considered in $ 3.3, while results for a low-mass progenitor with a small 56Ni mass are given in $ 3.4. Finally, results on elements are shown in $ 3.5 and various dust formation models in SN are compared in $ 3.6.
3.1 15 Progenitor
We present the masses of molecules, dust clusters and elements as a function of time after explosion (in days) for the ”standard case”. The chemistry is followed from day 100 until day 1500, a time span that covers the initial formation of molecules at early times until the dust cluster synthesis is fully completed some 4 yr after outburst.
3.1.1 Molecules
We find that the zones of the He-core are efficient at forming large amounts of molecules. Because the ejecta is assumed to be hydrogen-free, the number of chemical species formed is limited; this poor chemistry typical of SN ejecta is well exemplified by the detection of only two molecules, CO and SiO, in several SNe (Danziger et al., 1988; Roche et al., 1991; Kotak et al., 2005), and CO in SN remnants (Rho et al., 2009, 2012).
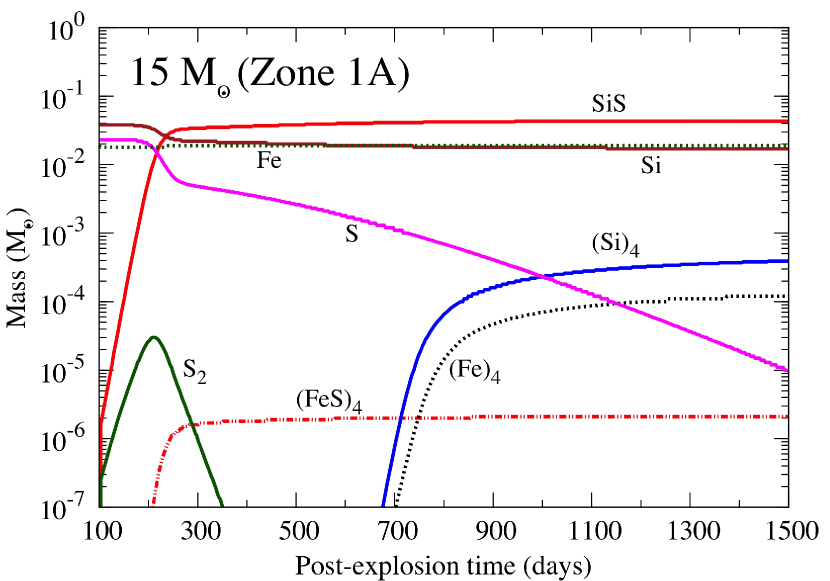
The innermost layer, zone 1A, is rich in iron, silicon and sulphur, where the iron results from the decay of 56Ni and 56Co. The oxygen content of the zone is very low and precludes the formation of O-bearing species, metal oxides and silicates. Zone 1A quickly converts most of the atomic sulphur and half of the atomic silicon mass into silicon sulphide, SiS, as illustrated in Figure 2. The SiS mass rapidly increases after days to reach 1500 days post-explosion. The main formation processes for SiS is the radiative association reaction
| (3) |
and the reaction
| (4) |
The latter process is not well characterised with no measured reaction rate, and was included based on a process involving the reaction of atomic C with disulphur, for which a rate has been estimated at 300K. Owing to the isovalence of carbon and silicon, a similar rate was adopted for Reaction 4. We tested the importance of Reaction 4 in the formation of SiS by removing it from the chemical network. SiS was then mainly formed by Reaction 3 with similar efficiency and masses. Therefore, we conclude that the innermost zone of the He-core overwhelmingly produces SiS due to the large S and Si content of the zone.
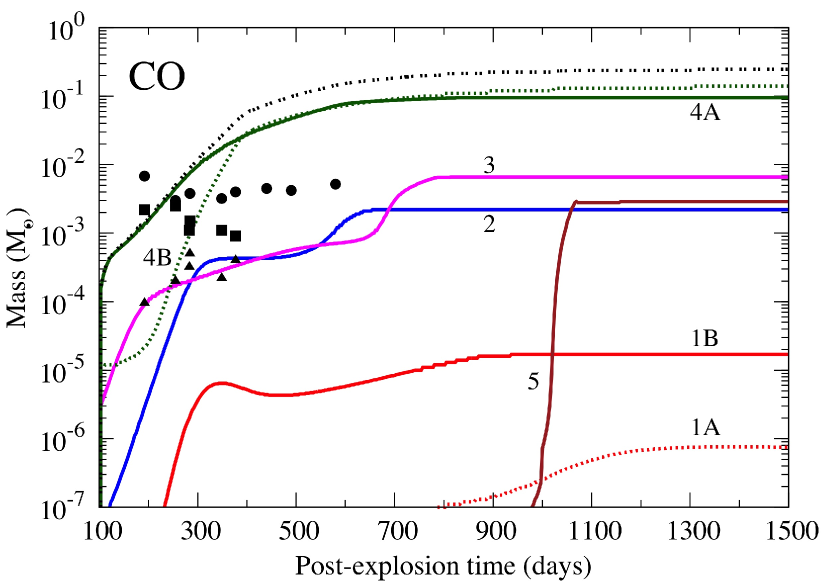
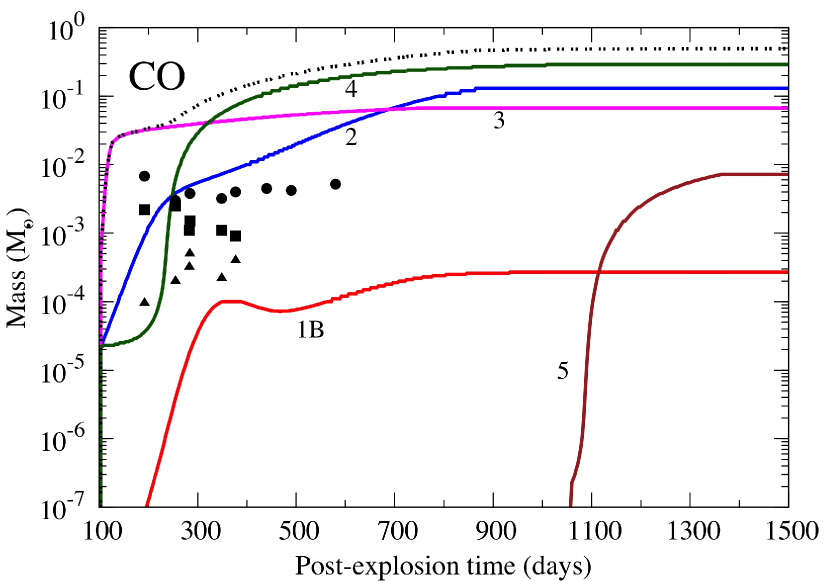
Carbon monoxide, CO, was the first molecule detected in SN1987A. The fundamental band at 4.65 m was observed between day 135 and day 260 (Danziger et al., 1988), while the CO first overtone transition at 2.29 m was detected at day 100 after the explosion (Spyromilio et al., 1988). CO was later been detected in several other SNe (Cherchneff & Sarangi, 2011). Once formed, CO can withstand harsh conditions in the ejecta because of its strong chemical bond. Depending on the C/O ratio characterising each zone, CO formation limits the amount of left over atomic oxygen or carbon in the gas-phase, and thus controls the chemistry of the gaseous and solid components of the gas. In the present case, most of the He-core zones have C/O ratios less than one, except for the outer mass zone, zone 5 (see table 3). The evolution of CO mass with post-explosion time for the He-core zones is shown in Figure 3. CO masses derived from available observational data for SN1987A are also plotted for early times. In zones 4A, 4B, 2 and 3, CO forms as early as 200 days and reaches masses ranging from to . The prevalent formation processes between 100 and 200 days are
| (5) |
and
| (6) |
The formation of C2 chains via radiative association reactions starts early on, but owing to the large atomic oxygen content, C2 is quickly converted to CO following Reaction 5. The formation of CO via oxidation of carbon chains prevails at early times, while Reaction 6 contributes to the growth of CO mass after day 300. The final CO mass summed over all zones at day 1500 is , much larger than the masses derived from IR data before day 600 in SN1987A (Liu & Dalgarno, 1995). These large amounts of CO primarily form in zones 4A and 4B, and do not trace efficient carbon dust formation in these two zones. These zones indeed form little or no carbon dust because carbon chains are quickly destroyed by oxidation reactions similar to Reaction 5 to form CO, thus impeding their growth into larger carbon clusters.
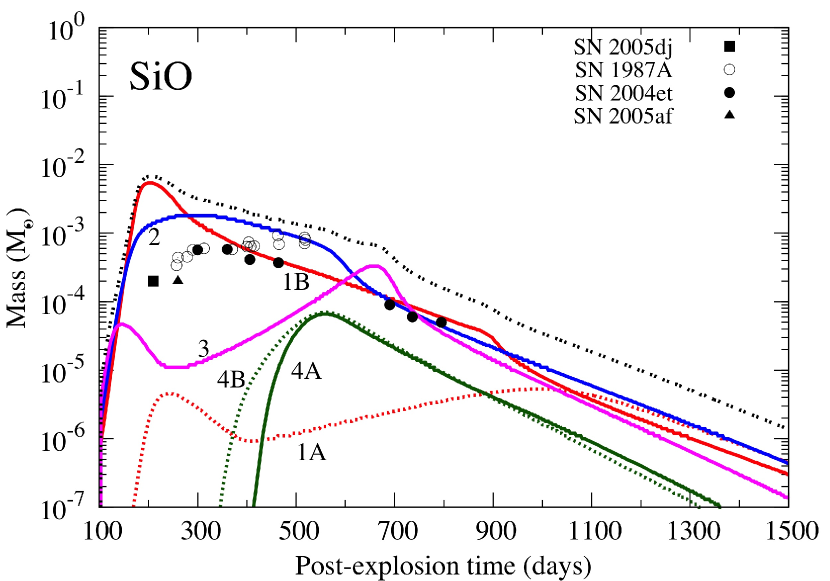
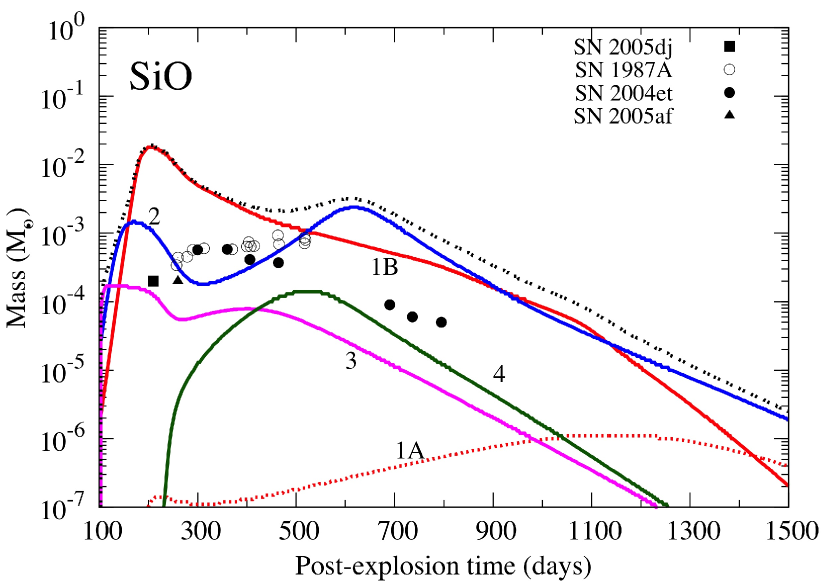
The oxygen-rich component of the He-core includes zones 1B, 2, 3, 4A, and 4B, extending from 1.88 to 3.04 (see table 3). Oxygen-bearing molecules are expected to form there but the zones are rich in inert gas, namely Ar (Zone 1B) and Ne (Zones 2 and 3). Ar and Ne atoms are ionised by Compton electrons, and the ions (Ar+ and Ne+) are destroyed by both the recombination to their inert parents and the shrinkage in Compton electrons with time owing to the decreasing mass of 56Ni. Ar+ and Ne+are detrimental to the formation and survival of molecules in these zones as they quickly destroy molecules. The mass of silicon oxide, SiO, formed in the various zones as a function of post-explosion time is shown in Figure 4. Superimposed are the SiO masses derived from IR observational data for several SNe. The mass follows a rapid increase at day 200 in zones 1B, 2, and 3, while the formation of SiO is delayed to 400 days in zones 4A and 4B. The prevalent formation process for SiO in zones 1B, 2, and 3 are the reactions
| (7) |
| (8) |
and
| (9) |
The prevalent destruction processes are
| (10) |
for zone 1B,
| (11) |
for zones 2 and 3, and
| (12) |
for both zones. Upon formation, SiO is destroyed by Ar+ and Ne+ following Reactions 10 and 11. The SiO mass for all zones shows a gradual and strong decrease, going from at 200 days to at 1500 days. Such a decline is also shown by the SiO masses derived from observations, for example, in SN2004et (Kotak et al., 2009). In this object, the SiO transition was detected at various periods and showed a gradual fading with time that is coupled to the evidence for dust synthesis in the ejecta. The destruction of SiO before 400 days results from thermal fragmentation and the destruction by Ar+ and Ne+ ions. At later times, SiO is depleted into silica and silicate clusters, as we will see in the next section, and acts as a direct dust synthesis tracer in the ejecta.
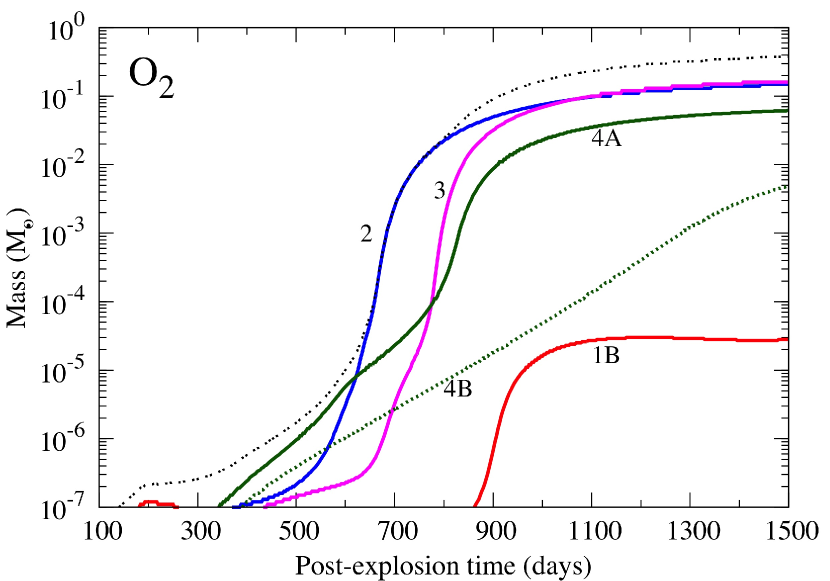
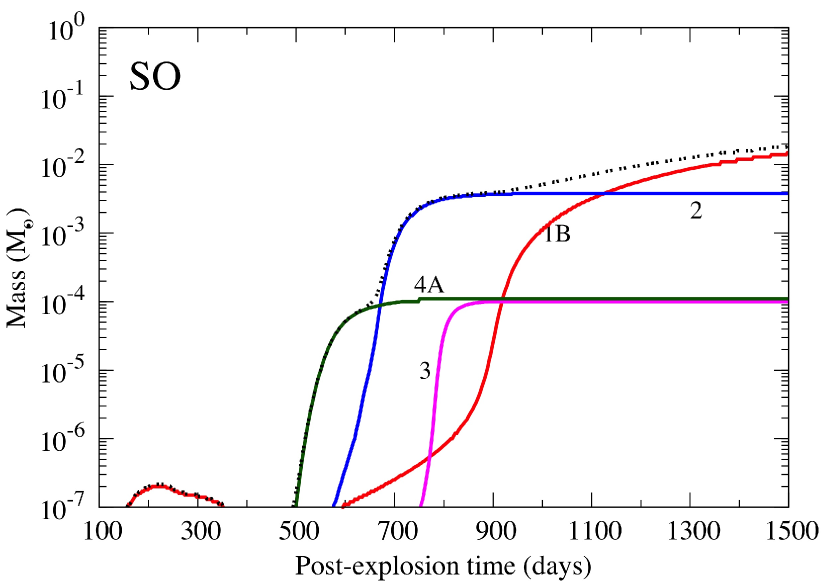
Apart from SiO, the formation of dioxygen, O2, and monosulphide, SO, prevails in the O-rich zones of the ejecta, as illustrated in Figure 5. Most of O2 and SO molecules form in both zones 2, 3, and 4A. Their mass variation shows a similar trend with time, ranging from negligible masses before day 600 and reaching high mass values after day 600. Dioxygen efficiently forms at early time from the radiative association reaction
| (13) |
but is quickly depleted in the formation of SiO, and, to a minor extent CO, following Reaction 8 and the reaction
| (14) |
At later times, the formation of AlO also contributes to the destruction of O2 via the reaction
| (15) |
while the reverse of Reaction 15 contributes to the reformation of O2. The gradual depletion of SiO in silicate clusters allows the O2 mass to grow after day 600 to reach the large value of at day 1500. The SO mass follows a trend similar to that of O2 because the SO formation is directly coupled to the formation of O2 by the reaction
| (16) |
and the SO destruction follows the reverse of Reaction 16. The final SO mass is large and amounts to at day 1500.
We see that all chemistries responsible for the production of molecules are entangled, and the final molecular component of the He-core includes five molecules, namely CO, O2, SiS, SO, and SiO. Aluminium oxide, AlO, is not included in the molecular component because it will quickly be depleted in (AlO)2 and alumina dust clusters (see §3.1.2). We consider AlO as a ”dust cluster” rather than a gas-phase molecule). The first four molecules form in the ejecta, participate in the ejecta chemistry prior to day 1500, and are ejected with large masses to later stages of the SN evolution, e.g., in the SN remnant phase. The SiO molecule, on the other hand, forms efficiently but is quickly depleted into the production of dust clusters after day 300, and as such, enters the SN remnant phase with a much smaller mass than the other species. The total mass of the molecular component of the SN ejecta is high, and summarised as a function of zoning in table 6. The final ejecta mass fraction residing in molecules at day 1500 amounts to % of the ejected mass for the 15 progenitor.
3.1.2 Dust
As discussed in §2.2, the description of the dust synthesis is based on the formation of large molecular clusters entering the nucleation phase of the dust grains. The nucleation phase involves the chemical kinetic description of the formation of these clusters from the gas phase. For silicates, our larger clusters are dimers of forsterite (Mg4Si2O8), while for carbon dust (possibly solid C60), we model the formation of the first carbon ring C10. As for alumina, we are currently working on a chemical scheme to model alumina cluster formation based on cluster structures and the calculation of chemical rates but it is too premature to include such a scheme in our model. The most stable structure of Al2O3 is kite-shape (Archibong & St.-Amant, 1999), and the formation of molecular Al2O3 probably involves the dimerisation of AlO and the possible addition of one oxygen atoms via a bimolecular reaction with a O-bearing species. We can then safely assume that AlO molecules are precursors to alumina via the formation of (AlO)2 and that the AlO mass indicates an upper limit on the Al2O3 mass that can form in the ejecta. The condensation phase involves the coalescence of these clusters with each other, combined with surface growth if gas-phase growing agents are available. The condensation phase is not considered in the present study and the calculated masses of clusters thus represent an upper limit on the total mass of dust.
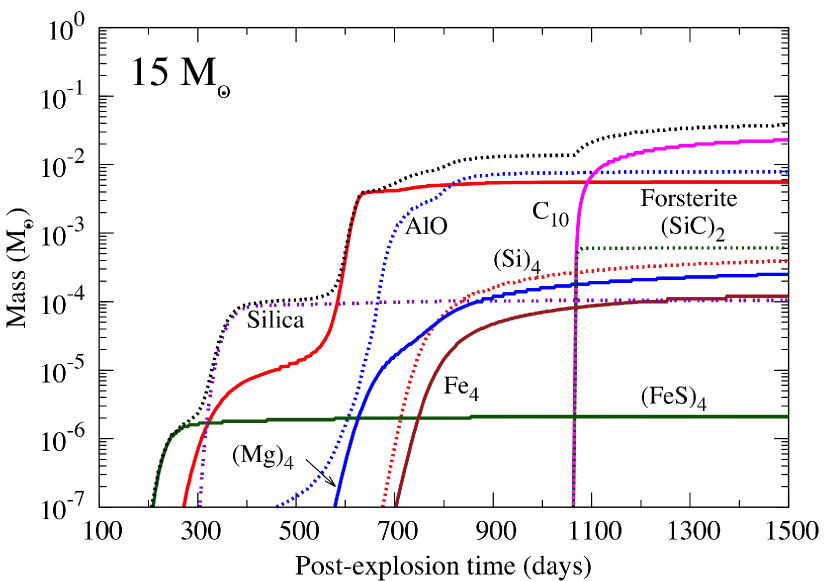
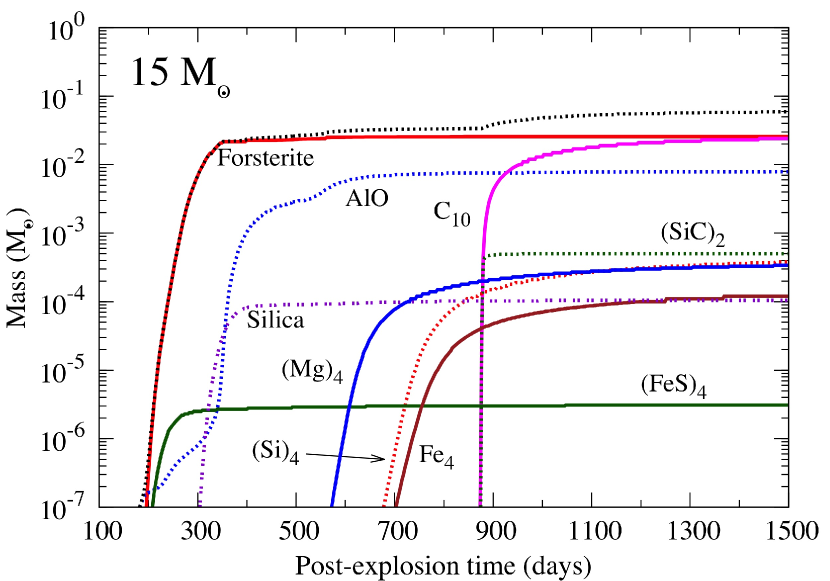
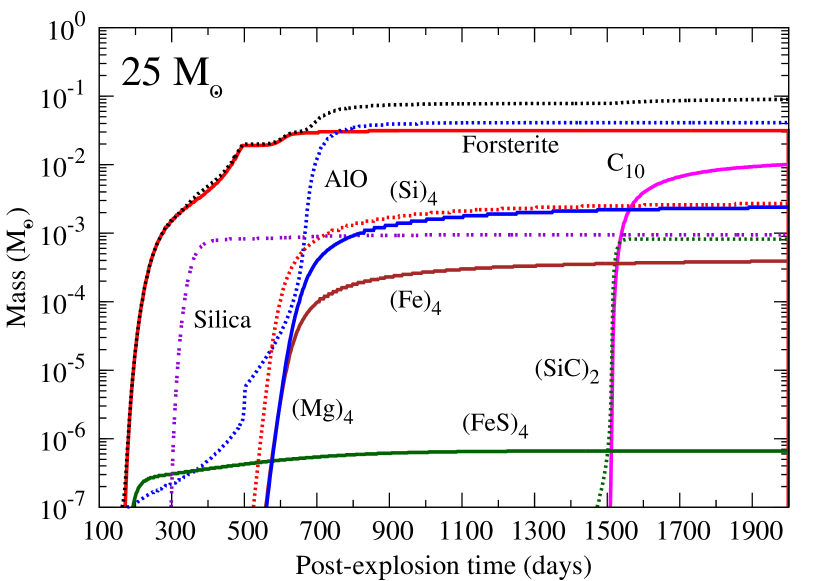
The modelled masses of dust clusters over all zones are illustrated in Figure 6 for the standard case. As discussed above, the condensation phase is not modelled and the cluster mass curves then flatten to their upper limit values once nucleation has taken place. As seen in Figure 6, there exist various events of cluster formation in the ejecta according to the chemical type of the dust and the zones in which the clusters form. The FeS clusters are first to form at day 250 in the innermost zone, zone 1A, followed by silica and forsterite clusters in zones 1B and 2 at day 350. Aluminium monoxide AlO forms after day 600 in zones 2 and 3. Most pure metal clusters form after day 700 and include Mg and Si in zones 2 and 3, and iron in zone 1A. Finally carbon and silicon carbide clusters are synthesised in the outermost zone, zone 5, at late times ( 1050 days).
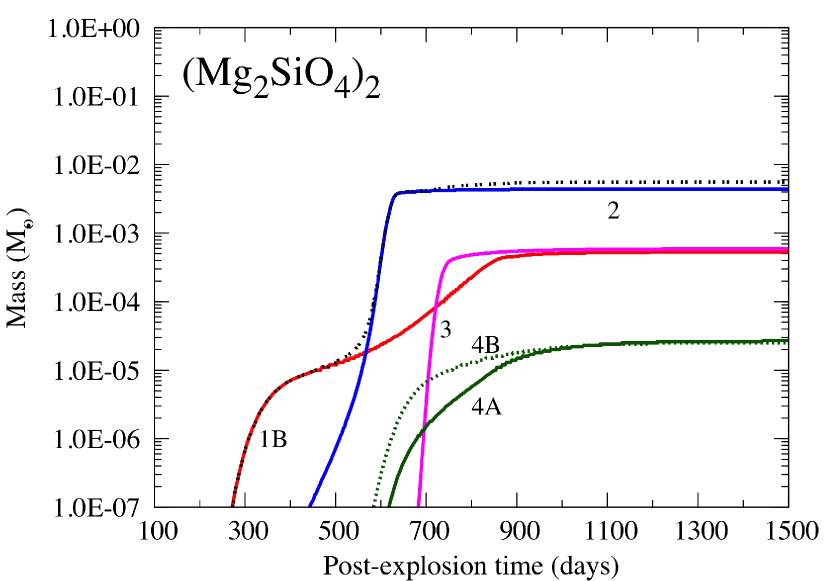
The timing of dust production highly depends on the local chemistry characterising the zones, as exemplified by the formation of silicates and carbon clusters. The forsterite dimer mass curve obtained for the various zones of the ejecta is shown in Figure 7. Forsterite first nucleates as early as 300 days in zone 1B, and gradually grows to reach its maximum value at 900 days in this zone. These two nucleation phases are seen as two depletion events in the SiO mass curve for zone 1B (see Figure 4), and correspond to the formation of the O2 molecule at 300 days and 900 days in zone 1B (see Figure 5). The subsequent oxygen addition to silicate intermediates grows forsterite dimers. In zone 2, forsterite forms at 600 days from the depletion of SiO (see the drop in Figure 4 for zone 2) and the net formation of O2 molecules that permits the final growth to forsterite dimers. The formation of forsterite dimers is less effective in the other three zones of the ejecta and occurs at late epochs. Therefore, the gradual growth of the forsterite total mass as shown in Figure 6 results from the chemistry of SiO formation and the growth of silicate clusters following the two-step mechanism of oxygen and magnesium addition proposed by Goumans & Bromley (2012).
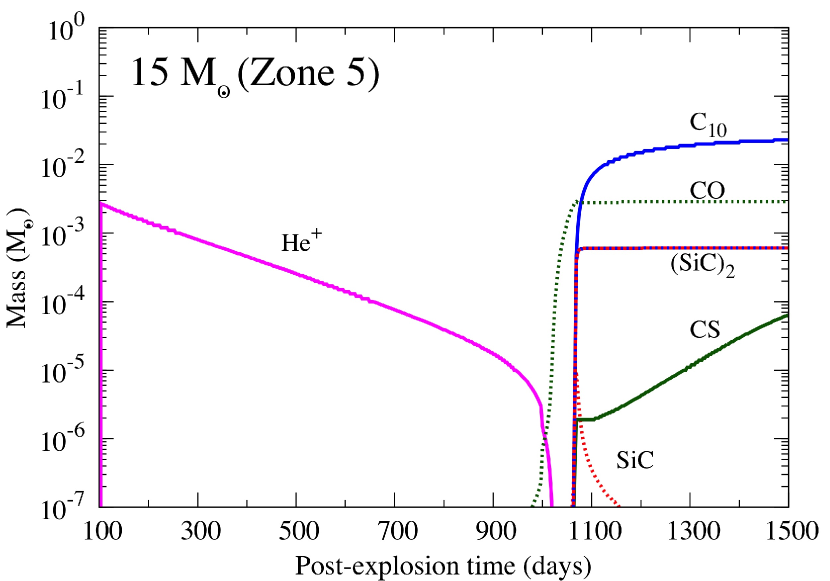
The scenario for the growth of carbon small clusters is quite different. First of all, our results highlight the fact that carbon chains grow in significant amounts in the only carbon-rich zone of the ejecta, zone 5. Where oxygen overcomes carbon, e.g., in zone 4A and 4B, any carbon chain is destroyed by O attack to form CO. Zone 5 is helium-rich and He atoms are ionised by Compton electrons. The produced ions are destroyed by recombination to He and by the decrease of Compton electrons with time. He+ is detrimental to the formation and survival of molecules in zone 5 (Lepp et al., 1990; Cherchneff & Dwek, 2009, 2010) as the ion quickly destroys molecules following reactions such as
| (17) |
Once the He+ ion mass becomes negligible after day 1000, molecules like CO, SiC, C2 and CS quickly form. The growth of carbon chains is then efficient via radiative association reactions of the type
| (18) |
As the zone is C-rich, the low oxygen content hampers the destruction of carbon chains via reaction such as Reaction 14, which grow until the closure of the first ring, C10. The formation of carbon clusters therefore strongly depends on the He+ content of the outer zone and the time at which the He+ abundance significantly decreases. Because of the very large initial He mass, the vanishing of He+ in the zone is delayed to day 1050, resulting in a late formation of carbon and silicon carbide clusters. This late synthesis contributes to the time-sequence of dust cluster production observed in Figure 6.
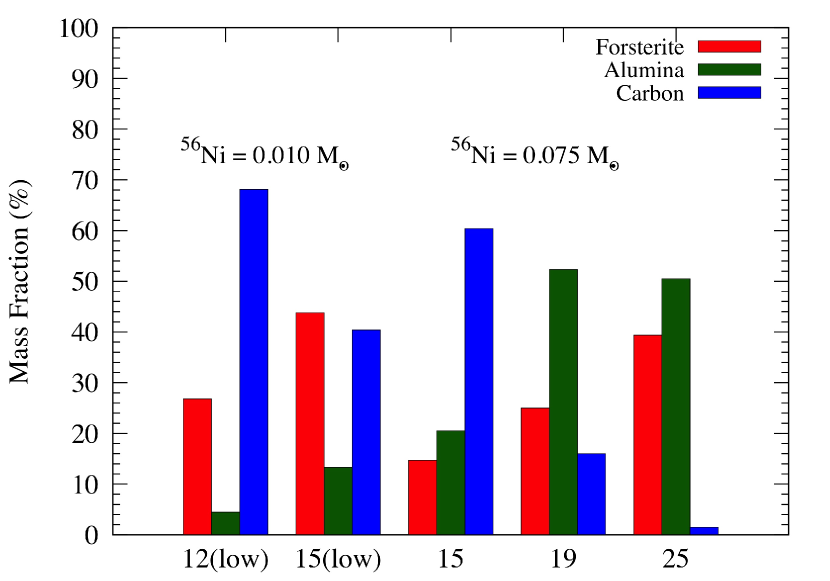
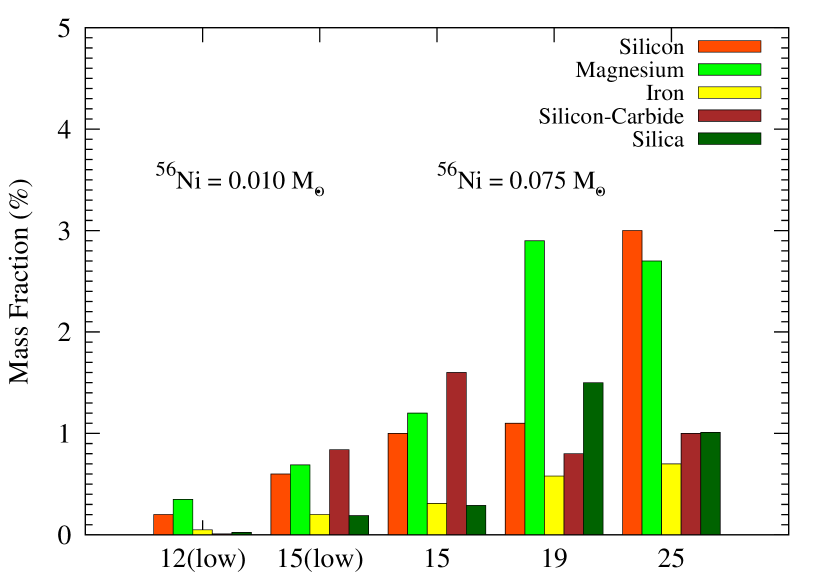
The gradual increase with time in cluster masses results in upper limits on dust mass ranging from 10-5 at 300 days to more than 4 yr after explosion. This range of dust masses perfectly agrees with the values derived from observational data. At early times ( days), the mass derived from IR observations in several Type II-P SNe are small with typical values between and . These values correspond to our modelled cluster masses shown in Figure 6 for this time span. However, much larger dust masses are derived in SN remnants from submm data. In Cas A, of dust is inferred from the Herschel data (Barlow et al., 2010). In SN1987A, between 0.4 and 0.7 of dust is inferred to reproduce the Herschel fluxes (Matsuura et al., 2011), while of dust is found in the filamentary structures of the Crab Nebula by Gomez et al. (2012) with Herschel. These masses obviously result from fitting the spectral energy distribution of the objects at IR and submm wavelengths, implying that an initial dust composition is assumed. In the case of Cas A and the Crab Nebula, two types of dust are considered separately, namely amorphous carbon (AC) and silicates, while for SN1987A, large iron spheres are also included to obtain a satisfactory fit of the flux data. Notwithstanding the presence of cool dust in SNRs in amounts larger than what is observed at early times in SN ejecta at IR wavelengths, the derived dust masses and chemical compositions are somewhat uncertain, and strongly depend on the physical and chemical parameters used in SN ejecta and remnants (e.g. the dust chemical composition, grain size distribution and temperatures). The chemical composition of the dust is illustrated for all progenitor masses in Figure 8, where we assume that all clusters are spontaneously depleted in dust grains with 100 % efficiency at all times. For our standard case, the final dust composition and mass fraction at day 1500 consist of 60 % amorphous carbon , 20 % alumina, 15 % forsterite, and a few % pure metal clusters, namely, Si, Mg, Fe, silica, and silicon carbide clusters. This dust composition is different from that assumed in analysis of IR and submm data and reflects the chemically-controlled nucleation of dust clusters. The formation sequence and the gradual growth of dust clusters with time in the ejecta is a consequence of the ejecta chemistry that produces molecules combined with the nucleation processes of the various clusters. Hence, this gradual growth of clusters represents a genuine explanation for the existing discrepancy between the small dust masses found in SNe and the larger dust masses inferred in SNRs.
3.2 Impact of the 56Ni Mass
The 56Ni mass produced by SNe can be derived from the variation of the optical light curves and Hα luminosities in the nebula phase (Elmhamdi et al., 2003b). From direct identification or by comparison with explosion models, a mass for the supergiant progenitors can be inferred. Table 7 lists some Type II-P SNe, with estimated 56Ni masses and progenitor mass range. Most of the SNe have progenitor masses between 10 and 15 and typical 56Ni masses of 0.01-0.02 , except for SN1987A and SN1999em, which have much larger values for both progenitor and 56Ni mass. This dichotomy reflects the trends derived by Hamuy (2003), that more massive SNe produce more energetic explosions, and SNe with greater energies produce larger 56Ni masses. To account for the low 56Ni-mass SNe, we study the impact of the 56Ni mass on the ejecta chemistry of our standard 15 progenitor, while results for a low-mass progenitor (12 ) with a low 56Ni content (0.01 ) are presented in §3.3.
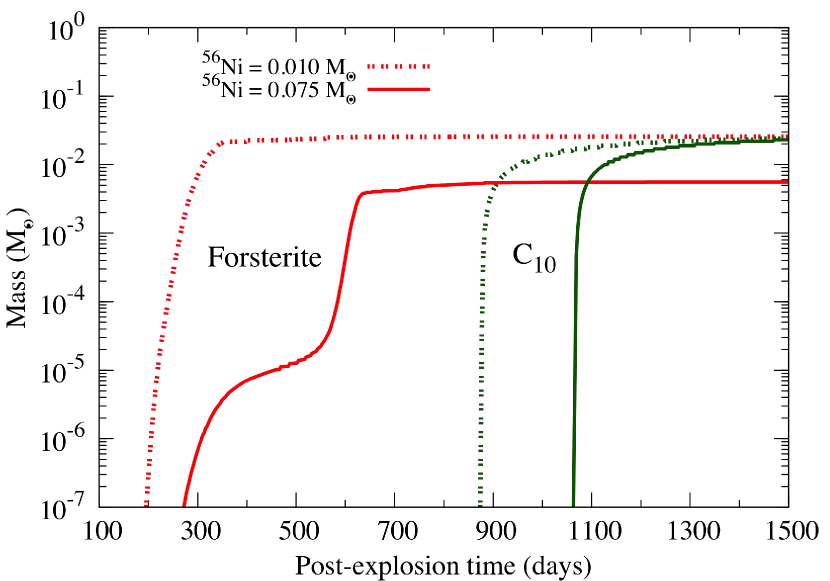
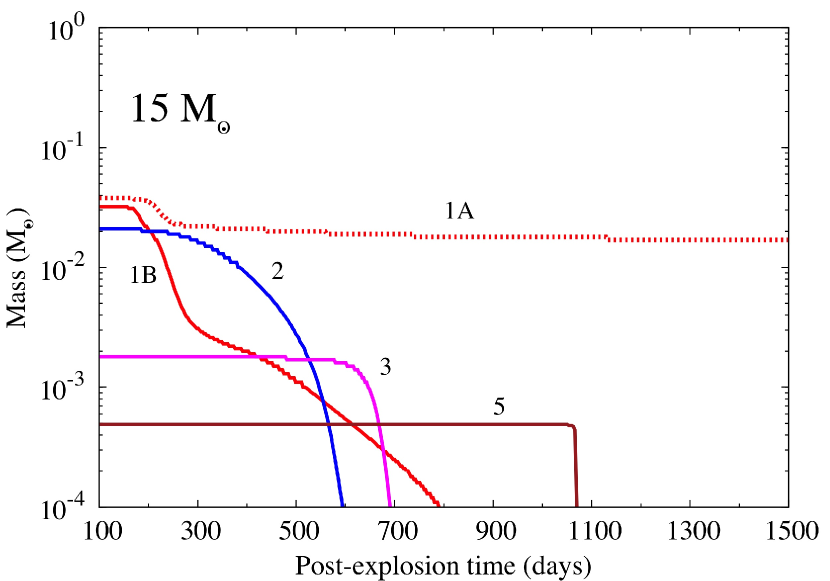
The primary impact of a smaller 56Ni mass in the ejecta is to reduce the number of Compton electrons resulting from the degradation of a smaller amount of -rays. Therefore fewer ions such as Ar+, Ne+, and He+ are produced, enhancing the survival of molecules and clusters. The mass evolution of forsterite clusters and carbon rings versus post-explosion time are illustrated in Figure 9 for the two 56Ni mass values, 0.01 and 0.075 . The destruction of molecules from which clusters form (e.g., SiO and C2) is not as severe for the low 56Ni mass case as it is for the standard case, because of the lower Ne+ and He+ ejecta content. Therefore, the formation of all clusters proceeds at early times and at large gas densities, resulting in a larger molecular component and dust cluster formation efficiency in the ejecta, as seen from table 6. Most importanty, the impact of reducing the 56Ni mass anticipates the formation of forsterite clusters as early as at 250 days in zone 2. These clusters may not coalesce readily into silicate grains because the gas temperature is still high ( K) at day 300, but the efficient formation of silicate clusters results in changing final dust cluster compositions at late time see table 6 and Figure 8. The dust budget now includes 45.0 % forsterite, 41.4 % carbon, and 13.6 % alumina, as opposed to 60 % carbon, 20 % alumina, 15 % forsterite, and a few % pure metal clusters for the standard case of §3.1.2.
3.3 19 & 25 Progenitors
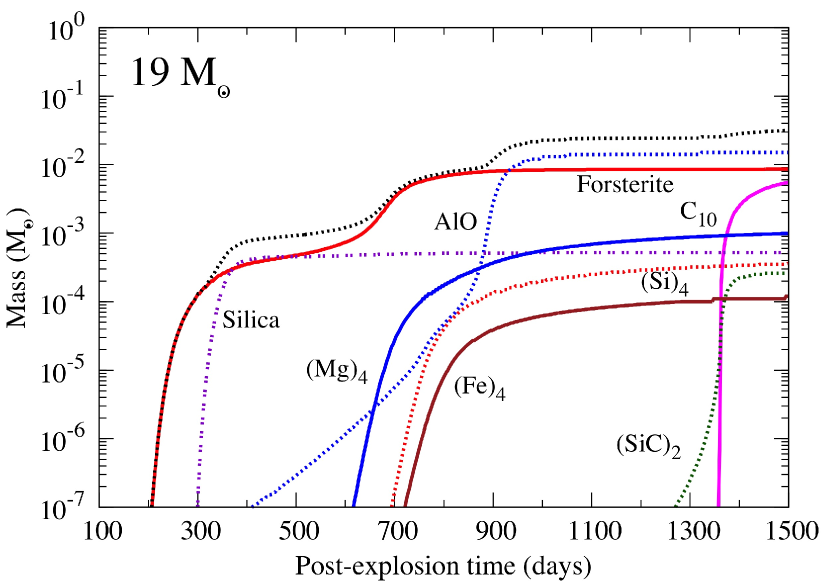
We now present the results for the ejecta chemistry associated with a 19 progenitor. The initial composition of the ejecta is given in table 3, and the chemistry for all zones is identical to that considered for the standard model. All results for molecule and dust masses are summarised in table 8. The masses of CO and SiO formed over the time-span 100-1500 days are shown in Figure 10. The evolution of both molecules with post-explosion time resembles that of the 15 case. The formation of CO commonly occurs in zones 3 and 4, which correspond to zones 4A and 4B of the 15 progenitor. Theses zones are not efficient at forming dust, as seen in table 8. As for the 15 case, the conclusion that CO does not trace carbon dust formation in the ejecta holds for the 19 progenitor. Likewise, the variation of SiO masses with time shows similar trends as for the standard model, the only exception being zone 2. Indeed, the destruction of SiO prevails at early times owing to the high Ne content of the zone, as seen in table 3, that results in high Ne+ masses at early times. The chemical trends for the formation and destruction of O2 and SO are also akin to those already described in §3.1.1. More generally, the total mass of molecules produced by the 19 progenitor is higher by a factor of 2 compared with the 15 case, but the efficiencies of forming molecules for the two cases are similar. About 30 % of the material ejected by a SN with a progenitor mass of is in molecular form.
In Figure 11, we show cluster mass evolution as a function of time for the 19 progenitor. The FeS clusters are the first to form in Zone 1A with a small mass compared with pure iron clusters (see table 8). Furthermore, the FeS mass is smaller than that derived by Cherchneff & Dwek (2010) for the 20 progenitor with zero metallicty. This discrepancy arises from the larger Fe/S yields characterising the innermost zones of the primeval 20 progenitor. Forsterite clusters experience two phases of growth. The first phase between 200 and 500 days is characterised by a forsterite mass reaching a value at 300 days. Zone 1B is responsible for this early growth event owing to the first production event of SiO at day 200 seen in Figure 10. A second forsterite growth event occurs around day 700, corresponding to the peak in SiO formation in zone 2 at this time. The composition of the grains is shown in Figure 8. The prevalent dust formed is alumina, followed by forsterite, carbon, and finally some Mg dust. Despite similarities between the chemical processes at play in the formation and destruction of molecules and dust in the ejecta, and similar upper limit values on the final dust mass at day 1500, the variation in the dust composition between the 15 and the 19 progenitors reflects the initial chemical composition of the ejecta given by the explosion nucleosynthesis models.
We now consider the ejecta of a 25 progenitor with a high 56Ni mass (0.075 ), a surrogate for the explosion of a massive star like the progenitor of SN2004et, or the explosion of population II supergiant stars at high redshift, metallicity not with standing. The cluster masses versus post-explosion time are shown in Figure 11 and the molecule and cluster masses as a function of ejecta zoning are listed in table 7. The synthesis of clusters starts at day 200 with a rapid increase in the forsterite mass that reaches at day 400 and at 700 days. As seen from table 3, a large oxygen and silicon content characterises the oxygen core zones 2 and 3 of the 25 progenitor, and triggers an efficient silicate cluster synthesis. The large aluminium and oxygen yields characterising zone 3 guarantee the formation of a large mass of AlO, the molecular precursor to Al2O3. However, the large Ne yield of the zone results in a large Ne+ abundance that delays the formation of AlO to day 750. Table 3 also indicates a large fraction of carbon compared with oxygen (C/O ) accompanied by a large yield of helium in zone 5. Such a composition results in the delayed formation of carbon and silicon carbide clusters in this zone after day 1500 owing to the large fraction of He+ in the zone. As illustrated in Figure 8, the 25 progenitor primary forms alumina and forsterite clusters, while carbon dust is a very minor component of the condensates formed by these massive SNe.
To conclude, SNe with large progenitor masses tend to form dust with efficiencies similar to that of the standard 15 progenitor, but are more efficient at forming molecules. The molecular component of the ejecta can be as large as 50 % of the total ejected mass. The larger the progenitor mass, the later carbon clusters form owing to the large He+ content in the outermost ejecta zone. At late time, the decrease in gas number densities may hamper the efficient condensation of carbon chains in AC dust. In the end, these massive progenitors produce a small mass of carbon clusters that may not totally transform into dust, but should chiefly synthesise O-rich condensates (e.g., silicates and alumina) in their ejecta.
3.4 12 Progenitor with a Low 56Ni Mass
As shown from table 7, low-mass progenitors tend to produce low 56Ni mass in contrast with large-mass progenitors. We thus model the ejecta of a 12 progenitor with a small 56Ni mass (0.01 ), that can be regarded as a template for low-energy, faint SNe. Another SN environment originating from a low-mass progenitor includes the Crab Nebula, a SN remnant resulting from the explosion of a supergiant with mass 10 (Davidson & Fesen, 1985; MacAlpine & Satterfield, 2008). The molecule and cluster masses as a function of ejecta zoning for the 12 progenitor are given in table 8. At large, results akin to those for other progenitor masses are obtained, i.e., the ejecta produces a large fraction of molecules ( % by mass). The ejecta zone most efficient at producing species including CO and O2 corresponds to the O-and C-rich outer zone of the oxygen core (labelled zone 3) characterised by a C/O ratio with a typical value of 0.3. For the 12 progenitor, the innermost zone, zone 1A, is also very efficient at producing SiS because of the large initial Si and S yields and the low Fe yield, as seen in table 3. Essentially all atomic S gets trapped in SiS in this zone.
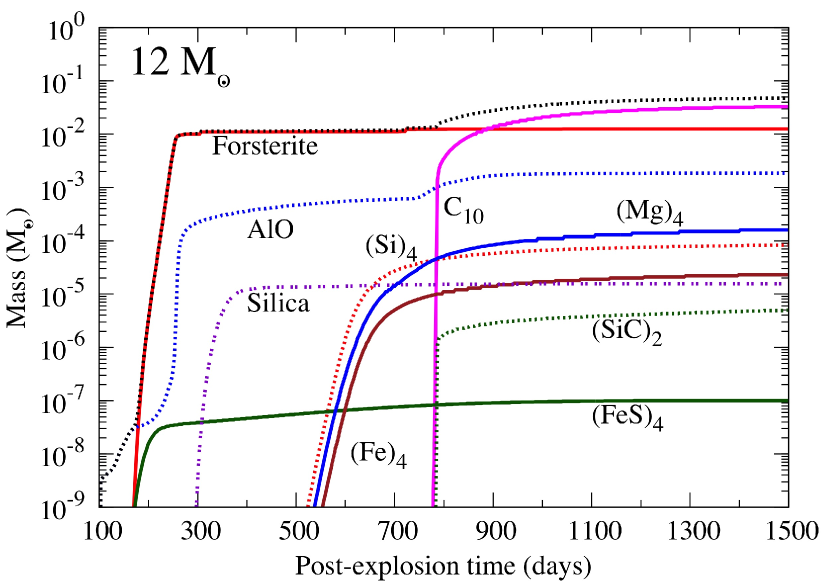
As for dust, cluster masses versus post-explosion time are shown in Figure 12. As discussed in §3.2, the formation of forsterite clusters occurs as early as 250 days post-explosion owing to the low 56Ni ejecta content. However, the gas temperature at day 250 is too high ( 2500 K) to permit the coalescence of forsterite clusters in silicate dust. This process will take place once the gas temperature reaches 1500 K around day 400. However, for this progenitor, the onset of AlO formation also occurs around day 250. Alumina, Al2O3, being more refractory than silicates, may then precede the formation of forsterite between 250 and 300 days, leading to the early formation of Al2O3 dust in the ejecta, followed by a forsterite dust formation event. As for the 15 low 56Ni case, the synthesis of carbon chains and rings is also shifted to an earlier epoch, 800 days, implying that AC grains will form more efficiently in low-mass SN progenitors because of the larger gas densities. A 12 model should thus lead to a dust formation timesequence of Al2O3 silicate, AC, where in the end, carbon represents %, silicate 28 %, and alumina 6 % of the total dust mass, respectively, as seen from Figure 8.
A dust formation event before 200 days, possibly involving alumina as a first condensate, should then characterise SN progenitors with masses smaller than 12 and low 56Ni masses. Such an early dust formation episode is observed in some SNe with low-mass progenitors, e.g., SN2011ht (Mauerhan et al., 2012), and is often ascribed to the interaction of the explosion blast wave with the dense progenitor wind at early epochs. A dense shell conducive to dust condensation forms in the post-shock region, resulting in a dust production episode. The present results indicate that the early formation of dust may also be due to a low 56Ni mass in the ejecta. Hence, the observed early condensation episode in faint SNe may arise from a combination of both scenarios.
3.5 Elements
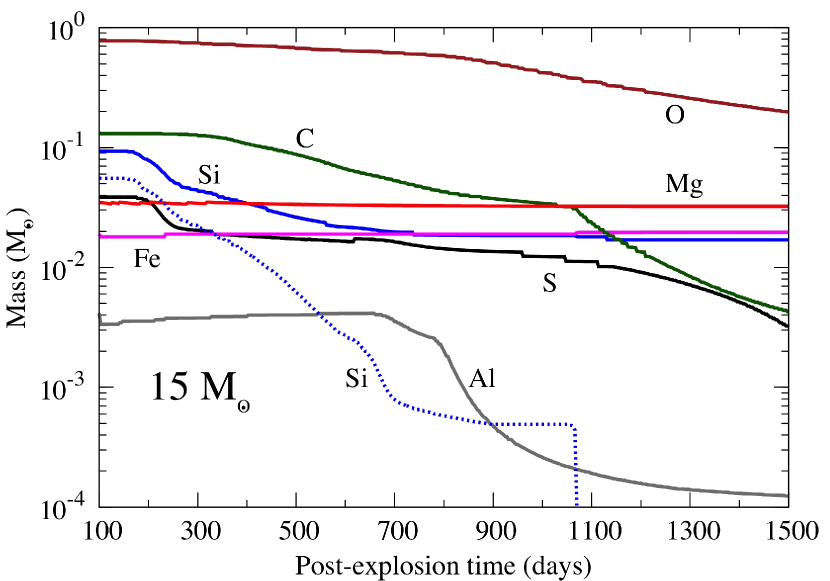
Sections §3.1.1 and §3.1.2 highlighted the importance of the molecular and dust components of SN ejecta, that amount to 30%50 % of the ejecta mass depending on the progenitor mass. The rest of the ejecta is in the form of atomic elements, either neutrals or ions. The masses of elements as a function of post-explosion time are shown in Figure 13 for the standard case. The top figure illustrates the masses summed over all ejecta zones versus time, while the bottom figure focuses on atomic Si mass variation versus time for each zone. Until day 800, most elements including O, Mg, Fe, and Al show almost constant masses in the ejecta. After day 800, O and Al masses decrease owing to the formation of AlO in the O-rich core of the ejecta. The mass of atomic carbon shows a small decrease after day 300 due to the formation of CO in most of the zones, and a sharper decline after day 1050 resulting from the formation of carbon chains and rings in zone 5. The overall atomic silicon mass slightly decreases over time until it reaches a constant mass at day 700. This mass variation primarily reflects zone 1A where the large Si content is depleted at early epochs in the formation of SiS (see Figure 2). The Si dotted line in the top figure depicts the Si mass summed over all zones except for zone 1A. These zones include the oxygen-rich core of the ejecta (Zones 1B, 2, and 3) where most of the silica and silicate clusters form. The summed Si mass shows a sharp decline between 200 and 800 days that reflects the depletion of Si in the formation of SiO, silica and silicates in zones 1B, 2 and 3, between day 200 and day 700.
As first shown by Lucy et al. (1989) for SN1987A, the fluxes of the [OI] 6300 Å and MgI] 4571 Å emission lines faded with time, with a sharper decline at day 530, indicative of the onset of dust formation. The [SiI] emission line at 1.6445 m showed a markedly stronger fading relative to the continuum, that pinpointed either a decrease in the Si abundance owing to dust condensation or temperature effect induced by strong cooling in the Si zone. A similar fading of the Mg and O line fluxes from day 500 until day 800 observed by Lucy et al. indicates that extinction induced by dust condensation around day 500 was responsible for the fading. This interpretation is supported by the present calculations, as both elements show a time-independent mass evolution over this time span. On the other hand, the sharper fading observed in the Si emission line flux probably ensues from the combined effects of extinction and Si depletion in SiO and dust grains, as illustrated in Figure 13.
3.6 Comparison with Existing Studies
Several studies have tackled the modelling of dust formation in Type II-P SNe. The first attempt to model the synthesis of grains in SN1987A was carried out by Kozasa et al. (1989). Later studies dealt with the formation of dust in Type II-P SNe locally (Bianchi & Schneider, 2007) and at high redshift (Todini & Ferrara, 2001; Nozawa et al., 2003). All these studies consider the formation of dust grains from the gas phase using classical nucleation theory (CNT). Some assume a fully-mixed ejecta (Todini & Ferrara, 2001; Bianchi & Schneider, 2007) while others consider stratified ejecta (Kozasa et al., 1989; Nozawa et al., 2003; Kozasa et al., 2009). A few studies consider the impact of the steady-state formation of CO and SiO from the gas phase, including the destruction of CO by Compton electrons, on the final carbon and silicate dust mass (Todini & Ferrara, 2001; Bianchi & Schneider, 2007). This assumption gives rise to the formation of carbon dust in a fully mixed ejecta with a C/O ratio less than 1, a result that contradicts the findings of Kozasa et al. (1989).
All existing CNT-based models for the progenitor masses of interest in the present study are summarised in table 9, with the derived dust masses and the modelled dust condensation sequences over time. CNT-derived dust masses for solar metallicity ejecta have values higher by a factor of compared with the upper limits of dust masses derived in this study. This discrepancy follows from several assumptions. First, several models (Todini & Ferrara, 2001; Bianchi & Schneider, 2007) consider a fully-mixed ejecta. Such a scenario is not confirmed by explosion hydrodynamic models (Hammer et al., 2010), and observations of SN remnants which point to the memory of nucleosynthesis layers within the remnant, as in Cas A (Isensee et al., 2012). Because the dust mass is derived from the total elemental yields and chemistry is not properly considered, fully-mixed ejecta always produce larger dust quantities. Second, in unmixed models, CNT is applied to steady-state conditions that are usually not found in the dynamic environments characterising SN ejecta. Finally, all CNT-based models ignore the non-equilibrium chemistry related to the formation of molecules and dust clusters, and the specific physics of SN ejecta where radioactivity greatly impacts the gas-phase chemistry through Compton electron ionisation.
These specificities also affect the dust condensation sequence, as seen in table 9. In CNT-based studies, the condensation sequence is derived assuming equilibrium temperature and pressure as initial conditions. In the present study, the dust condensation sequences ensue from non-equilibrium chemical kinetics and thus depend on ejecta parameters such as the initial post-explosion elemental yields, the mass of 56Ni produced, and the gas temperature and density. This fact is well illustrated by the 15, 19, and 25 progenitors, for which silicate clusters form before the molecule AlO, when alumina, Al2O3, is supposed to be the first solid to condense in O-rich environments at thermodynamic equilibrium (Tielens et al., 1998). Here, Mg2SiO4 production precedes that of Al2O3 because of the early destruction of AlO molecules by Ne+ ions in the gas.
More generally, existing studies based on CNT overestimate the total dust mass formed in SN ejecta. Dust formation sequences assuming thermodynamic equilibrium are very commonly used as benchmarks in the modelling of dust synthesis in O-rich evolved stellar media, but should be avoided when modelling stellar outflows and ejecta, where dynamics and chemistry control the synthesis of condensates.
4 SUMMARY AND DISCUSSION
We have investigated the synthesis of molecules and dust clusters in stratified ejecta of Type II-P SNe with solar metallicity. Our results highlight the following points
-
•
Molecules including SiS, CO, O2, and SO represent a large fraction of the gas-phase ejecta ( 30% by mass). Specifically, the CO mass increases from at 100 days and gradually reaches 0.1 1500 days post-explosion for all SN progenitors. This high CO mass forms in an ejecta zone where carbon dust does not condense, suggesting that most of the observed CO does not trace the carbon dust formation process in SN ejecta.
-
•
The molecule SiO efficiently forms at an early epoch and is quickly converted into SiO dimers and silica and silicate clusters. The mass of SiO at day 1500 is or less. SiO is thus a direct tracer of dust formation in SN ejecta.
-
•
The dust clusters form at different post-outburst epochs in various zones. Silicate clusters experience a delayed formation owing to the early destruction of O2 and SO. The growth of silicate clusters via oxygen addition then occurs at day 500 for our standard case. Carbon chains and rings and silicon carbide clusters form in the outermost zone of the He-cores and at late times owing to the detrimental attack of He+ on molecules. In more general terms, the dust mass gradually increases over time from at 400 days to after day 1500. This gradual synthesis of dust clusters over a time span of 4 yr provides a plausible explanation for the discrepancy observed between the dust masses derived from IR observations at early epochs and the larger masses of cool dust observed at submm wavelengths in SN remnants.
-
•
The formation of dust clusters occurs according to a sequence of condensation events at various epochs. Low-mass progenitors experience anticipated dust formation events of essentially carbon dust with a minor silicate and alumina component, owing to the small masses of 56Ni in the ejecta. High-mass progenitors primary form silicates and alumina dust, with a minor component of carbon dust. Compared with existing models of dust synthesis in Type II-P SNe based on Classical Nucleation Theory, our results indicate masses of synthesised dust that are smaller by a factor of and different dust condensation sequences and chemical compositions.
The large fraction of the material expelled in a SN event is in molecular form ( 20%50 %) with a chemical composition including SiS, CO, O2, and SO, depending on zoning. These four chemical species will pervade the late stages of SN evolution, i.e., the SN remnant not yet hit by the reverse shock. Evidence for molecules in SN remnants was presented by the detection of the first overtone transition of CO in the young remnant Cas A (Rho et al., 2009). The fundamental band at 4.56 m was subsequently observed with AKARI (Rho et al., 2012). As already proposed by Cherchneff & Sarangi (2011), our results strongly suggest that a large fraction of cool CO ( 0.1 ) formed in the ejecta should pervade the remnant gas not yet shocked by the reverse shock and thus be detectable. The recent detection with ALMA of cool CO formed in the ejecta of SN1987A with a derived mass 0.1 confirms our present results (Kamenetzky et al., 2013). Most interesting are the large masses of SiS ( ) formed in the innermost zone of SN ejecta. Emission line analysis of SN remnants suggest that the remnant has retained some memory of the ejecta stratification due to nucleosynthesis, consistent with explosion models (Chevalier & Kirschner, 1978; Fesen et al., 2006; DeLaney et al., 2010; Isensee et al., 2012; Ghavamian et al., 2012). If so, SiS molecules should exist in the Cas A remnant in sulphur, silicon, and calcium-rich fast moving knots, and possibly be detectable there at submm wavelengths.
The present results on molecules may put constraint on the physical parameters of the ejecta. The formation of SiO dimers is a good example. The SiO dimer formation rate is gas pressure-dependent and usually very low at the low pressure encountered in the ejecta before day 400. When the SiO dimerisation rate derived by Zachariah & Tsang (1993) is used for the ejecta pressure, SiO and subsequent forsterite dimer formation is postponed to late epochs (t 700 days) as shown by Cherchneff & Dwek (2010) for primeval, massive SN explosions. In the present models, the SiO dimerisation rate has been increased to account for the density enhancement found in clumps, and the match between SiO observational data and modelled masses is satisfactory (see Figure 4). We conclude that the observed SiO line fading and the timing for dust condensation are thus indirect indicators of the clumpy nature of SN ejecta.
The upper limit on dust mass produced by our sample of SNe spans the range. These values are much larger than those derived from IR data but somewhat less than values derived from submm data, i.e., 0.40.7 for SN1987A and 0.24 for the Crab Nebula. However, these large masses have been derived assuming a simple dust composition (usually, either carbon or silicate with the addition of some iron), and restricted physical parameters (i.e., one or two dust temperatures). The chemistry of dust synthesis has not been considered and condensing efficiencies of 100 % of all available elements are usually assumed (e.g., Matsuura et al., 2011). All of these factors tend to boost the mass of solids synthesised in SN ejecta, when lower dust masses should be expected due to the bottleneck effect of the nucleation phase and the large variety of condensates produced in the gas. To validate our modelled dust chemical compositions, masses, and formation sequences, a study on the modelling of IR and submm fluxes for the homogeneous and clumpy ejecta of several SNe and SNRs will be presented in a forthcoming paper.
The possibility of new formation of grains and their growth at late epochs (t yr) in the ejecta must be addressed. First, the formation of new grains in the expending ejecta after 5 yr should be hampered by the shortage of the chemical agents responsible for the first nucleation step, i.e. SiO or C2, which are depleted in the ejecta between 300 and 2000 days, depending on the progenitor mass. Second, the growth of existing dust grains via accretion of abundant atoms or molecules such as atomic C, Mg, Si, or O2 on the grain surface will happen on a time scale given by where , , and are the number density, the collision cross section, and the temperature of the grains, respectively, and are the thermal velocity and temperature of the gas, respectively, and is the sticking coefficient. For typical grain sizes (0.1 m) and ejecta gas conditions after day 2000 ( cm-3 and K), the sticking coefficient is 0.5 and the estimated accretion time is yr. This time scale exceeds the free expansion phase of SNe, and by that time, the ejecta will have been reprocessed by the reverse shock in the remnant. Therefore, late grain growth cannot proceed due to the very long accretion time required to add mass to the grains. The dust observed in SNe and SN remnants has thus formed in the nebular phase of the ejecta before 5 years after the explosion.
Finally, our finding of a gradual increase in dust mass due to a sequence of various condensation events in the ejecta reconciles the mass values derived from IR data with those from submm data. A hint of some increase in the dust mass over time was already indicated for SN1987A by Wooden et al. (1993), who inferred a 1.6 factor increase in the dust mass between 615 and 775 days, a value that agrees well with our results for the 19 progenitor. Obviously, the present models use simplistic, one-dimensional explosion models for SNe and have not yet included the dust condensation phase. In this regard, three-dimensional explosion models provide more realistic samples of clump chemical compositions. Because of the strong impact of 56Ni on the ejecta chemistry through the formation of noble gas ions, each clump has a specific composition, thermal and density history, and thus a specific dust condensation scenario and efficiency. Applying a chemical kinetic formalism of the dust synthesis to such clumps, including the thermal feedback of molecules such as CO, SiO, and SiS, will fine-tune the prediction of the final dust mass produced by SN ejecta. However, from the present study, we anticipate that Type II-P SNe are efficient but moderate dust producers in local and remote galaxies. In the context of primeval galaxies at highedshift, the requirement that SNe produce 1 of dust in order to explain the large amount of dust produced at high redshift (Dwek et al., 2007) is not satisfied. According to the present study, the explosion of primitive supergiant stars as SNe should produce at most 0.1 of O-rich dust, but grain destruction induced by shocks in the remnant phase will lower this value. These results argue for alternative and efficient O-rich and carbon dust providers (e.g., asymptotic giant branch stars, quasars) to account for the large dust masses present in the early universe.
Two tables are provided in the Appendix. Table 3 lists the chemical scheme and the reaction rates for the nucleation of clusters implicated in the nucleation phase. Table 4 summarises the rates of reactions with the Compton electrons induced by radioactivity in the ejecta.
| Reaction | Reactants | Products | Aij | Ea | ReferencesbbZT93 Zachariah & Tsang (1993); CD10 Cherchneff & Dwek (2010); E Estimated. | ||
|---|---|---|---|---|---|---|---|
| (SiO)n clusters | |||||||
| A1 | SiO+SiO | Si2O2 | 4.6086 | 0 | -2821.4 | ZT93, CD10 | |
| A2 | Si2O2+SiO | Si3O3 | 2.2388 | 0 | -2878.9 | ” | |
| A3 | Si2O2+ Si2O2 | Si3O3+SiO | 1.5265 | 0 | -2386.8 | ” | |
| A4 | Si3O3+SiO | Si4O4 | 1.5265 | 0 | -2386.8 | ” | |
| A5 | Si2O2+ Si2O2 | Si4O4 | 1.5265 | 0 | -2386.8 | ” | |
| A6 | Si3O3+ Si2O2 | Si4O4+SiO | 1.5265 | 0 | -2386.8 | ” | |
| A7 | Si4O4+SiO | Si5O5 | 1.5265 | 0 | -2386.8 | ” | |
| A8 | Si3O3+ Si2O2 | Si5O5 | 1.5265 | 0 | -2386.8 | ” | |
| A9 | Si2O2 | SiO+SiO | 7.7200 | 0 | 0 | ” | |
| A10 | Si3O3 | Si2O2+SiO | 7.8300 | 0 | 0 | ” | |
| A11 | Si4O4 | Si3O3+SiO | 9.9000 | 0 | 0 | ” | |
| A12 | Si4O4 | Si2O2+Si2O2 | 9.9000 | 0 | 0 | ” | |
| A13 | Si5O5 | Si3O3+Si2O2 | 9.9000 | 0 | 0 | ” | |
| Forsterite (Mg4Si2O8) and Enstatite (Mg2Si2O6) dimers | |||||||
| B1 | Si2O2+O2 | Si2O3+O | 1.0000 | 0 | 1000 | E | |
| B2 | Si2O2+SO | Si2O3+S | 1.0000 | 0 | 1000 | as B1 | |
| B3 | Si2O3+Mg | MgSi2O3 | 1.0000 | 0 | 0 | E | |
| B4 | MgSi2O3+O2 | MgSi2O4+O | 1.0000 | 0 | 0 | as B3 | |
| B5 | MgSi2O3+SO | MgSi2O4+S | 1.0000 | 0 | 0 | as B3 | |
| B6 | MgSi2O4+Mg | Mg2Si2O4 | 1.0000 | 0 | 0 | as B3 | |
| B7 | Mg2Si2O4+O2 | Mg2Si2O5+O | 1.0000 | 0 | 0 | as B3 | |
| B8 | Mg2Si2O4+SO | Mg2Si2O5+S | 1.0000 | 0 | 0 | as B3 | |
| B9 | Mg2Si2O5+O2 | Mg2Si2O6+O | 1.0000 | 0 | 0 | as B3 | |
| B10 | Mg2Si2O5+SO | Mg2Si2O6+S | 1.0000 | 0 | 0 | as B3 | |
| B11 | Mg2Si2O6+Mg | Mg3Si2O6 | 1.0000 | 0 | 0 | as B3 | |
| B12 | Mg3Si2O6+O2 | Mg3Si2O7+O | 1.0000 | 0 | 0 | as B3 | |
| B13 | Mg3Si2O6+SO | Mg3Si2O7+S | 1.0000 | 0 | 0 | as B3 | |
| B14 | Mg3Si2O7+Mg | Mg4Si2O7 | 1.0000 | 0 | 0 | as B3 | |
| B15 | Mg4Si2O7+O2 | Mg4Si2O8+O | 1.0000 | 0 | 0 | as B3 | |
| B16 | Mg4Si2O7+SO | Mg4Si2O8+S | 1.0000 | 0 | 0 | as B3 | |
| SinOn+1 clusters | |||||||
| C1 | Si2O3+O | Si2O2+O2 | 1.0000 | 0 | 0 | E | |
| C4 | Si2O3+S | Si2O2+SO | 1.0000 | 0 | 0 | E | |
| C5 | Si3O3+O2 | Si3O4+O | 1.0000 | 0 | 1000 | as B1 | |
| C6 | Si3O3+SO | Si3O4+S | 1.0000 | 0 | 1000 | ” | |
| C7 | Si4O4+O2 | Si4O5+O | 1.0000 | 0 | 1000 | ” | |
| C8 | Si4O4+SO | Si4O5+S | 1.0000 | 0 | 1000 | ” | |
| C9 | Si2O3+SiO | Si3O4 | 7.4627 | 0 | -2878.9 | ZT93 | |
| C10 | Si3O4+SiO | Si4O5 | 5.0884 | 0 | -2386.8 | ” | |
| C11 | Si2O2+SiO | Si2O3+Si | 7.4627 | 0 | -2878.9 | ” | |
| C12 | Si3O3+SiO | Si3O4+Si | 5.0884 | 0 | -2386.8 | ” | |
| C13 | Si4O4+SiO | Si4O5+Si | 5.0884 | 0 | -2386.8 | ” | |
| Cluster Fragmentation | |||||||
| D1 | Si2O2+M | SiO+SiO+M | 4.4000 | 0 | 98600.0 | CD10 | |
| D2 | Si3O3+M | Si2O2+SiO+M | 4.4000 | 0 | 98600.0 | ” | |
| D3 | Si4O4+M | Si3O3+SiO+M | 4.4000 | 0 | 98600.0 | ” | |
| D4 | Si4O4+M | Si2O2+Si2O2+M | 4.4000 | 0 | 98600.0 | ” | |
| D5 | Si5O5+M | Si4O4+SiO+M | 4.4000 | 0 | 98600.0 | ” | |
| D6 | Si5O5+M | Si2O2+Si3O3+M | 4.4000 | 0 | 98600.0 | ” | |
| D7 | Si2O3+M | Si2O2+O+M | 5.0000 | 0 | 55000.0 | ” | |
| D8 | Si3O4+M | Si3O3+O+M | 5.0000 | 0 | 55000.0 | ” | |
| D9 | Si4O5+M | Si4O4+O+M | 5.0000 | 0 | 55000.0 | ” | |
| D10 | MgSi2O3+M | Si2O3+Mg+M | 1.0000 | 0 | 98600.0 | as D1 | |
| D11 | MgSi2O4+M | MgSi2O3+O+M | 1.0000 | 0 | 98600.0 | ” | |
| D12 | Mg2Si2O4+M | MgSi2O4+Mg+M | 1.0000 | 0 | 98600.0 | ” | |
| D13 | Mg2Si2O5+M | Mg2Si2O4+O+M | 1.0000 | 0 | 98600.0 | ” | |
| D14 | Mg2Si2O6+M | Mg2Si2O5+O+M | 1.0000 | 0 | 98600.0 | ” | |
| D15 | Mg3Si2O6+M | Mg2Si2O6+Mg+M | 1.0000 | 0 | 98600.0 | ” | |
| D16 | Mg3Si2O7+M | Mg3Si2O6+O+M | 1.0000 | 0 | 98600.0 | ” | |
| D17 | Mg4Si2O7+M | Mg3Si2O7+Mg+M | 1.0000 | 0 | 98600.0 | ” | |
| D18 | Mg4Si2O8+M | Mg4Si2O7+O+M | 1.0000 | 0 | 98600.0 | ” | |
| = 0.07 | = 0.01 | |||||||
|---|---|---|---|---|---|---|---|---|
| Species | Reactions | Wi (eV) | A - 15 aaThe rate is expressed in a Arrhenius form kC: A . See Cherchneff & Dwek (2010) for details. | A - 19 aaThe rate is expressed in a Arrhenius form kC: A . See Cherchneff & Dwek (2010) for details. | A - 12 aaThe rate is expressed in a Arrhenius form kC: A . See Cherchneff & Dwek (2010) for details. | A - 15 aaThe rate is expressed in a Arrhenius form kC: A . See Cherchneff & Dwek (2010) for details. | A - 25 aaThe rate is expressed in a Arrhenius form kC: A . See Cherchneff & Dwek (2010) for details. | Reference |
| CO | O+ + C | 768 | 7.7671 | 6.1663 | 4.9768 | 1.1763 | 5.6102 | Liu & Dalgarno (1995) |
| C+ + O | 247 | 2.4150 | 1.9173 | 1.5472 | 3.6576 | 1.7444 | ” | |
| C + O | 125 | 4.7722 | 3.7887 | 3.0575 | 7.2268 | 3.4466 | ” | |
| CO+ + e- | 34 | 1.7544 | 1.3928 | 1.1241 | 2.6570 | 1.2672 | ” | |
| O | O+ + e- | 46.2 | 1.2911 | 1.3082 | 8.2723 | 1.9554 | 9.3259 | ” |
| C | C+ + e- | 36.4 | 1.6297 | 1.3010 | 1.0500 | 2.4819 | 1.1837 | ” |
| SiO | O+ + Si | 678 | 8.7986 | 6.9852 | 5.6372 | 1.3324 | 6.3546 | ” |
| Si+ + O | 218 | 2.7363 | 2.1724 | 1.7531 | 4.1441 | 1.9764 | ” | |
| Si + O | 110 | 5.4228 | 4.3051 | 3.4747 | 8.2128 | 3.9169 | ” | |
| SiO+ + e- | 30 | 1.9884 | 1.5786 | 1.2740 | 3.0114 | 1.4362 | ” | |
| N2 | N+ + N | 264 | 2.2594 | 1.7938 | 1.4477 | 3.4219 | 1.6320 | Khare & Kumar (1977) |
| N+ N | 133.5 | 4.4683 | 3.5474 | 2.8628 | 6.7673 | 3.2275 | ” | |
| N + e- | 36.3 | 1.6433 | 1.3046 | 1.0529 | 2.4886 | 1.1870 | ” | |
| He | He+ + e- | 46.3 | 1.2884 | 1.0229 | 8.2549 | 1.9511 | 9.3054 | ” |
| Ne | Ne+ + e- | 36.4 | 1.6387 | 1.3010 | 1.0500 | 2.4819 | 1.1837 | ” |
| Ar | Ar+ + e- | 26.2 | 2.2767 | 1.8075 | 1.4588 | 3.4481 | 1.6445 | ” |
References
- Andrews et al. (2011) Andrews, J., Gallagher, J.S., Clayton, G.C. et al. 2011, ApJ, 715, 541
- Archibong & St.-Amant (1999) Archibong, E. F. & St.-Amant, A. 1999, J. Phys. Chem., 103, 1109
- Barlow et al. (2010) Barlow, M. J., Krause, O., Swinyard, B. M. et al. 2010, A&A, 518, L138
- Bertoldi et al. (2003) Bertoldi, F., Carilli, C.L., Cox, P., et al. 2003, A&A, 406, 55
- Bianchi & Schneider (2007) Bianchi, S. & Schneider 2007, MNRAS, 378, 973
- Cherchneff & Lilly (2008) Cherchneff, I. & Lilly, S. 2008, ApJ, 683, L123
- Cherchneff & Dwek (2009) Cherchneff, I. & Dwek, E. 2009, ApJ, 703, 642
- Cherchneff & Dwek (2010) Cherchneff, I. & Dwek, E. 2010, ApJ, 715, 1 (CD10)
- Cherchneff (2010) Cherchneff, I. 2010, ASPC, 425, 237
- Cherchneff (2011) Cherchneff, I. 2011, A$A, 526, L11
- Cherchneff & Sarangi (2011) Cherchneff, I. & Sarangi, A. 2011, in IAU Symp. 280 ”The Molecular Universe”,eds. J. Cernicharo & R. Bachiller, (Cambridge: Cambridge Univ. Press), 228
- Chevalier & Kirschner (1978) Chevalier, R.A & Kirscher, R.P 1978, ApJ, 219, 931
- Danziger et al. (1988) Danziger, I.J., Bouchet, P., Fosbury, R.A.E., et al. 1988, in Proc. Fourth George Mason Astrophysics Workshop, ’Supernova 1987A in the Large Magellanic Cloud’, (Cambridge; Cambridge Uni. Press), 37
- Danziger et al. (1991) Danziger, I.J., Lucy, L.B., Bouchet, P. & Gouiffes, C. 1991, in ’Supernovae, the tenth santa Cruz Workshop in Astronomy and Astrophysics’, ed. S. E. Woosley, (New York: Springer-Verlag), 69
- Davidson & Fesen (1985) Davidson, K. & Fesen, R.A. 1985, ARA&A, 23, 119
- DeLaney et al. (2010) DeLaney, T., Rudnick, L., Stage, M.D. et al. 2010, ApJ, 725, 2038
- Dwek et al. (2007) Dwek, E., Galliano, F., Jones, A.P. 2007, ApJ, 662, 927
- Elmhamdi et al. (2003a) Elmhamdi, A., Danziger, J., Chugai, N. N., Danziger, I.J. et al. 2003b, MNRAS, 338, 939 (2003a)
- Elmhamdi et al. (2003b) Elmhamdi, A., Chugai, N. N., & Danziger, I.J. 2003, A&A, 404, 1077 (2003b)
- Ercolano et al. (2007) Ercolano, B., Barlow, M. J. & Sugerman, B. E. K. 2007, MNRAS, 375, 753
- Fesen et al. (2006) Fesen, R.A, Hammel, M.C., Morse, J. et al. 2006. ApJ, 636, 859
- Gallagher et al. (2012) Gallagher, J. S., Sugerman, B. E. K., Clayton, G. C. et al. 2012. ApJ, 753, 109
- Gandhi et al. (2013) Gandhi P., Yamanaka, M, Tanaka, M. et al. 2013, ApJ, 767, 166
- Ghavamian et al. (2012) Ghavamian, P., Long, K.S., Blair, W.P. et al. 2012, ApJ, 750, 39
- Gomez et al. (2012) Gomez, H.L., Krause, O., Barlow, M.J. et al. 2012, ApJ, 760, 96
- Goumans & Bromley (2012) Gouman, F. & Bromley S.T. 2012, MNRAS, 420, 3344
- Hammer et al. (2010) Hammer, N.J., Janka H.-Th & Müller, E 2010, ApJ, 714, 137
- Hamuy (2003) Hamuy, M. 2003, ApJ582, 905
- Hendry et al. (2005) Hendry, M.A., Smartt, S.J., Maund, J.R. et al. 2005, MNRAS, 359, 906
- Inserra et al. (2011) Inserra, C., Turatto, M., Pastorello, A. et al. 2011, MNRAS, 422, 1122
- Inserra et al. (2012) Inserra, C., Turatto, M., Pastorello, A. et al. 2012, MNRAS, 417, 2611
- Isensee et al. (2012) Isensee, K., Olmschenk, G., Rudnick, L. et al. 2012, ApJ, 757, 126
- Joggerst et al. (2010) Joggerst, C.C., Almgren, A. & Woosley, S.E. 2010, ApJ, 723, 353
- Kamenetzky et al. (2013) Kamenetsky, J., McCray, R., Indebetouw, R. et al. 2013, ApJL 773, L34
- Kotak et al. (2005) Kotak, R., Meikle, W. P. S., van Dyck, S.D. Höflich, P.A. & Mattila, S. 2005, ApJ628, L123
- Kotak et al. (2006) Kotak, R., Meikle, W. P. S., Pozzo, M. et al. 2006, ApJ, 651, L117
- Kotak et al. (2009) Kotak, R., Meikle, W. P. S., Farrah, D. et al. 2009, ApJ, 704, 306
- Kozasa et al. (1989) Kozasa, T., Hasegawa, H. & Nomoto, K. 1989, ApJ, 344, 325
- Kozasa et al. (2009) Kozasa, T., Nozawa, T., Tominaga, N. et al. 2009, ASPC, 414, 43
- Krause et al. (2008) Krause, O., Birkmann, S., Usuda, T. et al. 2008, Science, 320, 1195
- Lepp et al. (1990) Lepp, S., Dalgarno, A., & McCray, R. 1990, ApJ, 358, 262
- Liu et al. (1992) Liu, W. & Dalgarno, A. 1995, ApJ, 454, 472
- Liu & Dalgarno (1995) Liu, W. & Dalgarno, A., & Lepp, S. 1992, ApJ, 396, 679
- Lucy et al. (1989) Lucy, L.B., Danziger, I.J., Gouiffes, C. & Bouchet, P. 1989, in IAU Colloq. 120 ’Structure and Dynamics of the Interstellar Medium’, ed. G. Tenorio-Tagle, M. Moles, & J. Melnick (New York: Springer), 164
- MacAlpine & Satterfield (2008) MacAlpine, G.M. & Satterfield, T.J. 2008, AJ, 136, 2152
- Matsuura et al. (2011) Matsuura, M., Dwek, E., Meixner, M. et al. 2011, Science, 333, 1258
- Meikle et al. (1989) Meikle, W.P.S., Spyromilio, J., Varani, G.-F. & Allen, D.A. 1989, MNRAS, 238, 193
- Mauerhan et al. (2012) Mauerhan, J.C., Smith, N.A., Silverman, J.M et al. 2012, MNRAS, 431, 2599
- Moseley et al. (1989) Moseley, S.H., Dwek, E., Glaccum, W., Graham, J.R. & Loewenstein, R.F. 1989, Nature, 340, 697
- Nozawa et al. (2003) Nozawa, T, Kozasa, T., Umeda, H., Maeda, K., & Nomoto, K. 2003, ApJ, 598, 785 (NK03)
- Nozawa et al. (2010) Nozawa, T., Kozasa, T., Habe, A. et al. 2010, ApJ, 666, 955
- Pastorello et al. (2009) Pastorello, A., Valenti, S., Zampieri, L. et al. 2009, ApJ, 426, 79
- Pei et al. (1991) Pei, Y.C., Fall, S.M. & Bechtold, J. 1991, ApJ, 378, 6
- Pettini et al. (1994) Pettini, M., Smith, L.J., Hunstead, R.W. & M., King, D.L. 1994, MNRAS, 394, 2266
- Rauscher et al. (2002) Rauscher, T., Heger, A., Hofmann, R.D. & Woosley, S.E. 2002, ApJ576, 323
- Reber et al. (2008) Reber, A.C., Paranthaman, S., Clayborne, P.A. et al. 2008, ACSnano, 2-8, 1729
- Rho et al. (2009) Rho, J., Jarrett, T., Reach, W. et al. 2009, ApJ, 693, 39
- Rho et al. (2012) Rho, J., Onaka, T., Cami, J. & Reach, W. 2012, ApJ, 747, 6
- Roche et al. (1991) Roche, P.F., Aitken, D.K. & Smith, C.H. 1991, MNRAS, 252, 39
- Sibthorpe et al. (2010) Sibthorpe, B., Ade, P. A. R., Bock, J. J. 2010, ApJ, 719, 1553
- Smartt et al. (2004) Smartt. S.J., Maund, J.R., Hendry, M.A. et al. 2004, Science, 303, 499
- Smartt (2009) Smartt. S.J. 2009, ARA&A, 47, 63
- Spyromilio et al. (1988) Spyromilio. J, Meikle, W.P.S., Learner, R.C.M. & Allen, D.A. 1988, Nature, 334, 327
- Sugerman et al. (2006) Sugerman, B. E. K., Ercolano, B., Barlow, M. J. et al. 2006, Science 313, 196
- Tielens et al. (1998) Tielens, A.G.G.M., Waters, L.B.F.M., Molster, F.J. & Justtanont, K. 1998, Ap&SS, 255, 415
- Todini & Ferrara (2001) Todini, P., & Ferrara, A. 2001, MNRAS, 325, 726
- Tumlinson (2006) Tumlinson, J. 2006, ApJ, 641, 1
- Vinkó et al. (2009) Vinkó, J.,Sárneczky, K., Balog, Z. et al. 2009, ApJ, 695, 619
- Wang et al. (2005) Wang, X., Yang, Y., Zhang, T. et al. 2005, ApJ, 626, L89
- Wooden et al. (1993) Wooden, D. H, Rank, D., Bregman, J.D. et al. 1993, ApJS, 88, 477
- Woosley (1988) Woosley, S.E 1988, ApJ, 320, 218
- Woosley & Heger (2007) Woosley, S. E. & Heger, A. 2007, Phys. Rep., 442, 269
- Zachariah & Tsang (1993) Zachariah, M.R. & Tsang, W. 1993, Aerosol Science & Technology, 19, 499 (ZT93)
| Zone | (gas) | C/O | He | C | O | Ne | Mg | Al | Si | S | Ar | Fe | Ni |
|---|---|---|---|---|---|---|---|---|---|---|---|---|---|
| 12 | |||||||||||||
| 1A ( ) | 32.02 | 0.215 | 0 | 9.76(-8) | 6.71(-7) | 3.05(-7) | 7.32(-6) | 1.16(-5) | 2.50(-2) | 2.38(-2) | 3.29(-3) | 4.76(-3) | 3.54(-5) |
| 1B ( ) | 17.38 | 3.68(-4) | 0 | 2.86(-5) | 0.104 | 1.30(-5) | 5.72(-3) | 4.16(-4) | 1.56(-2) | 2.60(-3) | 7.41(-5) | 5.07(-5) | 1.24(-4) |
| 2 ( ) | 17.3 | 7.87(-3) | 0 | 5.46(-4) | 9.24(-2) | 3.50(-2) | 8.68(-3) | 5.60(-4) | 6.02(-4) | 4.20(-5) | 1.19(-5) | 1.29(-4) | 0 |
| 3 ( ) | 15.28 | 0.34 | 0 | 3.04(-2) | 0.118 | 7.36(-3) | 2.72(-3) | 2.08(-4) | 1.47(-4) | 3.52(-5) | 1.42(-5) | 8.16(-5) | 0 |
| 4 ( ) | 4.91 | 15.39 | 0.117 | 3.68(-2) | 3.20-(3) | 2.08(-3) | 8.00(-4) | 9.28(-6) | 1.47(-4) | 4.96(-5) | 1.31(-5) | 1.76(-4) | 0 |
| 5 ( ) | 4.05 | 1.27 | 0.911 | 1.93(-4) | 2.02(-4) | 1.01(-2) | 6.62(-4) | 6.75(-5) | 7.54(-4) | 3.86(-4) | 1.01(-4) | 1.29(-3) | 0 |
| 15 | |||||||||||||
| 1A ( ) | 35.49 | 5.9(-2) | 0 | 1.45(-7) | 3.30(-6) | 0 | 1.39(-5) | 1.98(-5) | 3.19(-2) | 1.96(-2) | 4.02(-3) | 1.65(-2) | 2.80(-4) |
| 1B ( ) | 20.89 | 2.1(-3) | 0 | 6.91(-6) | 4.36(-2) | 1.05(-5) | 3.92(-4) | 4.97(-5) | 3.12(-2) | 1.25(-2) | 7.38(-4) | 1.25(-4) | 1.24(-7) |
| 2 ( ) | 17.17 | 5.50(-3) | 0 | 9.26(-4) | 0.225 | 1.51(-2) | 1.60(-2) | 2.10(-3) | 2.10(-2) | 2.52(-3) | 4.06(-5) | 2.30(-5) | 0 |
| 3 ( ) | 17.12 | 1.60(-2) | 0 | 2.77(-3) | 0.234 | 7.76(-2) | 1.75(-2) | 1.92(-3) | 1.76(-3) | 6.84(-5) | 1.72(-5) | 3.38(-5) | 0 |
| 4A( ) | 14.99 | 0.367 | 6.06(-6) | 4.04(-2) | 0.147 | 2.97(-3) | 1.64(-4) | 2.34(-4) | 7.08(-5) | 3.47(-5) | 9.56(-6) | 2.15(-5) | 0 |
| 4B ( ) | 10.66 | 0.735 | 3.08(-2) | 6.16(-2) | 0.112 | 1.40(-2) | 7.11(-4) | 1.91(-5) | 1.05(-4) | 4.39(-5) | 8.64(-6) | 4.01(-5) | 0 |
| 5 ( ) | 4.14 | 21.3 | 0.705 | 2.72(-2) | 1.66(-3) | 1.19(-3) | 3.86(-4) | 5.25(-5) | 4.84(-4) | 2.91(-4) | 1.20(-5) | 8.40(-4) | 0 |
| 6 ( ) | 4.05 | 1.18 | 0.341 | 9.13(-5) | 9.58(-5) | 5.48(-4) | 1.79(-4) | 2.43(-5) | 2.27(-4) | 1.37(-4) | 5.34(-6) | 4.06(-4) | 0 |
| 19 | |||||||||||||
| 1A ( ) | 35.35 | 0.156 | 1.39(-6) | 8.10(-8) | 6.89(-7) | 0 | 1.69(-5) | 2.46(-5) | 3.77(-2) | 2.26(-2) | 4.52(-3) | 2.47(-2) | 3.25(-4) |
| 1B ( ) | 22.47 | 1.30(-3) | 0 | 1.15(-4) | 0.118 | 1.05(-4) | 8.79(-4) | 2.18(-4) | 9.88(-2) | 5.59(-2) | 1.54(-2) | 3.10(-3) | 6.19(-6) |
| 2 ( ) | 16.89 | 6.54(-2) | 0 | 5.92(-2) | 1.16 | 0.34 | 8.41(-2) | 9.12(-3) | 1.51(-2) | 1.28(-3) | 1.21(-4) | 7.54(-4) | 0 |
| 3 ( ) | 15.11 | 0.36 | 0 | 2.89(-2) | 0.107 | 2.81(-3) | 2.01(-3) | 1.63(-5) | 1.11(-4) | 3.19(-5) | 8.94(-6) | 7.82(-5) | 0 |
| 4 ( ) | 10.32 | 0.64 | 7.68(-2) | 0.126 | 0.263 | 1.32(-2) | 5.44(-3) | 5.30(-5) | 3.75(-4) | 1.40(-4) | 3.47(-5) | 3.76(-4) | 0 |
| 5 ( ) | 4.12 | 3.93 | 0.743 | 1.27(-2) | 4.30(-3) | 1.07(-2) | 5.01(-4) | 5.99(-5) | 5.53(-4) | 3.21(-4) | 7.04(-5) | 9.83(-4) | 0 |
| 6 ( ) | 4.06 | 1.8 | 0.352 | 1.26(-4) | 9.24(-5) | 5.69(-4) | 2.27(-4) | 3.19(-5) | 2.55(-4) | 1.50(-4) | 3.32(-5) | 4.55(-4) | 0 |
| 25 | |||||||||||||
| 1A ( ) | 34.26 | – | 2.91(-6) | 0 | 0 | 0 | 4.91(-5) | 4.80(-5) | 8.92(-2) | 5.15(-2) | 9.93(-3) | 3.20(-2) | 5.43(-4) |
| 1B ( ) | 26.18 | 4.03(-4) | 0 | 8.18(-6) | 2.84(-2) | 1.71(-5) | 5.90(-5) | 6.46(-5) | 8.87(-2) | 4.34(-2) | 8.53(-3) | 3.81(-4) | 1.36(-6) |
| 2 ( ) | 19.34 | 4.18(-4) | 0 | 8.70(-5) | 0.278 | 6.07(-5) | 7.22(-3) | 6.95(-4) | 0.116 | 3.74(-2) | 9.17(-3) | 1.32(-4) | 0 |
| 3 ( ) | 17.01 | 2.32(-2) | 0 | 4.3(-2) | 1.95 | 0.44 | 0.129 | 2.12(-2) | 5.81(-2) | 8.29(-3) | 1.09(-3) | 1.20(-4) | 0 |
| 4A ( ) | 15.04 | 0.33 | 0 | 0.102 | 0.406 | 5.03(-3) | 3.02(-4) | 7.15(-5) | 1.76(-4) | 8.94(-5) | 3.16(-5) | 3.95(-5) | 0 |
| 4B ( ) | 12.40 | 0.49 | 6.17(-2) | 0.231 | 0.525 | 4.64(-2) | 2.61(-3) | 1.36(-4) | 3.18(-4) | 1.40(-4) | 4.98(-5) | 7.56(-5) | 0 |
| 5 ( ) | 4.05 | 35.9 | 0.919 | 1.30(-2) | 4.82(-4) | 1.50(-3) | 4.78(-4) | 7.21(-5) | 6.08(-4) | 3.62(-4) | 8.61(-5) | 1.00(-3) | 0 |
| 6 ( ) | 4.05 | 1.57 | 0.232 | 6.89(-5) | 5.83(-5) | 3.71(-4) | 1.22(-4) | 1.77(-5) | 1.54(-4) | 9.35(-5) | 2.13(-5) | 2.76(-4) | 0 |
| 15 | Zone 1A | Zone 1B | Zone 2 | Zone 3 | Zone 4A | Zone 4B | Zone 5 | |||||||
|---|---|---|---|---|---|---|---|---|---|---|---|---|---|---|
| Time (days) | T | ngas | T | ngas | T | ngas | T | ngas | T | ngas | T | ngas | T | ngas |
| 100 | 12000 | 1.8(11) | 11600 | 3.1(11) | 10400 | 3.7(11) | 8779 | 3.8(11) | 7980 | 4.3(11) | 7580 | 6.1(11) | 6490 | 1.6(12) |
| 300 | 3006 | 6.7(9) | 2906 | 1.1(10) | 2605 | 1.4(10) | 2199 | 1.4(10) | 1998 | 1.6(10) | 1899 | 2.3(10) | 1626 | 5.9(10) |
| 600 | 1255 | 8.3(8) | 1213 | 1.4(9) | 1088 | 1.7(9) | 918 | 1.8(9) | 835 | 2.0(9) | 793 | 2.8(9) | 679 | 7.4(9) |
| 900 | 753 | 2.5(8) | 728 | 4.3(8) | 653 | 5.1(8) | 551 | 5.2(8) | 501 | 5.9(8) | 476 | 8.4(8) | 407 | 2.2(9) |
| 1200 | 524 | 1.0(8) | 507 | 1.8(8) | 454 | 2.1(8) | 383 | 2.2(8) | 349 | 2.5(8) | 331 | 3.5(8) | 283 | 9.3(8) |
| 1500 | 396 | 5.3(7) | 382 | 9.2(7) | 343 | 1.1(8) | 289 | 1.1(8) | 263 | 1.3(8) | 250 | 1.8(8) | 214 | 4.7(8) |
| Elements | |||||||||
|---|---|---|---|---|---|---|---|---|---|
| O | Si | S | C | Mg | Al | Fe | He | Ne | Ar |
| Ions | |||||||||
| O+ | Si+ | S+ | C+ | Mg+ | Al+ | Fe+ | He+ | Ne+ | Ar+ |
| SiO+ | CO+ | O | SO+ | ||||||
| Molecules | |||||||||
| O2 | CO | SiO | SO | NO | AlO | FeO | MgO | CO2 | |
| CN | CS | SiS | SiC | FeS | MgS | S2 | N2 | ||
| Clusters | |||||||||
| C2 | C3 | C4 | C5 | C6 | C7 | C8 | C9 | C10 | |
| Si2 | Si3 | Si4 | Mg2 | Mg3 | Mg4 | Fe2 | Fe3 | Fe4 | |
| Si2C2 | Mg2S2 | Mg3S3 | Mg4S4 | Fe2S2 | Fe3S3 | Fe4S4 | |||
| Si2O2 | Si3O3 | Si4O4 | Si5O5 | SiO2 | Si2O3 | Si3O4 | Si4O5 | ||
| MgSi2O3 | MgSi2O4 | Mg2Si2O4 | Mg2Si2O5 | Mg2Si2O6 | Mg3Si2O6 | Mg3Si2O7 | Mg4Si2O7 | Mg4Si2O8 | |
| Mg2O2 | Mg3O3 | Mg4O4 | Fe2O2 | Fe3O3 | Fe4O4 | ||||
| Ejected zones | Zone 1A | Zone 1B | Zone 2 | Zone 3 | Zone 4A | Zone 4B | Zone 5 | Zone 6 | Total |
|---|---|---|---|---|---|---|---|---|---|
| Zone Mass() | 9.6(-2) | 9.5(-2) | 0.292 | 0.347 | 0.195 | 0.225 | 0.75 | 0.347 | 2.35 |
| Major Elements | Si/S/Fe | Si/O | O/Mg/Si | O/Ne/Mg | O/C | He/O/C | He/C | He/N | |
| MOLECULES () = 0.075 ) | |||||||||
| SiO | 4.4(-7) | 3.0(-7) | 4.4(-7) | 1.3(-7) | 3.1(-8) | 2.0(-8) | … | … | 1.4(-6) |
| … | 2.8(-5) | 0.15 | 0.16 | 6.2(-2) | 4.9(-3) | … | … | 0.38 | |
| CO | 7.5(-7) | 1.7(-5) | 2.2(-3) | 6.6(-3) | 9.5(-2) | 0.14 | 2.9(-3) | … | 0.25 |
| SO | … | 1.5(-2) | 3.8(-3) | 1.0(-4) | 1.1(-4) | … | … | … | 1.9(-2) |
| SiS | 4.3(-2) | 2.1(-7) | … | … | … | … | … | … | 4.3(-2) |
| Total Mass() | 4.3(-2) | 1.5(-2) | 0.156 | 0.167 | 0.157 | 0.145 | 2.9(-3) | 0 | 0.69 |
| Efficiency | 44.8% | 15.8% | 53.4% | 48.1% | 80.5% | 64.7% | 0.4% | 0% | 29.4% |
| DUST () = 0.075 ) | |||||||||
| Forsterite | … | 5.3(-4) | 4.4(-3) | 5.9(-4) | 2.7(-5) | 2.5(-5) | … | … | 5.6(-3) |
| Silica | … | 6.0(-5) | 5.1(-5) | … | … | … | … | … | 1.1(-4) |
| Alumina | … | 1.2(-5) | 4.0(-3) | 3.7(-3) | 4.5(-5) | 3.5(-5) | … | … | 7.8(-3) |
| Pure Iron | 1.2(-4) | … | … | … | … | … | … | … | 1.2(-4) |
| Iron Sulfide | 2.1(-6) | … | … | … | … | … | … | … | 2.1(-6) |
| Pure Silicon | 3.9(-4) | … | … | … | … | … | … | … | 3.9(-4) |
| Pure Magnesium | … | … | 2.2(-4) | 2.5(-4) | … | … | … | … | 4.7(-4) |
| Carbon | … | … | … | … | … | … | 2.3(-2) | … | 2.3(-2) |
| Silicon Carbide | … | … | … | … | … | … | 6.1(-4) | … | 6.1(-4) |
| Total Mass() | 5.1(-4) | 6.0(-4) | 8.7(-3) | 4.5(-3) | 7.2(-5) | 6.0(-5) | 2.4(-2) | … | 0.038 |
| Efficiency(%) | 0.53% | 0.63% | 3.0% | 1.3% | 3.7(-2)% | 2.7(-2)% | 3.2% | … | 1.62% |
| MOLECULES () = 0.01 ) | |||||||||
| SiO | 3.8(-7) | 2.1(-7) | 4.3(-7) | 1.3(-7) | 3.1(-8) | 2.0(-8) | … | … | 1.2(-6) |
| … | 3.4(-4) | 0.16 | 0.18 | 6.8(-2) | 8.3(-3) | … | … | 0.42 | |
| CO | 7.6(-7) | 1.7(-5) | 2.2(-3) | 6.6(-3) | 9.5(-2) | 0.14 | 2.8(-3) | … | 0.25 |
| SO | … | 1.9(-2) | 3.9(-3) | 1.0(-4) | 8.0(-5) | … | … | … | 2.3(-2) |
| SiS | 4.3(-2) | 4.0(-7) | … | … | … | … | … | … | 4.3(-2) |
| Total Mass() | 4.3(-2) | 1.9(-2) | 0.166 | 0.187 | 0.163 | 0.15 | 2.8(-3) | 0 | 0.73 |
| Efficiency | 44.8% | 20.0% | 56.8% | 53.9% | 83.6% | 66.7% | 0.4% | 0% | 31.1% |
| DUST () = 0.01 ) | |||||||||
| Forsterite | … | 6.7(-4) | 2.3(-2) | 1.8(-3) | 1.2(-4) | 7.2(-5) | … | … | 2.6(-2) |
| Silica | … | 6.0(-5) | 4.1(-5) | … | … | … | … | … | 1.1(-4) |
| Alumina | … | 6.4(-5) | 4.0(-3) | 3.7(-3) | 4.5(-5) | 3.5(-5) | … | … | 7.9(-3) |
| Pure Iron | 1.2(-4) | … | … | … | … | … | … | … | 1.2(-4) |
| Iron Sulfide | 3.1(-6) | … | … | … | … | … | … | … | 3.1(-6) |
| Pure Silicon | 3.8(-4) | … | … | … | … | … | … | … | 3.8(-4) |
| Pure Magnesium | … | … | 6.8(-5) | 3.4(-4) | … | … | … | … | 4.1(-4) |
| Carbon | … | … | … | … | … | … | 2.4(-2) | … | 2.4(-2) |
| Silicon Carbide | … | … | … | … | … | … | 5.0(-4) | … | 5.0(-4) |
| Total Mass() | 5.0(-4) | 7.9(-4) | 2.7(-2) | 5.8(-3) | 1.7(-4) | 1.1(-4) | 2.4(-2) | … | 0.059 |
| Efficiency | 0.52% | 0.83% | 9.2% | 1.7% | 8.7(-2)% | 4.9(-2)% | 3.2% | … | 2.5% |
| Name | 56Ni mass | Low Limit | High Limit | Reference |
|---|---|---|---|---|
| SN1999em | 0.02 | 12 | 14 | Elmhamdi et al. (2003a) |
| SN2003gd | 0.016 | 8 | 12 | Smartt et al. (2004); Hendry et al. (2005) |
| SN2004dj | 0.095 | 12 | 20 | Wang et al. (2005); Vinkó et al. (2009) |
| SN2004et | 0.068 | 23 | 25 | Kotak et al. (2009) |
| SN2005af | 0.027 | 13 | 15 | Kotak et al. (2006) |
| SN2005cs | 0.003 | 10 | 15 | Pastorello et al. (2009) |
| SN2007od | 0.02 | 10 | 11 | Andrews et al. (2011); Inserra et al. (2011) |
| SN2009bw | 0.022 | 11 | 15 | Inserra et al. (2012) |
| SN2009js | 0.007 | 6 | 16 | Gandhi et al. (2013) |
| SN2011htaaA high-mass progenitor ( 25 ) with substantial fallback of the ejecta is also possible for this object | 0.01 | 8 | 10 | Mauerhan et al. (2012) |
| SN remnants | ||||
| SN1987A | 0.075 | 14 | 20 | Woosley (1988), Smartt (2009) |
| Cas A | – | 18 | 20 | Krause et al. (2008) |
| The Crab | – | 8 | 12 | Davidson & Fesen (1985); MacAlpine & Satterfield (2008) |
| Ejected zones | Zone 1A | Zone 1B | Zone 2 | Zone 3 | Zone 4 | Zone 5 | Zone 6 | Total |
|---|---|---|---|---|---|---|---|---|
| Zone Mass() | 0.11 | 0.302 | 1.68 | 0.141 | 0.486 | 0.774 | 0.358 | 3.85 |
| Major Elements | Si/S/Fe | Si/O | O/Ne/Mg | O/C | He/O/C | He/C | He/N | |
| MOLECULES | ||||||||
| SiO | 3.9(-7) | 2.0(-7) | 1.9(-6) | 7.9(-9) | 7.2(-9) | … | … | 2.5(-6) |
| O2 | … | 1.0(-5) | 0.69 | 4.7(-2) | 3.4(-2) | … | … | 0.77 |
| CO | 1.5(-8) | 2.7(-4) | 0.13 | 6.7(-2) | 0.29 | 7.2(-3) | … | 0.50 |
| SO | … | 2.3(-2) | 1.9(-3) | 1.4(-4) | 1.0(-7) | … | … | 2.5(-2) |
| SiS | 4.4(-2) | 8.6(-5) | … | … | … | … | … | 4.4(-2) |
| Total Mass() | 4.4(-2) | 2.3(-2) | 0.82 | 0.115 | 0.29 | 7.2(-3) | 0 | 1.33 |
| Efficiency | 40.0% | 7.6% | 48.8% | 81.6% | 59.7% | 0.93% | 0% | 33.9% |
| DUST | ||||||||
| Forsterite | … | 1.7(-3) | 6.5(-3) | 1.6(-4) | 2.5(-4) | … | … | 8.6(-3) |
| Silica | … | 3.0(-4) | 2.3(-4) | … | … | … | … | 5.3(-4) |
| Alumina | … | 8.5(-6) | 1.79(-2) | 3.1(-5) | 1.0(-4) | … | … | 1.8(-2) |
| Pure Iron | 2.0(-4) | … | … | … | … | … | … | 2.0(-4) |
| Iron Sulfide | 5.4(-8) | … | … | … | … | … | … | 5.4(-8) |
| Pure Silicon | 3.6(-4) | … | … | … | … | … | … | 3.6(-4) |
| Pure Magnesium | … | … | 9.9(-4) | … | … | … | … | 9.9(-4) |
| Carbon | … | … | … | … | … | 5.5(-3) | … | 5.5(-3) |
| Silicon Carbide | … | … | … | … | … | 2.6(-4) | … | 2.6(-4) |
| Total Mass() | 5.6(-4) | 2.0(-3) | 2.6(-2) | 1.9(-4) | 3.5(-4) | 5.8(-3) | 0 | 0.035 |
| Efficiency | 0.51% | 0.66% | 1.6% | 0.13% | 7.2(-2)% | 0.71% | 0% | 0.91% |
| Ejected zones | Zone 1A | Zone 1B | Zone 2 | Zone 3 | Zone 4A | Zone 4B | Zone 5 | Zone 6 | Total |
|---|---|---|---|---|---|---|---|---|---|
| Zone Mass() | 0.233 | 0.181 | 0.463 | 2.72 | 0.526 | 0.89 | 0.956 | 0.236 | 6.21 |
| Major Elements | Si/S/Fe | Si/O/S | O/Mg/Si | O/Ne/Mg | O/C | He/O/C | He/C | He/N | |
| MOLECULES | |||||||||
| SiO | 5.5(-8) | 2.3(-7) | 1.3(-7) | 1.2(-6) | 2.5(-7) | 3.9(-7) | … | … | 2.2(-6) |
| … | … | 0.10 | 1.4 | 0.18 | 7.5(-2) | … | … | 1.76 | |
| CO | … | 2.0(-5) | 2.1(-4) | 7.9(-2) | 0.24 | 0.54 | 7.6(-4) | … | 0.86 |
| SO | … | 1.9(-7) | 5.6(-2) | 1.2(-2) | 2.7(-4) | … | … | … | 6.8(-2) |
| SiS | 0.12 | 1.6(-2) | 1.5(-6) | … | … | … | … | … | 0.1 |
| Total Mass () | 0.12 | 1.6(-2) | 0.156 | 1.49 | 0.42 | 0.62 | 7.6(-4) | 0 | 2.82 |
| Efficiency(%) | 51.5 % | 8.9 % | 33.6 % | 54.8 % | 79.8 % | 70.7 % | 7.9(-2) % | 45.4% | |
| DUST | |||||||||
| Forsterite - Mg2SiO4 | … | 1.6(-5) | 1.9(-2) | 1.2(-2) | 1.1(-4) | 1.8(-4) | … | … | 3.2(-2) |
| Silica - SiO2 | … | … | 3.1(-4) | 6.0(-4) | … | … | … | … | 9.1(-4) |
| Alumina - Al2O3 | … | 1.3(-3) | 3.9(-2) | 1.3(-4) | 2.6(-4) | 3.5(-5) | … | … | 4.1(-2) |
| Pure Iron - Fe | 5.7(-4) | … | … | … | … | … | … | … | 5.7(-4) |
| Iron Sulfide - FeS | 6.6(-7) | … | … | … | … | … | … | … | 6.6(-7) |
| Pure Silicon - Si | 2.5(-3) | … | … | … | … | … | … | … | 2.5(-3) |
| Pure Magnesium - Mg | … | … | … | 2.2(-3) | … | … | … | … | 2.2(-3) |
| Carbon - C10 | … | … | … | … | … | … | 1.0(-2) | … | 1.0(-2) |
| Silicon Carbide - SiC | … | … | … | … | … | … | 8.2(-4) | … | 8.2(-4) |
| Total Mass () | 3.1(-3) | 1.4(-3) | 5.8(-2) | 1.5(-2) | 3.7(-4) | 2.2(-4) | 1.1(-3) | 0 | 0.09 |
| Efficiency | 1.33 % | 0.77 % | 12.5 % | 0.55 % | 7.0(-2) % | 2.5(-2) % | 0.11 % | 1.3 % | |
| Ejected zones | Zone 1A | Zone 1B | Zone 2 | Zone 3 | Zone 4 | Zone 5 | Total |
|---|---|---|---|---|---|---|---|
| Zone Mass() | 6.1(-2) | 0.13 | 0.14 | 0.16 | 0.16 | 0.92 | 1.57 |
| Major Elements | Si/S/Fe | Si/O | O/Ne/Mg | O/C | He/C | He/N | |
| MOLECULES | |||||||
| SiO | 3.0(-8) | 5.7(-8) | 6.0(-8) | 7.0(-8) | … | … | 2.2(-7) |
| O2 | … | 6.8(-2) | 6.4(-2) | 4.9(-2) | … | … | 0.18 |
| CO | 2.4(-7) | 6.5(-5) | 1.2(-3) | 7.0(-2) | 5.5(-3) | … | 7.7(-2) |
| SO | … | 3.9(-3) | 6.2(-5) | 5.5(-9) ) | … | … | 4.0(-3) |
| SiS | 4.7(-2) | … | … | … | … | … | 4.7(-2) |
| Total Mass () | 4.7(-2) | 7.2(-2) | 6.5(-2) | 0.12 | 5.5(-3) | 0 | 0.31 |
| Efficiency | 77 % | 55.4 % | 46.4 % | 75 % | 3.4 % | 19.7 % | |
| DUST | |||||||
| Forsterite - Mg2SiO4 | … | 1.2(-2) | 2.9(-4) | 2.2(-4) | … | … | 1.3(-2) |
| Enstatite - MgSiO3 | |||||||
| Silica - SiO2 | … | 5.2(-6) | 5.0(-6) | … | … | … | 1.2(-5) |
| Alumina - Al2O3 | … | 7.9(-4) | 1.03(-3) | 3.9(-4) | … | … | 2.2(-3) |
| Pure Iron - Fe | 2.3(-5) | … | … | … | … | … | 2.3(-5) |
| Iron Sulfide - FeS | 1.0(-7) | … | … | … | … | … | 1.0(-7) |
| Pure Silicon - Si | 8.3(-5) | … | … | … | … | … | 8.3(-5) |
| Pure Magnesium - Mg | … | 8.1(-6) | 1.6(-4) | … | … | … | 1.7(-4) |
| Carbon - C10 | … | … | … | … | 3.3(-2) | … | 3.3(-2) |
| Silicon Carbide - SiC | … | … | … | … | 5.0(-6) | … | 5.0(-6) |
| Total Mass () | 1.1(-4) | 1.3(-2) | 1.5(-3) | 6.1(-4) | 3.3(-2) | 0 | 0.048 |
| Efficiency | 0.2% | 10 % | 1.1 % | 0.4 % | 20.6 % | 3.1 % | |
| Model | Z | Fully Mixed | Progenitor | Dust Condensation-Time Sequence | Total Dust |
|---|---|---|---|---|---|
| or Unmixed | Mass | Mass | |||
| Kozasa et al. | Solar | FM | 19 | Al2O3–Mg2SiO4–Fe3O4 | – |
| (1989) | Solar | U | 19 | Graphite | – |
| Kozasa et al. | Solar | U | 15 | AC–Al2O3–Mg2SiO4 & MgSiO3–SiO2–Fe3O4–MgO–Si–FeS–Fe | 0.33 |
| (2009) | Solar | U | 20 | – | 0.68 |
| Todini & Ferrara | Solar | FM | 12 | – | 0.20 |
| (2001) | Solar | FM | 15 | – | 0.45 |
| Solar | FM | 20 | AC–Al2O3–Fe3O4–Mg2SiO4–MgSiO3 | 0.70 | |
| Solar | FM | 25 | – | 1.00 | |
| 0 | FM | 15 | AC–Al2O3–Fe3O4–Mg2SiO4–MgSiO3 | 0.45 | |
| 0 | FM | 20 | AC | 0.08 | |
| 0 | FM | 25 | AC | 0.08 | |
| Nozawa et al. | 0 | FM | 20 | Al2O3–Mg2SiO4–SiO2–Fe3O4 | 0.73 |
| (2003) | 0 | U | 20 | AC–Al2O3–Mg2SiO4–MgO–SiO2–Si–FeS–Fe | 0.57 |
| Bianchi & Schneider | Solar | FM | 12 | – | 0.12 |
| (2007) | Solar | FM | 15 | – | 0.28 |
| Solar | FM | 20 | AC–Al2O3–Mg2SiO4–SiO2–Fe3O4–MgSiO3 | 0.40 | |
| Solar | FM | 25 | – | 0.62 | |
| Cherchneff & Dwek b,cb,cfootnotemark: | 0 | FM | 20 | Mg–Si/Fe–SiO2–Al2O3 | 0.16 |
| (2010) | 0 | U | 20 | Al2O3–SiO2–MgO–FeS–Si–Mg/Fe–AC | 0.10 |
| Sarangi & Cherchneff bbThe dust mass is derived from assuming 100 % condensation of the dust clusters in grains. Mass values are then upper limits to the total dust masses that form in the ejecta. | Solar | U | 12 | Al2O3–Mg2SiO4–SiO2–Si/Mg/Fe–AC/SiC | 0.048 |
| (this paper) | Solar | U | 15 | Mg2SiO4/SiO2–FeS–Al2O3–Si–Fe–AC/SiC | 0.038 |
| Solar | U | 19 | Mg2SiO4–SiO2–Mg–Si–Fe–Al2O3–AC/SiC | 0.035 | |
| Solar | U | 25 | Mg2SiO4–SiO2–Si–Al2O3–FeS–Fe/Mg–AC/SiC | 0.09 |