A method to rescale experimental data with dependence on for DVCS process
Abstract
We investigate the procedure for rescaling the DVCS cross section data collected with different invariant mass, , of the virtual photon - proton system. We suggest a method which makes the rescaling more functional to conduct statistical analysis on overall data. The study can be applied to rescale data collected with different photon virtuality . Also we show a dependence on for the parameter, that is used to describe the cross section as a function of .
DVCS; Rescaling
1 Introduction
The models used to interpret the Deeply Virtual Compton Scattering (DVCS) process, , are compared with an overall set of experimental results. This is obtained from several data sets collected at different energies. The DVCS is the diffractive scattering of a virtual photon () off a proton (p), i.e. where denotes the outgoing photon. The integrated cross section can be written [1] as a simple function:
| (1) |
where is the invariant mass of the system and is the virtuality of the photon. and are parameters obtained from fits to experimental data, by keeping fixed respectively the -value or the -value. The overall set of experimental results is given by a procedure which rescales the DVCS cross section measurements from an experiment to the kinematics of another experiment. This is possible by applying some factors that are used also for the error analysis. As example, the ZEUS Collaboration [2] data, taken at and , are rescaled to the H1 Collaboration [1] data, taken at and , with and respectively fixed to values and [3]. In this case, the procedure for rescaling depends on the definition of appropriate normalization factors, which here are indicated with . In particular, represents the normalization factor when we consider the cross section, , as a function of with fixed ; represents the normalization factor when we consider the cross section, , as a function of with fixed . By using the Eq. (1) we have
| (2) |
| (3) |
where the subscripts “”, “” and “” respectively denote the data to be rescaled, those considered in scale and the rescaled data. The previous relations allow us to obtain the following formulas:
| (4) |
| (5) |
In the “standard” procedure the equalities and are considered valid [3], whereby the normalization factor , for , is given by the ratio between and and the normalization factor , for , is given by the ratio between and . If we consider and [1], the ZEUS cross sections are rescaled to H1 ones through following expressions:
| (6) |
| (7) |
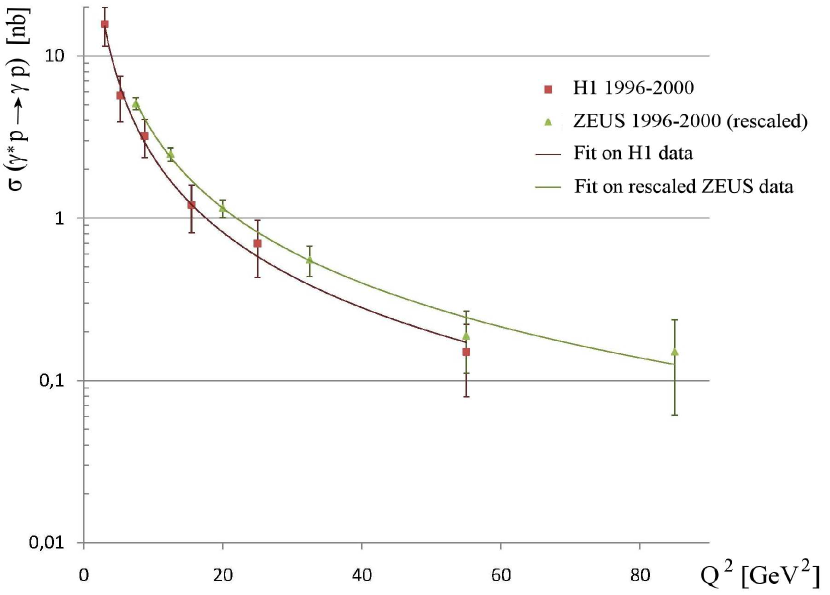
As shown in Fig. 1, where we illustrate the effect of the procedure for rescaling the cross section as function of , the rescaled ZEUS data are roughly moved over the H1 data. To highlight this feature, we fit lines to data so that it catches the general trend of the two data series and we can compare the trends of two data sets.
2 New procedure
From analysis of the two fits shown in Fig. 1, it is found that the rescaled ZEUS data tend to remain higher than those of H1; therefore it seems that the “standard” procedure above described does not rescale the ZEUS experimental data to those of H1. In particular, data points for are not superimposed, although they are consistent within the error bars. Indeed, we would expect that, after rescaling, the data will be superimposed when they refer to the same value of . In this regard, we might consider an alternative rescaling procedure by normalizing the ZEUS data to those of H1 and using the following normalization factor:
| (8) |
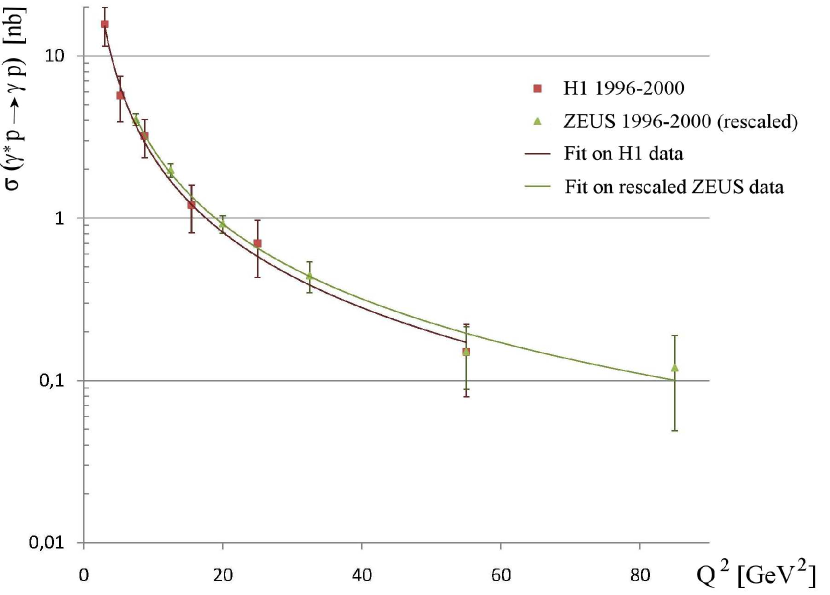
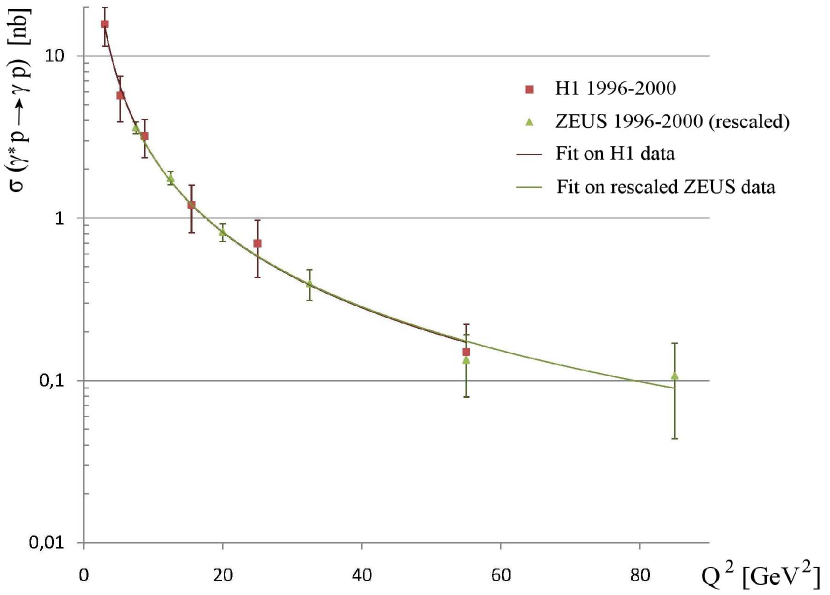
where and are the cross section values measured by ZEUS and H1 experiments at the same value of . Fig. 2 shows the ZEUS data rescaled according to Eq. (8). As seen in the previous figures, the changing of normalization factor has given a better approximation of rescaled ZEUS data to those of H1. However, from Fig. 2 it is clear that it is not possible to conduct statistical analysis on overall data. In the current study we suggest that the rescaling procedure should be based on a a comparison of the trend determined by fit to the rescaled ZEUS data with the trend determined by fit to the H1 data, i.e. the characteristic parameters of both fits must have similar values since the fitting curves must be close to each other. This observation is physically correct because the process is the same for both Collaborations, although the data are collected at different and values. In effect, if the ZEUS and H1 data were taken at the same energies, we would expect similar values for the characteristic parameters of the fits. This consideration is the basis of any rescaling procedure. Also to avoid experimenter’s bias, we suggest to consider the trend of the fits to the data rather than data points itself. Therefore it is necessary to redefine another normalization factor, which we indicate with . The latter can be determined by varying the value of until there is good agreement on characteristic parameters of fits, as previously highlighted. So we find , value for which the parameters of fits describe the same curve as the Fig. 3 shows. In this case, the fit on overall data gives a -value compatible with that obtained by the H1 Collaboration, i.e. [1], where the first error is statistical, the second systematic.
3 New normalization factor for fixed
Adopting the following power-type function
| (9) |
and by performing a fit on H1 data, we have and , with reduced chi-square ; these parameters are compatible with those calculated by performing a fit on the rescaled ZEUS data using factor: and , with . Furthermore, if we use the factor for the rescaling procedure, the fit on rescaled ZEUS data gives , which is inconsistent with . Hence we must introduce the factor and reject the standard procedure. It’s possible to move from to by applying the following formula:
| (10) |
where we introduce the factor . This one may show a dependence which could not be considered taking only the factor . The value of is found from Eq. (10):
| (11) |
We might ask if can be determined using the ratio between the energies with which the H1 and ZEUS Collaborations have performed their measurements. Actually this event happens when we raise the ratio to the fourth power:
| (12) |
Hence, in order to make the rescaling procedure more efficient in statistical terms, it is necessary to replace with the following normalization factor:
| (13) |
where we use [1]. Since the value is approximately equal to , the curve in Fig. 3 represents approximately the fit of the power function to ZEUS data rescaled by the factor. If we fit the overall data using the function of Eq. 9, we obtain and , with ; these parameters are clearly compatible with those obtained by the fit to the H1 data.
4 Method for rescaling the DVCS data collected at different energies
Introducing the following function
| (14) |
Eq. (1) can be written as
| (15) |
whereby, according the rescaling procedure here proposed, we have to carry out the ratio between the quantities and :
| (16) |
| (17) |
In general, the differential cross section for the DVCS process, , can be expressed at high energies [4] as
| (18) |
where the variable is the square of the four-momentum transferred at the proton vertex, is the squared centre-of-mass energy of the incoming system, i.e. , and is the DVCS amplitude. If the dependence of the integrated cross section is the same, over the relevant domain, as the dependence of the differential cross section111See footnote 14 of Ref. [5]. for , then the cross section can be expressed, as indicated in Eq. 15, in terms of . These considerations suggest that the function is proportional to the integrated squared modulus of the DVCS amplitude. Therefore, according the Eq. 16 and Eq. 17, the ZEUS measurements can be rescaled to the values of the H1 measurements by performing the ratio between the integrated squared modula of scattering amplitudes of the process studied in H1 and ZEUS experiments. Thus, it is interesting to note that the rescaling procedure depends essentially on the scattering amplitudes and that these latter contain all the information about the dynamics of the process.
5 Dependence of parameter on
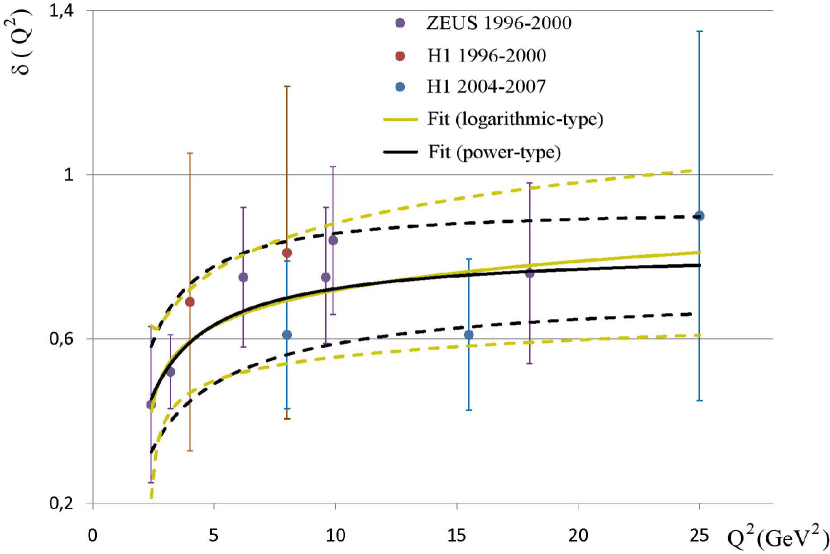
In Table 1 we have collected the -values calculated by ZEUS and H1 experiments [1, 2, 6, 7]. Taking account that several values do not lie within the error bars of other values, we consider the possibility of treating the -parameter as function of , contrary to what is given in literature which states that is independent of within the errors [7]. All the functions used to fit data of Table 1 exhibit a similar trend222Through OriginPro 8 we identified 23 functions able to fit the experimental data of Table 1 with a reduced chi-square value ranging from to . Here we want to show that is dependent by ; nevertheless, we are not so interested to statistically analyze the data, but our interest is to check, also by ‘eye’, whether the dependence is actual. especially for low values of . In Fig. 4 two fits are shown: one is logarithmic-type, another one is power-type. The logarithmic-type curve is given by the following equation:
| (19) |
where , and , with ; the power-type curve is given by the following equation:
| (20) |
where and , with . Since is treated as a function of , we have that the factor depends on :
| (21) |
Figure 5 shows the trend determined by fit to the ZEUS data, which are rescaled by using Eq. (21) and Eq. (19). This trend is superimposed to that determined by fit to the H1 data. In effect, by performing a fit to the rescaled ZEUS data, we have and , with ; these parameters are compatible with and obtained by performing a fit to the H1 data. It is interesting to note that the trends overlap although the visible dependence of on has introduced a dependence of on in an independent manner with respect to the rescaling analysis conducted in Sec. 3. Clearly, the growth, at low , and the flattening, at high , of do not fundamentally modify the rescaling procedure proposed in this paper.
6 Conclusion
Through the analysis conducted here, it appears that at fixed the ZEUS data [2] may be rescaled to H1 ones [1] by using , i.e. by applying Eq. (21) where the -parameter is dependent on . The Eq. (15) shows that the new rescaling procedure is consistent with the theoretical framework, as mentioned in Sec. 4. Therefore, the procedure may be implemented to find a suitable formula to rescale the data taken at different . Then it will be useful to consider as a function of , in order to better define its behavior. The results obtained by the adoption of the new rescaling procedures will be collected and used in future works, where we will present a phenomenological model of the DVCS process.
Acknowledgements
The results here presented were discussed at the earlier stage of this contribution with R. Fiore who is gratefully acknowledged. Thanks are due to G. Nicastro and V. Pingitore for the help in preparation of the manuscript. Special thanks to A. Papa for his invaluable advice and encouragement. The autor is grateful to his family for moral and financial support during this work.
References
References
- [1] A. Aktas, et al., Measurement of deeply virtual Compton scattering at HERA, Eur. Phys. J. C 44 (2005) 1–11. arXiv:hep-ex/0505061, doi:10.1140/epjc/s2005-02345-3.
- [2] S. Chekanov, et al., Measurement of deeply virtual Compton scattering at HERA, Phys. Lett. B 573 (2003) 46–62. arXiv:hep-ex/0305028, doi:10.1016/j.physletb.2003.08.048.
- [3] V. Guzey, M. V. Polyakov, Dual parameterization of generalized parton distributions and description of DVCS data, Eur. Phys. J. C 46 (2006) 151–156. arXiv:hep-ph/0507183, doi:10.1140/epjc/s2006-02491-0.
- [4] V. Barone, E. Predazzi, High-energy particle diffraction, Berlin, Germany: Springer (2002) 407 p.
- [5] C. Adloff, et al., Elastic electroproduction of rho mesons at HERA, Eur. Phys. J. C 13 (2000) 371–396. arXiv:hep-ex/9902019, doi:10.1007/s100520050703.
- [6] S. Chekanov, et al., A measurement of the , and dependences of deeply virtual Compton scattering at HERA, JHEP 05 (2009) 108. arXiv:hep-ex/0812.2517, doi:10.1088/1126-6708/2009/05/108.
- [7] F. D. Aaron, et al., Deeply Virtual Compton Scattering and its Beam Charge Asymmetry in Collisions at HERA, Phys. Lett. B 681 (2009) 391–399. arXiv:hep-ex/0907.5289, doi:10.1016/j.physletb.2009.10.035.
| Reference | ||
|---|---|---|
| ZEUS 1999-2000 [6] | ||
| ZEUS 1999-2000 [6] | ||
| H1 1996-1997 [1] | ||
| ZEUS 1996-2000 [6] | ||
| H1 1999-2000 [1] | ||
| H1 2004-2007 [7] | ||
| ZEUS 1996-2000 [2] | ||
| ZEUS 1996-2000 [6] | ||
| H1 2004-2007 [7] | ||
| ZEUS 1996-2000 [6] | ||
| H1 2004-2007 [7] |
Figure Captions
Figure 1
DVCS cross section ) as function of for (, where is the four momentum transfer squared at the proton vertex). The error bars represent the statistical and systematic uncertainties added in quadrature. The experimental data collected by the ZEUS Collaboration [2] have been rescaled to those collected by the H1 Collaboration [1] using Eq. (7), where .
Figure 2
DVCS cross section ) as function of for (). The error bars represent the statistical and systematic uncertainties added in quadrature. The experimental data collected by the ZEUS Collaboration [2] have been rescaled to those collected by the H1 Collaboration [1] using the normalization factor determined by Eq. (8).
Figure 3
DVCS cross section ) as function of for (). The error bars represent the statistical and systematic uncertainties added in quadrature. The experimental data collected by the ZEUS Collaboration [2] have been rescaled to those collected by the H1 Collaboration [1] using the normalization factor determined in Sec. 2.
Figure 4
parameter as a function of . The experimental values are given in Table 1. Two fits are shown. The dotted lines indicate the error bands.
Figure 5
DVCS cross section ) as function of for (). The error bars represent the statistical and systematic uncertainties added in quadrature. The experimental data collected by the ZEUS Collaboration [2] have been rescaled to those collected by the H1 Collaboration [1] using Equations (21) and (19).