Precision and reproducibility of macroscopic developmental patterns
Abstract
Developmental processes in multicellular organisms occur far from equilibrium, yet produce complex patterns with astonishing reproducibility. We measure the precision and reproducibility of bilaterally symmetric fly wings across the natural range of genetic and environmental conditions and find that wing patterns are specified with identical spatial precision and are reproducible to within a single cell width. The early fly embryo operates at a similar degree of reproducibility, suggesting that the overall spatial precision of morphogenesis in Drosophila performs at the single cell level, arguably the physical limit of what a biological system can achieve.
Physically, animate and inanimate systems are distinctly separable by one quantifiable aspect: their ability to generate reproducible complex patterns. Contrary to intuition, there are no two identical snowflakes while the bodies of insects are covered with patterns that are indistinguishable across individuals Wigglesworth (1940); Maynard-Smith (1960); Lawrence (1973). As illustrated by snowflakes, pattern formation occurs under non-equilibrium conditions: it is history-dependent and sensitive to initial conditions, rendering it difficult to predict final outcomes Cross (1993). As a general rule, pattern formation in biological processes such as morphogenesis proceeds sequentially, interpolating coarser patterns of previous processes to achieve finer differentiation Thompson (1917); Cross (2009). Despite the tendency for amplifying variability from one patterning layer to the next in addition to differences in the genetic and environmental conditions, complex final structures are formed with high reproducibility. Morphogenesis has solved the reproducibility problem in non-equilibrium processes, but its strategy remains unclear.
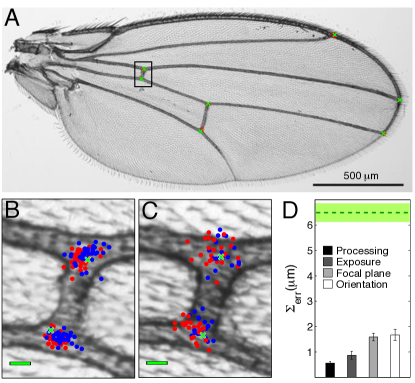
The bilaterally symmetric wings of insects, such as the fruit fly, provide an ideal opportunity to identify quantitative rules of biological pattern formation. Fly wings have highly stereotyped blade structure with a pattern of five longitudinal and two transverse veins (Fig. 1A). Each wing is generated from a disc with 50,000 cells in the fly larva (Table I), where the positions of wing features are specified by spatially distributed molecular signals Celis (2003). The fly provides us with two independent handles for quantifying the patterning process: first, because the formation of the left and right wing is essentially a reiteration of the same process under identical conditions VanValen (1962); Debat (2003), the two wings are an internal control for the precision of the patterning process, i.e. a measure for bilateral symmetry. Second, in randomly chosen left and right wings from a population of flies, wing formation is enacted under different conditions for each individual, allowing for a measure of pattern reproducibility. Thus, we can carry out a performance analysis of wing morphogenesis and probe the limits of precision and reproducibility to assess developmental patterning fidelity.
Wing morphogenesis is controlled by a multitude of genes Carreira (2011) as well as by environmental factors such as developmental temperature Debat (2003). Here we quantify how the final wing architecture is modified across the naturally occurring genetic variation in wild-type fly populations as well as by developmental temperatures within the viable range. Our measurements show that, independent of the particular genetic makeup and the temperature set-point, the final wing pattern precision is at the level of half the linear dimension of a single wing cell. For some specific sets of genetic and temperature conditions, the system performs as reproducibly as it is precise; for no set is the reproducibility worse than the linear cell size. Given that a single cell is the minimal physical unit at which tissue patterning can be realized, our findings suggest that wing patterning is optimized to operate at the physical limit of the system.
Naturally, the two most prominent features characterizing a wing are its size and its shape or pattern. Notably, the wing pattern is scalable and independent of size variation Breuker (2006) which allows us to quantify only variations in wing vein patterning; size variations depend on nutritional intake which is difficult to control footnote_wing_size . Size invariance allows us to apply a succession of affine transformations on each wing from a given data set, known as Procrustes transformations Bookstein (1991), in order to only quantify variations in the principle pattern features Klingenberg (2000); Zimmerman (2000) (see Supplementary Material SM (2013)). Pattern features are captured by a configuration of seven landmark coordinates , which demarcate wing vein crossing points (Fig. 1A); wing size is measured by the Euclidean norm of the configuration (Fig. S1 SM (2013)). Deviations from a mean reference pattern are minimized in an iterative procedure. The average linear (1d) variation in the spatial landmark location is captured by the invariant trace of the covariance matrix of the seven landmark coordinates (i.e. dimensions):
Importantly, this transformation reconstructs a mean wing of size , which allows us to measure departures from the mean pattern in absolute units and compare these to a physically relevant length scale such as the size of a wing cell footnote_cell_size . Additionally, there are systematic differences in the vein patterning between sexes Carreira (2011), and thus we assess pattern variations in males and females separately. Particularly surprising is the accuracy with which transformed right wings overlap in the least (Fig. 1B) and most (Fig. 1C) variable landmark distributions among all examined fly lines. In both cases the spatial extent of the landmark distributions is comparable to the average linear dimension of an individual wing cell (i.e. SM (2013)). Moreover our experimental error in determining the location of individual landmarks only represents a small fraction if that SM (2013), i.e. (Fig. 1D), implying that we are measuring mostly true biological variation. Hence, the spatial variation of the landmarks demonstrates a remarkable level of scale invariance and a highly conserved vein pattern.
To measure precision and reproducibility requires us to superimpose pairs of transformed wings and to quantify their spatial variations in terms of the differences between landmark locations. Precision is assessed from the differences in landmark locations between the left and right wing in the same fly, while reproducibly is computed by the differences in landmark locations of a pair of randomly chosen left and right wing from the entire fly population (note the prime marking different individuals). To obtain the average landmark within-individual variance (), we calculate the covariance matrix of the differences in the landmark coordinates of pairs of wings . Therefore corresponds to the average variation in the distance between landmarks and is statistically related to the 1-d variation of landmark locations defined above (Fig. S1 SM (2013)). Analogously, average landmark individual-to-individual variations () are computed from random pairs of wings in the population. Note that high precision or reproducibility are measured as low variations .
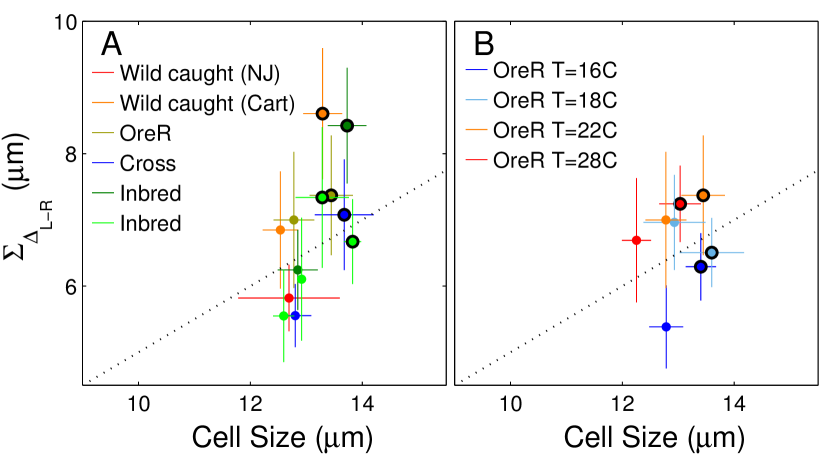
We first assess the fidelity of the patterning process by quantifying its precision in different genetic (Fig. 2A) and temperature (Fig. 2B) scenarios from the naturally available ranges. In particular, we utilize populations of flies with different levels of genetic heterogeneity: i.e. homogenous populations of individuals with identical genotype (called inbreds), intermediate heterogeneity (crosses of inbreds or laboratory-bred Ore-R flies) and wild-caught populations. All fly populations are raised in identical environmental conditions and at room temperature (i.e. C), except when effects of developmental temperature are directly explored, for which we chose population-specific temperature set-points within the viable range (i.e. C to C). A priori, one expects that changes in genetic makeup lead to changes in precision Debat (2003), and that non-optimal environmental conditions such as extreme temperatures are stressful to the patterning process and reduce its precision Breuker (2006). Surprisingly, the precisions for each of our fly lines cluster around half a cell size (denoted as dotted lines in Fig. 2), independent of genetic heterogeneity or highly non-optimal growth temperatures. For the landmark distributions in Fig. 1 this result indicates that the system-intrinsic error in positioning landmarks is of the order of half a cell footnote_cell_size . The remaining spread of the landmark distribution around the mean location must therefore reflect systematic effects which we will now interpret through measurements of pattern reproducibility.
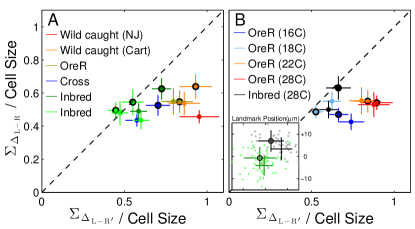
The simplest way to assess pattern reproducibility is to directly contrast it with the precision measurements in a scatter plot for both genetic and temperature scenarios (Fig. 3). The observed constancy of patterning precision suggests that spatial decisions are matched to the linear dimension of a wing cell. Therefore, to compare different fly lines, the measurement are normalized by the average cell size of the respective fly line (see Fig. S2 SM (2013)). Thus variations due to differences in the inherent length scale are excluded and, as a result, the spread on the precision axis tightens (converging to half a cell size), but not on the reproducibility axis.
In each case, we observe conditions for which the wings in different animals are as similar to each other as the wings within an individual. These conditions are identified by data that cluster along the diagonal , implying that the same high fidelity patterning program must operate in every single wing, be it within or across individuals. In the genetic case (Fig. 3A), these ideal conditions are attainable only for populations comprising individuals with identical genetic composition (i.e. inbreds, raised in the same environment). For these flies, the vein pattern cannot identify whether two random wings in a population stem from the same individual or not, indicating that wing patterning proceeds independently in left and right wings of a given fly.
Since individuals from a homogeneous population have nearly indistinguishable vein patterns, the decrease in reproducibility in a heterogeneous fly population (spread on x-axis in Fig. 3A) must result from an increasing number of genetic compositions, which modify the mean landmark configuration and hence widen the distribution of landmark locations. Each landmark configuration corresponds to a particular genetic composition, which when observed in an inbred population, would generate a pattern variation that is at the above observed precision optimum. However, when multiple landmark configurations are mixed in a population, the reduced reproducibility results from fluctuations caused by changes in the means of the different configurations, thus increasing the overall spread of the population distribution. Remarkably, the bounds on reproducibility are surprisingly small; they are as large as only a single wing cell and as low as half of that, rendering all vein patterns identical at that limiting resolution.
In the temperature case (Fig. 3B), we observe an optimum at C for which vein patterns are as precise as reproducible even in a fly line that contains genetic heterogeneity. Reproducibility decreases for lower and for higher temperatures, possibly due to temperature-induced stress that affects the fidelity of the patterning process. However, contrary to that intuition, the constant precision across all temperature set-points indicates that the large spread along the reproducibility axis more likely results from temperature induced amplification of the genetic differences in that fly population rather than from a decline in patterning fidelity. We can test this conjecture directly in an inbred fly population where two subsets are raised at two non-optimal temperature conditions (e.g. C and C). In these populations temperature has no effect on the overall variability in landmark positions: wings in the same animal are as similar as those in different animals (green and black data in Fig. 3A and 3B, respectively). For these conditions, the vein pattern is indeed generated with half a cell precision, but two distinct mean landmark configurations are observed (Fig. 3B, inset, and Fig. S3 SM (2013)). Each configuration is generated with half a cell precision, and the overall reproducibility remains within a single cell.
Together, our observations point to a patterning program which operates analogously to a high fidelity production line, independently in each wing. The performance has a precision of half a cell, and it is stable under the range of naturally occurring genetic variations and environmental temperatures. Differences in either condition can only lead to systematic shifts of the means of the landmark locations, and the spatial limit of these shifts is at the level of the size of a single wing cell, rendering landmark configurations remarkably conserved. A genetically heterogeneous population is thus akin to an ensemble of production lines, each of which runs in identical ambient conditions and differs by its genetic composition. In all explored sets of genetic and environmental conditions, the key factor inducing changes in the vein pattern is an increasing genetic availability of landmark configurations in the fly population: the higher the number of configurations, the lesser the observed pattern reproducibility.
From a functional point of view the single-cell invariance of the vein pattern in both genetic and temperature scenarios might be surprising. However, symmetry between the left and right wing of an individual is functionally important for proper steering during flight Lehmann (2009) and for successful courtship Pavkovic (2011). Hence, some evolutionary pressure is expected on precision. Thus, while the functional role for single-cell reproducibility of the vein pattern is unknown, it is likely related to the animal’s overall flight control. The vein pattern is geometrically important for aerodynamic properties Combes (2003), while the ratio of wing size to body size relates to overall flight capability David (1994). Therefore single cell reproducibility might reflect the necessary level of scale invariance to ensure perfect aerodynamic control and the necessary level of size matching to maintain flight ability despite differences in body sizes.
We have primarily focussed on pattern variability and neglected considerations on the variability of wing size, mainly due to technical difficulties as mentioned above. Our results on patterning reproducibility suggest that wings form independently and no left–right communication is necessary (see also Fig. S3 SM (2013)). On the other hand it has been shown that hormonal signaling coordinates size determination of fly organs and, in particular, achieves similar wing size in the same animal Garelli (2012). But it remains possible that such a strategy solely ensures proper matching of organ proportions and is not required for final wing size determination and maintenance of bilateral symmetry Lawrence (2000).
Overall, our results support a straightforward strategy for the maintenance of bilateral symmetry during the wing generation process. Wing morphogenesis begins with as few as 6 cells in a 3h old embryo Wieschaus (1976) that undergo 12-13 divisions within 6 days to generate a disc in the fly larva with cells (Table I). At this point cells no longer divide, and cell–cell connectivity properties Classen (2005) and global mechanical deformations Aigouy (2010) shape the adult wing. As long as the seed cells on the left and the right sides of the developing wing structures are symmetrical, patterning can proceed independently with high fidelity on both halves of the fly and result in highly symmetric wings. This suggests that all spatial decisions in the previous layers of the wing formation process should be performed with a spatial precision better than that of the final product, i.e. a single cell. Indeed, a similar situation has been observed in the early embryo, where the classical example of reproducibility is the location of the first morphologic mark on an otherwise uniform sheet of cells, i.e. the cephalic furrow Namba (1997), whose location is also reproducible at the level of half a cell size Dubuis (2013); Liu (2013). This connection indicates that the spatial reproducibility of morphogenesis in the fly may be maintained throughout the entire 10 days of development.
In principle, morphogenetic processes in the fly could have reproducible outcomes by measuring at each stage the size of the relevant local “building block” of the pattern (i.e. an individual cell) and determining position with spatial precision of half of that unit’s size (Table I). This suggests that an error of half the size of the building block is a sufficient strategy for generating and maintaining spatial reproducibility from one patterning layer to the next. In particular, it seems to be sufficient to reproducibly generate a complex pattern comprised of as many as such units in the Drosophila wing. It is important to test how these constraints affect current models for growth and pattering at different stages of the wing formation process Kauffman (1978); Shraiman (2005); Hufnagel (2007).
| Wing features (developmental time) | Cells |
|---|---|
| Wing disc, embryo (3h) Wieschaus (1976) | |
| Wing disc, embryo (10h) Bate (1991) | |
| Wing disc, larva (24h) Garcia-Bellido (1971) | |
| Wing disc, pupa (6d) Garcia-Bellido (1971) | |
| Wing blade, adult (10d) | |
| Features (wing 10d; embryo 3h) | Size (m) |
| Wing length | |
| Wing cell size | |
| Wing landmark reproducibility | |
| Wing landmark precision | |
| Embryo length | |
| Embryo cell size Dubuis (2013) | |
| Embryo spatial reproducibility Dubuis (2013) |
Could optimized reproducibility be a general feature of morphogenesis? Our findings suggest that it might at least be the case for the maintenance of symmetric features during developmental growth. Interpreting variations in absolute units allows us to recognize that wing patterning runs with a precision of less than a single cell. Because it is individual cells that make fate determining decisions, a cell is arguably the minimal physical unit at which tissue patterning can be realized. We identify here a signature of optimization in developmental processes, which seemingly perform at their physical limit in generating patterns. Our work thus represents a necessary first step toward an understanding of reproducibility at non-equilibrium.
We thank P. Andolfatto, C. Broedersz, A. Kumar, A. Sgro, and M. Tikhonov for technical help and comments. This work was supported by National Institutes of Health Grant P50 GM071508 and by Searle Scholar Award 10-SSP-274 to Thomas Gregor.
References
- Wigglesworth (1940) V.B. Wigglesworth, J. Exp. Biol. 17, 180 (1940).
- Maynard-Smith (1960) J. Maynard-Smith, Proc. R. Soc. Lond. B 152, 397 (1960).
- Lawrence (1973) P.A. Lawrence, in Developmental Sytems:Insects, edited by S.J. Counce, C.H. Waddington. (Academic Press, London and New York, 1973), Vol. 2, p.157
- Cross (1993) A.M. Cross and P. Hohenberg, Rev. Mod. Phys. 65, 851 (1993).
- Thompson (1917) D.A.W. Thompson, On Growth and Form. (Cambridge University Press, Cambridge, UK, 1917).
- Cross (2009) M. Cross and H. Greenside, in Pattern formation and dynamics in nonequilibrium systems, (Cambridge University Press, New York, 2009)
- Celis (2003) J.F. de Celis, BioEssays, 25, 442 (2003).
- VanValen (1962) L. Van Valen, Evolution 16:125 (1962).
- Debat (2003) V. Debat, M. Begin, H. Legout and J. R. David, Evolution 57:2773 (2003).
- Carreira (2011) V.P. Carreira, I.M. Soto, J. Mensch and J.J. Fanara, BMS Dev Bio, 11:32 (2011).
- Breuker (2006) C.J. Breuker, J.S. Patterson, and C.P. Klingenberg, PLoS Bio (2006).
- (12) Notably, the area of fly wings scales by changing both cell number and cell size Birdsall (2000), which we recover in our direct cell size and wing area measurements (see Supplementary Material SM (2013).
- Birdsall (2000) K. Birdsall, E. Zimmerman, K. Teeter and G. Gibson, Evolution & Development (2000).
- Bookstein (1991) F.L. Bookstein, Morphometric tools for landmark data: geometry and biology. (Cambridge University Press, Cambridge, UK, 1991).
- Klingenberg (2000) C.P. Klingenberg and S. Zaklan, Evolution 54: 1273 (2000).
- Zimmerman (2000) E. Zimmerman, A. Palsson, and G. Gibson, Genetics 155:671 (2000).
- SM (2013) See Supplemental Material at LINK for additional information regarding the experiments and derivations.
- (18) While we interpret spatial variations of wing landmarks in absolute units (i.e. m), it is helpful to compare these to a physically relevant length scale in the system such as the size of a wing cell. Adult fly wings have two types of cells: vein cells and blade cells. Both cell types are approximately the same size, and blade cells are hexagonally packed and easily identifiable optically, which allows us measure their cell size for each of our fly lines SM (2013). Additionally, cell size correlates with the total area of the wing; the average wing size is systematically larger by in females than in males, but within sexes varies by less than SM (2013). Due to evidence for differences in wing patterning between sexes Carreira (2011), we measure cell size and assess precision and reproducibility in males and females separately.
- Lehmann (2009) F.O. Lehmann, Flying insects and robots, (ed. Floreano D, Springer, Heidelberg, Germany, 2009).
- Pavkovic (2011) S. Pavković-Luĉić V. Kekić et al., Rev. Bras. Entomol. 55:, 583 (2011).
- Combes (2003) S.A. Combes and T.L. Daniel, J. Exp. Bio 206, 2979 (2003).
- David (1994) J.R. David, B. Moreteau, J.P. Gauthier, G. Petavy, A.Stockel, and A.G. Imasheva, Genet. Sel. Evol., 26, 229 (1994).
- Garelli (2012) A. Garelli, A. M. Gontijo, V. Miguela, E. Caparros, and M. Dominguez, Science, 336:579 (2012).
- Lawrence (2000) S.J. Day, and P.A. Lawrence, Development, 127, 2977 (2000) .
- Wieschaus (1976) E. Wieschaus and W. Gehring, Dev. Bio, 50, 249 (1976).
- Classen (2005) A.K. Classen, K.I Anderson, E. Marois, and S. Eaton, Dev. Cell 9, 805 (2005).
- Aigouy (2010) B. Aigouy, R. Farhadlfar, D.B. Staple, A. Sagner, J.C. Röper, F. Jülicher, and S. Eaton, Cell 142, 773 (2010).
- Namba (1997) R. Namba, T.M. Pazdera, R.L. Cerrone, and J.S. Minden, Development 124, 1393 (1997).
- Dubuis (2013) J.O. Dubuis, R. Samanta, and T. Gregor, Mol. Sys. Bio 9:639 (2013).
- Liu (2013) F. Liu, A.H. Morrison, and T. Gregor, Proc. Natl. Acad. Sci., 110, 6724 (2013).
- Kauffman (1978) S.A. Kauffman, R.M. Shymko, and K. Trabert, Science, 199, 259 (1978).
- Shraiman (2005) B.I. Shraiman, Proc. Natl. Acad. Sci., 102, 3318 (2005).
- Hufnagel (2007) L. Hufnagel, A.A. Teleman, H. Rouault, S.M. Cohen, and B.I. Shraiman, Proc. Natl. Acad. Sci., 104,3835 (2007).
- Bate (1991) M. Bate, and A.M. Arias, Development, 112, 775 (1991).
- Garcia-Bellido (1971) A. Garcia-Bellido and J.R. Merriam, Dev. Bio, 24, 61 (1971).